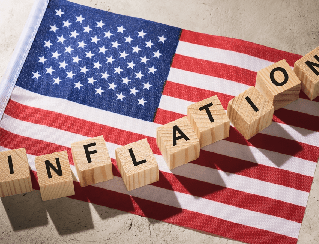
US stocks dropped sharply on Thursday, coming under intense selling pressure, and closed firmly in the red after two Federal Reserve officials said they were considering 50 basis-point interest rate hikes to battle persistently high inflation. The firmer US data that allows the Fed policymakers to remain hawkish lend support to the US dollar and weighed heavily on the equity markets. On Thursday, St. Louis Federal Reserve’s James Bullard and Cleveland Fed President Loretta Mester both embraced more significant hikes as they said that continued policy rate increases can help lock in a disinflationary trend during 2023 and would not rule out supporting a half-percentage-point increase at the Fed’s March meeting. On top of that, the US Producer Price Index (PPI) for January gained major attention as it jumped the most since June with a 0.7% MoM figure, reviving speculation the US Federal Reserve will maintain the pace of tightening for more than anticipated. On the Eurozone front, ECB’s monthly bulletin said that future policy rate decisions will continue to be data-dependent and follow a meeting-by-meeting approach.
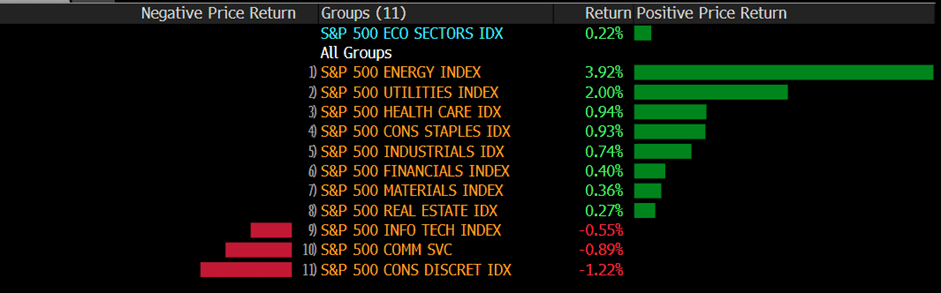
The benchmarks, S&P 500 and Dow Jones Industrial Average both declined lower on Thursday as the S&P 500 suffered from daily losses after the US Dollar reached fresh weekly peaks. The S&P 500 was down 1.4% daily and the Dow Jones Industrial Average also retreated lower with a 1.3% loss for the day. All eleven sectors in S&P 500 stayed in negative territory as the Consumer Discretionary sector and the Information Technology sector is the worst performing among all groups, losing 2.16% and 1.75%, respectively. The Nasdaq 100 meanwhile dropped the most with a 1.9% loss on Thursday and the MSCI World index was little changed for the day.
Main Pairs Movement
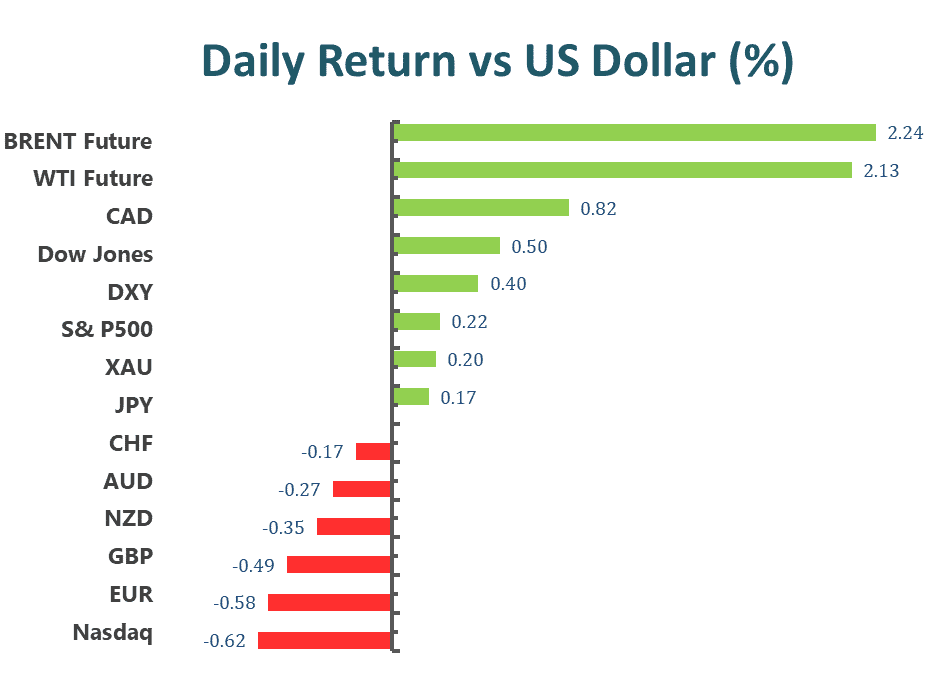
The US dollar edged higher on Thursday, refreshing its weekly peaks against most major rivals near the 104.20 level but gave back some ground ahead of the Wall Street close amid the downbeat market mood. The US Producer Price Index (PPI) bolsters hawkish Federal Reserve bets and fuels US Treasury bond yields. The latest FEDWATCH read from Reuters also signals that the interest rate futures market shows US rates could peak close to 5.25% by July.
GBP/USD declined lower on Thursday with a 0.31% loss after the cable extended its downside momentum and touched a daily low below the 1.1970 mark amid the higher-than-expected US PPI data. On the UK front, the softer UK CPI reflected that the Bank of England would not need to tighten monetary conditions aggressively. Meanwhile, EUR/USD also witnessed selling interest and dropped to a daily low below the 1.0660 area. The pair was down almost 0.14% for the day.
Gold was little changed with a 0.02% gain for the day after regaining some upside traction and rebounded from the $1828 area during the US trading session, as the higher US PPI and renew hawkish bias for the Federal Reserve continued to exert bearish pressure to the Gold price. Meanwhile, WTI Oil retreated lower with a 0.13% loss for the day.
Technical Analysis
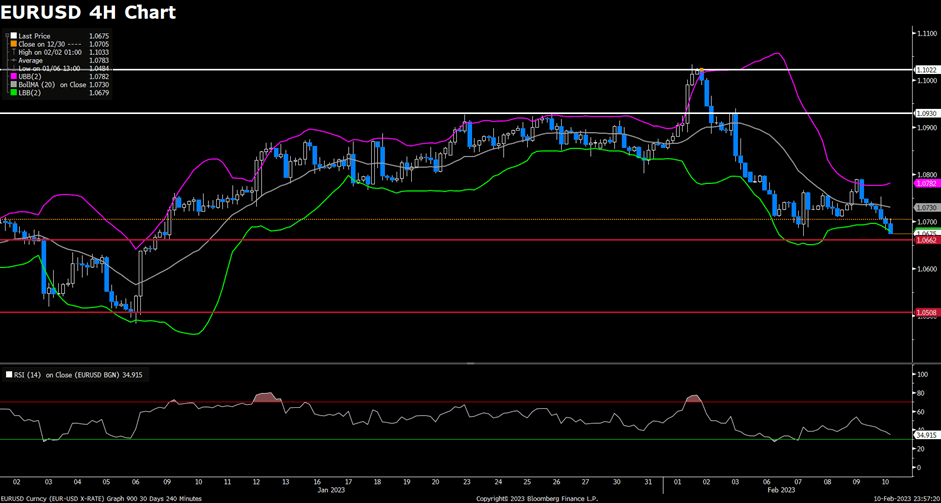
EURUSD (4-Hour Chart)
The EURUSD came under modest bearish pressure and stayed below 1.0700 during the US trading session on Thursday. The pair confronted another selling pressure after US Producer Prices rose more than expected a monthly 0.7% in January and 6.0% from a year earlier. Still, on the strong side, weekly Initial Claims increased by 194K in the week of February 11, showing once again the persistent good health of the labor market. Moreover, Cleveland Fed and well-known hawk L.Mester reiterated that inflation remains too high at the time when she noted that the current Fed’s tightening cycle should slow growth and increase unemployment.
From a technical perspective, the four-hour scale RSI indicator remained neutral at 43 figured as of writing, suggesting that the pair was surrounded by modest negative traction. As for the Bollinger Bands, the pair was supported by the lower band and the pair touched the lower bands three times, showing this is a critical support level for the near term. As a result, we think the bears could put their eyes on the 1.0510 level once the EURUSD fell below the 1.0656 support level.
Resistance: 1.0930, 1.1020
Support: 1.0656, 1.0508
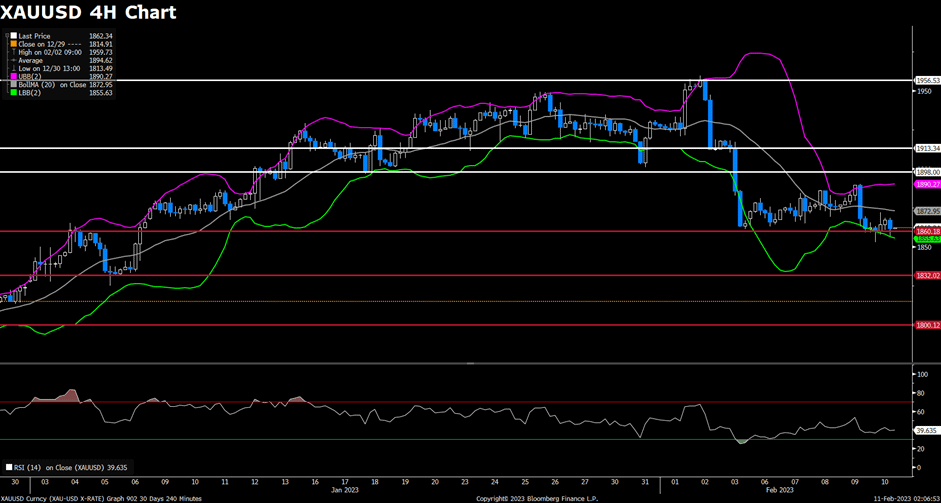
XAUUSD (4-Hour Chart)
The XAUUSD extended its bearish route and dropped to a fresh February low of $1827 marks after the release of US macroeconomic data. Currently, the US Dollar remained its upside tendency and earned modest growth daily. The US labor market remains tight, while there were more signs of inflation easing at a slower-than-anticipated pace. The January Producer Price Index (PPI) rose at an annualized pace of 6%, easing from 6.5% in December but missing the 5.4% anticipated by financial markets. Following the report, Federal Reserve Loretta Mester said that inflation remains too high and with the risks skewed to the upside, hinting the terminal rate could be well above 5%.
From a technical perspective, the four-hour scale RSI indicator figured 44 as of writing, showing the gold pair was surrounded by a modest headwind. As for the Bollinger Bands, the pair continued to trade in the lower area and failed to challenge the 20-period moving average several times. In our view, the downside tendency would persist in the near future unless the pair could stand firmly in the upper area.
Resistance: 1870, 1900, 1920
Support: 1830, 1800
Economic Data
Currency
Data
Time (GMT + 8)
Forecast
GBP
Retail Sales (MoM) (Jan)
15:00
-0.30%
Written on February 17, 2023 at 4:15 am, by anakin
US stocks closed higher and Treasuries slid as investors picked through another batch of solid economic data to find different takeaways, even as worries mounted that it would force a hawkish response from the Federal Reserve.
The S&P 500 rose 0.3% after earlier dropping more than 0.75%. The Nasdaq 100 climbed 0.8%. Two-year Treasury yields held near 4.60%. The dollar advanced versus major peers.
US retail sales in January jumped by the most in almost two years, suggesting that solid consumer spending will keep prices elevated and increase pressure on the Fed to step up its efforts to tamp down inflation. Homebuilder sentiment rose in February by the most since mid-2020, as easing mortgage rates have boosted the housing market.
The energy was a drag on the broader market, falling 2%, driven by a slump in Devon Energy pressured by a slump in oil prices following a much larger-than-expected build in U.S. weekly crude stockpiles.
U.S. crude stockpiles rose by 16.3 million barrels last week to 471.4M barrels, well above expectations of 1.2M barrels.
Main Pairs Movement
The US Dollar firmed mid-week to a six-week high against a basket of currencies measured by the DXY index. The index has penetrated a key 103.80 level on the charts amid risks of higher inflation for longer and the markets flipping the script of the Federal Reserve pivot narrative. The index maintains erratic activity around 103.00 so far. The monthly high near 104.00 continues to cap the upside. At the time of writing, the price is trading at 103.754.
AUD/USD stands on slippery grounds as sellers rush towards the weekly low of 0.6864, marked the previous day, following a nearly 40 pips slump on the downbeat Australia inflation and employment numbers. At the time of writing, the price is trading at 0.6888.
GBP/USD continued to move lower in the second half of the day, falling below 1.2000 for the first time in a week before recovering slightly. Weak U.K. inflation data and broad-based dollar strength weighed heavily on the pair on Wednesday. At the time of writing, the price traded at 1.20389.
Technical Analysis
EURUSD (4-Hour Chart)
The EURUSD has extended its daily slide and further declined below the 1.067 level as of writing, as the US Retail Sales data rose at a stronger pace than expected in January, boosting the US Dollar and weighing on the pair. The US core retail sales surged to 2.3%, compared to the expected 0.8% and previous -0.9%, showing strong demand in the retail market. The euro price action around the European currency should continue to closely follow dollar dynamics, as well as the potential next moves from the ECB after the bank has already anticipated another 50 bps rate raise at the March event.
From the technical perspective, the four-hour scale RSI indicator further dropped to 38 figures as of writing, suggesting that the pair was surrounded by strong bearish momentum. As for the Bollinger Bands, the pair fell below the 20-period moving average and was trading in the lower area, showing an optimistic market mood. Currently, the pair were struggling to hold above a critical support level, 1.0667. The bears could target on 1.050 level once the pair lose its ground around the key support level.
Resistance: 1.0930, 1.1020
Support: 1.0667, 1.0508
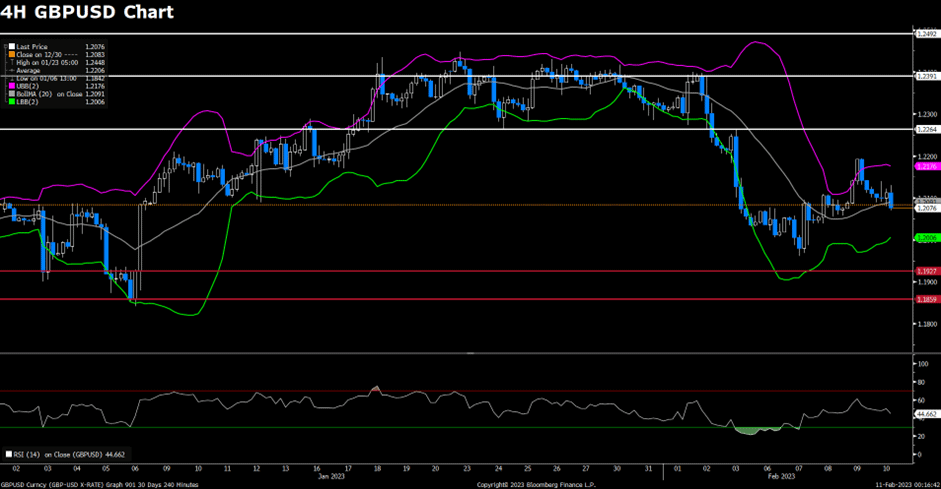
GBPUSD (4-Hour Chart)
The GBPUSD continued to push lower in the American trading session and dropped below 1.2000 for the first time in a week before recovering modestly. Soft UK inflation data and the strong US dollar across the board heavily weighed on the pair. The UK’s Office for National Statistics reported on Wednesday that the Consumer Price Index declined 0.6% every month in January, causing the annual rate to retreat to 10.1% from 10.5%. The Core CPI also edged lower to 5.8% from 6.3% every year coming in lower than the market expectation of 6.2%. Although it’s too early to say how these figures could influence the Bank of England (BoE) policy outlook, the reaction suggests that markets have scaled back hawkish BoE bets.
From the technical perspective, the four-hour scale RSI indicator tumbled to 34 figures as of writing, showing the pair is amid negative traction. As for the Bollinger Bands, the pair was supported by the lower band and the size between the upper and lower bands got larger, indicating there might be a further decline once the pair fell below the lower band.
Resistance: 1.2209, 1.2265, 1.2391
Support: 1.1927, 1.1859
XAUUSD (4-Hour Chart)
Gold price dropped sharply towards $1,830 on Wednesday as the US dollar regather strength and the benchmark 10-year US Treasury bond yield keeps rallying, which exerted heavy pressure on Gold prices. At the time of writing, the pair is trading at $1,837.59, posting a 0.87% loss daily, while the US dollar index rose 0.57% to 103.86 and the benchmark 10-year US Treasury bond yield rose 1.49% to 3.803%, capping any rebound on Gold price.
For the technical aspect, RSI indicator 35 figures as of writing, keeps going South as the price continues on its downward movement in the near term. As for the Bollinger Bands, the price is falling between the downward moving average and the lower band, which is a typical pattern of a downtrend. A continued bearish trend could be expected. In conclusion, we think the market is in bearish mode as both indicators show bearish potential. Besides, the price is edging lower and keeps forming a lower-low technical pattern, which favors the bearish side. For the downtrend scenario, the price is testing the support level at $1,830. If the price is below the level, it may trigger some technical selling and drag the price deeper toward the next critical support at a round-figure mark of $1,800.
Resistance: 1900, 1920, 1957
Support: 1830, 1800
Economic Data
Currency
Data
Time (GMT + 8)
Forecast
AUD
Employment Change (Jan)
08:30
20.0K
USD
Building Permits (Jan)
21:30
1.350M
USD
Initial Jobless Claims
21:30
200K
USD
Philadelphia Fed Manufacturing Index (Feb)
21:30
-7.4
USD
PPI (MoM) (Jan)
21:30
0.40%
Written on February 16, 2023 at 2:37 am, by anakin
The Dow closed lower Tuesday, as investors digested the latest data showing signs of cooling, but stickier inflation that triggered a jump in Treasury yields on bets for a more aggressive Federal Reserve. The Dow Jones Industrial Average fell 0.46% or 156 points, the Nasdaq was up 0.57%, and the S&P 500 was flat.
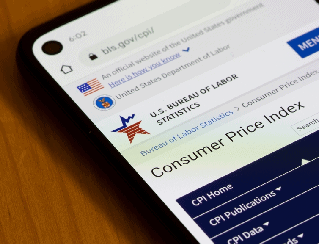
The consumer price index rose 0.5% last month, in line with expectations, but for the 12 months through January was 6.4%, above expectations of 6.2%. Core inflation, which strips out energy and food prices, slowed to an annualized pace of 5.6% in January, though that was smaller than the expected decrease of 5.5%.
Stocks in Asia are primed for a cautious open after a choppy day on Wall Street ended flat as investors balanced hot inflation data with Federal Reserve commentary suggesting US interest rates may soon peak.
Shares in Australia fell and equity futures in Japan and Hong Kong inched higher. US futures edged lower in early Asian trading. The S&P 500 ended Tuesday little changed while the tech-heavy Nasdaq 100, which is more sensitive to higher interest rates, rose 0.7%.
Main Pairs Movement
US DXY gauges the greenback versus a basket of its main competitors, try to regain some composure, and leaves behind earlier lows in the lower 103.0 regions on turnaround Tuesday. The dollar was largely unchanged based on the US core CPI (MoM, Jan) figure fits market expectations with a 0.4% rise, CPI (YoY, Jan) 6.4% with 0.2% higher than forecast, and CPI (MoM, Jan) 0.5%.
At the time of writing, the price traded at 103.269, twenty minutes before the trading session closing.
Although the Fed hawks joined the technical breakdown to tease the Gold bears, the metal’s further downside hinges on how well the scheduled United States data can entertain the XAU/USD sellers. Among them, US Retail Sales for January, expected at 1.8% versus -1.1% prior, will be closely watched for clear directions. Should the data management reverse the previous monthly contraction, the odds of witnessing further XAU/USD downside can’t be ruled out. At the time of writing, the price traded at 1853.91.
WTI oil bears seek a break of $79.00 to open the floodgates. US crude prices are adding to earlier declines, falling after the US consumer price index data and during the Wall Street cash open. At the time of writing, the US oil price traded at 78.837.
Technical Analysis
EURUSD (4-Hour Chart)
The EURUSD erased most of its daily gains and began to turn south after reaching a daily high of 1.0800 level, as investors continued to react to the US Consumer Price Index report. The pair lost its upside momentum following US CPI rose at an annualized 6.4% in January and 5.6% when it comes to the Core CPI, higher than the expected 6.2% and 5.5% respectively. Moreover, the Dallas Federal Reserve President Lorie Logan said, “We must remain prepared to continue rate increases for a longer period than previously anticipated, if such a path is necessary to respond to changes in the economic outlook or to offset any undesired easing in conditions,” which managed to provide a boost for US Dollar, in turn, undermining the pair.
From the technical perspective, the four-hour scale RSI indicator slid back to the neutral area, suggesting that the upbeat market mood has faded. As for the Bollinger Bands, the pair was priced in the upper area and supported by a 20-period moving average, showing that the EURUSD currently has no clear direction to move and investors would carefully reassess the future path.
Resistance: 1.0930, 1.1020
Support: 1.0666, 1.0508
GBPUSD (4-Hour Chart)
The GBPUSD dropped dramatically in American trading hours following the release of inflation data in the United States. US CPI cooled on an annual basis but was higher than forecasts US inflation reported by the Department of Labor (DoL) showed that the Consumer Price Index (CPI) for January rose by 6.4% YoY, above estimates of 6.2%, while core CPI jumped to 5.6% YoY, against data estimated at 5.5%. Monthly basis regardings were in line with estimates. After the data release, US Treasury bond yields advanced, with the US 2-year Treasury bond yield edging towards 4.622%, as an initial reaction to the data, which warrants further tightening by the US Federal Reserve (Fed). Domestic, according to Reuters, wages in Britain grew quickly in the last quarter of 2022, keeping the Bank of England (BoE) pressured.
From the technical perspective, the four-hour scale RSI indicator slightly fell to 59 figures as of writing, suggesting that the pair was surrounded by strong positive traction. As for the Bollinger Bands, the pair kept trading in the upper area and the gap size tend to be larger, showing the GBPUSD was more favored to the upside path.
Resistance: 1.2265, 1.2391, 1.2492
Support: 1.1927, 1.1859
XAUUSD (4-Hour Chart)
The gold price tumbled to a fresh monthly low at $1843.36 for the first time since January after Wall Street’s opening and following the US Consumer Price Index (CPI) release. According to the US Bureau of Labor Statistics, the CPI rose by 6.4% every year in January, easing from 6.5% previous but higher than the 6.2% expected. The core CPI rose by 5.6% every year, also easing from the previous but higher than expectations. On the upside, inflationary pressures continue to ease but not enough to take the Fed away from its tightening path. At the time of writing, the pair is trading at $1,855.93, posting a 0.12% gain daily, while the benchmark 10-year US Treasury bond yield rose 1.57% to 3.765%, exerting selling pressure on Gold price.
For the technical aspect, RSI indicator 42 figures as of writing, maintaining around selling region as the price keeps moving under selling pressure in the near term. As for the Bollinger Bands, the price is hovering between the downward moving average and the lower band. The bearish trend should persist. In conclusion, we think the market is in bearish mode as both indicators show bearish potential. Besides, the price is edging lower and keeps forming a lower-low technical pattern, which favors the bearish side. For the downtrend scenario, the next support level is $1,830. If the price close below the level, it may trigger some technical selling and drag the price deeper.
Resistance: 1900, 1920, 1957
Support: 1830, 1800
Economic Data
Currency
Data
Time (GMT + 8)
Forecast
GBP
CPI (YoY) (Jan)
15:00
10.3%
USD
Core Retail Sales (MoM) (Jan)
21:30
0.8%
USD
Retail Sales (MoM) (Jan)
21:30
1.8%
EUR
ECB President Lagarde Speaks
22:00
USD
Crude Oil Inventories
23:30
1.166M
Written on February 15, 2023 at 1:40 am, by anakin
US stocks advanced higher on Monday, witnessing upside strength, and ended the previous day with broad gains amid the market’s mildly positive sentiment. The better market mood during European trading hours pushed the US Dollar into the red across the FX board and provided firm support to equity markets.
Investors now waiting for the release of the January United States Consumer Price Index (CPI), which is foreseen raising at an annualized pace of 6.2% and has a high impact on financial markets. On top of that, Fed Governor Michelle Bowman said on Monday that the Federal Reserve will need to continue to raise interest rates to bring inflation back down to the central bank’s target rate. Market sentiment improved as fears surrounding the United States and China eased afterward on comments from the US General, who turned down the fears while rejecting calls to believe that those flying objects were from China. On the Eurozone front, bets for additional jumbo rate hikes from the European Central Bank (ECB) in the coming month lend some support to the Euro.
The benchmarks, S&P 500 and Dow Jones Industrial Average both advanced higher on Monday as the S&P 500 closed higher when traders brace for the Consumer Price Index (CPI) for January amid mixed clues. The S&P 500 was up 1.1% daily and the Dow Jones Industrial Average also climbed higher with a 1.1% gain for the day. Ten out of eleven sectors in the S&P 500 stayed in positive territory as the Information Technology sector and the Consumer Discretionary sector are the best performing among all groups, rising 1.77% and 1.46%, respectively. The Nasdaq 100 meanwhile rose the most with a 1.6% gain on Monday and the MSCI World index was down 0.3% for the day.
Main Pairs Movement
The US dollar retreated lower on Monday, remaining under pressure, and dropped to a daily low below 103.30 level amid the upbeat market mood. The upbeat US equities and a pullback in the US Treasury bond yields after multiple days of run-up both acted as a headwind for the greenback. However, the absence of relevant macroeconomic releases and the upcoming US CPI report limited the intraday US Dollar slide.
GBP/USD advanced higher on Monday with a 0.64% gain after the cable preserved its upside traction and touched a daily high above the 1.2140 mark amid a modest recovery in the global risk sentiment. On the UK front, the country will publish its latest employment figures on Tuesday. Meanwhile, EUR/USD also witnessed buying interest and climbed to a daily high of around the 1.0725 area. The pair was up almost 0.42% for the day.
Gold declined lower with a 0.65% loss for the day after witnessing selling momentum and extended its slide towards the $1850 area during the US trading session, as the hawkish Fed comments keep the market’s fears of tighter monetary policy and weigh on the Gold price. Meanwhile, WTI Oil advanced higher with a 0.53% gain for the day.
Technical Analysis
EURUSD (4-Hour Chart)
The EURUSD regained its recovery momentum near the 1.071 level during the early American trading session, as investors waited for Tuesday’s highly-anticipated inflation data. The US dollar erased most daily gain in US trading hours amid the upbeat Wallstreet’s major indices opening, the DXY index was trading at 103.35 level as of writing. The market participants put all their focus on US Consumer Price Index (CPI) released on Tuesday and continued to reassess the future Federal Reserve(Fed) decisions, favoring the market move in a volatile path. In Eurozone, the European Commission released the quarterly Economic Growth Forecast report. The report failed to provide a boost for the Euro currency, despite showing upward revisions to economic growth and downward revisions to inflation.
From a technical perspective, the four-hour scale RSI indicator regathered bullish strength, reading 51 as of writing, which suggested that the pair mildly corrected toward the upside. As for the Bollinger Bands, the pair was pricing above the 20-period moving average, showing that the pair currently attracted some positive traction.
Resistance: 1.0930, 1.1022
Support: 1.0662, 1.0508
GBPUSD (4-Hour Chart)
The GBPUSD gathered recovery momentum and extended its daily rebound in the American trading session toward the 1.2150 level. The positive shift witnessed in risk sentiment seems to be causing the haven US Dollar to lose interest and fueling the pair’s upside ahead of Tuesday’s key macroeconomic data releases. Rising bets for further policy by the Federal Reserve (Fed) should help limit the downside for the USD and cap gains for the pair. Apart from this, a dovish assessment of the Bank of England (BoE) decision last week warrants some caution before placing aggressive bullish bets around the pound pairs.
From the technical perspective, the four-hour RSI indicator climbed to 56 as of writing, suggesting that the pair now was surrounded by bullish momentum. As for the Bollinger Bands, the pair was priced above the 20-period moving average and wandered in a range from 1.2000 to 1.2200, showing the pair have no clear path in near future.
Resistance: 1.2264, 1.2391, 1.2492
Support: 1.1927, 1.1859
XAUUSD (4-Hour Chart)
Gold prices were struggling to hold above the $1850 mark after having advanced toward $1870 in the early European trading session. The prospects for further policy tightening by the Federal Reserve (Fed) continue to underpin the US Dollar and act as a headwind for the non-yielding Gold price. A slew of Federal Open Market Committee (FOMC) policymakers, including Fed Chair Jerome Powell, last week stressed the need for additional interest rate hikes to fully gain control of inflation. Now, the market focus remains glued to the crucial CPI inflation report. The data could influence the Fed’s rate-hike path and determine the near-term trajectory for the XAUUSD.
From the technical perspective, the four-hour scale RSI indicator further declined to 37 figures as of writing, suggesting that the pair was confronting heavy selling pressure. As for the Bollinger Bands, the gold continued to price along with the lower band, showing the pair was amid strong bearish traction. We think the yellow is more favorable to the downside path shortly before the CPI inflation report.
Resistance: 1898, 1913, 1956
Support: 1832, 1800
Economic Data
Currency
Data
Time (GMT + 8)
Forecast
GBP
Average Earnings Index +Bonus (Dec)
15:00
6.20%
GBP
Claimant Count Change (Jan)
15:00
17.9K
GBP
Core CPI (MoM) (Jan)
21:30
0.40%
USD
CPI (MoM) (Jan)
21:30
0.50%
USD
CPI (YoY) (Jan)
21:30
6.2%
Written on February 14, 2023 at 2:31 am, by anakin
The Dow Jones Industrial Average closed 0.5% higher at 33,869.4; the S&P 500 rose 0.22% to 4,090.48; the Nasdaq fell 0.61% to 11,718.12.
The NASDAQ on Friday closed lower as mega-cap growth stocks came under pressure after US Treasury yields pointed to higher interest rates and shares of ride-hailing firm Lyft plummeted 36 percent to US$10.31 as it lowered prices, raising concerns it was falling behind bigger rival Uber Technologies Inc. Uber shares also dropped 4.43 percent to US$34.30.
Yields on the benchmark 10-year Treasury note rose to their highest in more than a month following an auction on Thursday of 30-year bonds that drew weak demand.
Higher bond yields are going to adversely affect higher-growth technology companies.
A rally in energy stocks as oil prices climbed on Russia’s plans to cut crude supplies helped push up the Dow Jones Industrial Average and the S&P 500 Index.
After US equities were rattled over the week by strong jobs data, investors are waiting for last month’s consumer inflation data this week for clarity on the Fed’s rate-hike path.
Main Pairs Movement
The dollar rose on Friday as investors grew increasingly concerned that U.S. inflation data due out next week could be higher than market expectations, with earlier data showing that consumers expect prices to continue to rise next year. DXY reverses Thursday’s decline to weekly lows and regains the area well north of the 103.00 barriers on Friday. At the time of writing, the price is trading at 103.578.
Oil prices rose more than 2% on Friday and more than 8% weekly as Russia announced plans to reduce oil production next month after the West imposed price caps on Russian crude and fuel. The decision to cut production suggests that capping the price of its oil products has had an impact. However, two OPEC+ representatives told Reuters that OPEC+ plans to take no action after Russia announced production cuts. Goldman Sachs lowered its 2023 price forecast for Brent crude futures to $92 from $98 a barrel and its 2024 price forecast to $100 from $105.
Gold rose slightly on Friday as the market awaits next week’s U.S. inflation data, which could affect the Fed’s monetary policy trajectory. Spot gold rose 0.2% to $1,864.10 per ounce. At the time of writing, the price traded at $1,865.30.
Technical Analysis
EURUSD (4-Hour Chart)
The EURUSD dropped dramatically on Friday, as US Dollar regained strength amid investors’ worries about higher interest rates by the Federal Reserve. Currently, the spotlight has entirely shifted to the United States Consumer Price Index (CPI) data, which will release on Tuesday. As per the consensus, the headline inflation could soften to 5.8% on an annual basis vs. the prior release of 6.5%. Moreover, the core inflation that excludes the impact of oil and food prices is seen lower at 5.3% against the former release of 5.8%. In the Eurozone, the Eurozone inflation rate has shown a meaningful decline after easing energy prices and higher interest rates by the European Central Bank (ECB). However, the inflation rate is still hovering at extremely elevated levels, which needs a monetary policy sufficiently restrictive to tame inflation.
From the technical perspective, the four-hour scale RSI indicator slid to 35 figures as of writing, suggesting that the pair are surrounded by negative traction. As for the Bollinger Bands, the pair dropped below the lower band and the size between the upper and lower bands got larger, showing that the pair is more favored to the downside path shortly.
Resistance: 1.0930, 1.1022
Support: 1.0662, 1.0508
GBPUSD (4-Hour Chart)
The GBPUSD dropped below the 1.2100 level during the American trading session, as upbeat US Consumer Confidence data supported the US Dollar. The pair’s upside is limited by the mixed macroeconomic data released from the UK. The UK GDP report concentrated by 0.5% monthly in December and stagnated in the fourth quarter. On a positive note, Industrial Production expanded by 0.3% in December, surpassing the market expectation for a decrease of 0.2%. Nevertheless, investors currently keep their eyes on next week’s key inflation data from the US. Market participants could refrain from committing to large positions ahead of the key figures.
From the technical perspective, the four-hour scale RSI indicator remained at the neutral level, 45 figured as of writing, which shows that the pair now have no clear path to go and any signal might attract critical transactions to the pounds. As for the Bollinger Bands, the pair has just fallen below the 20-period moving average and no clear change in the gap size, suggesting that the market participants are waiting for further signals.
Resistance: 1.2264, 1.2391, 1.2492
Support: 1.1927, 1.1859
XAUUSD (4-Hour Chart)
Gold prices were struggling to hold near the $1860 mark as of writing, as the benchmark 10-year US Treasury bond yield is up more than 1% on the day above 3.7%, undermining the Dollar-denominated gold. Investors from worldwide are putting their focus on the Federal Reserve rate hike path, triggering additional legs to the US Dollar pullback come this Friday. The higher interest rate for longer weighs on the corporate sector, hurting global stocks. Apart from this, the end-of-the-week repositioning could also come into play, exacerbating the pain in the yellow metal price, as market participants gear up for next Tuesday’s key United States event release.
For the technical aspect, the four-hour scale RSI indicator 39 figures as of writing, continuing to hover in the neutral level. As for the Bollinger Bands, the price is trading below the 20-period moving average, showing that the pair is staying on the back foot. In conclusion, the price is capped in a narrow range so far this week, and it needs a decisive breakthrough to confirm the path in the near term. At the moment of writing, the price is currently struggling to hold above support at $1,860, and the pair continued to bear downside traction. If the price drops below the current support, it may trigger some technical selling and drag the price deeper.
Resistance: 1898, 1913, 1956
Support: 1860, 1832, 1800
Written on February 13, 2023 at 2:44 am, by anakin