Spain’s consumer price index rose by 1.2% month on month in March. This was above the 1.0% forecast.
The March figure was 0.2 percentage points higher than expected. No further details were provided.
Implications For ECB Policy
The higher-than-expected Spanish inflation figure for March is a significant data point, suggesting that price pressures within the Eurozone are more persistent than anticipated. This aligns with the recent flash estimate for the entire Eurozone, which showed headline inflation holding at a sticky 2.8%, surprising those expecting a faster decline. These figures force us to reconsider the timing and likelihood of the European Central Bank’s next interest rate cut.
Just last week, interest rate swap markets were pricing in a greater than 70% probability of a rate cut by June. Following this inflation data from Spain, a core European economy, those odds have now dropped to below 40%, signaling a major reassessment by the market. This supports the recent cautious tone from ECB officials who have stressed that policy decisions remain strictly data-dependent.
We should consider positioning for further Euro strength, as a more hawkish ECB will make the currency more attractive. Buying short-dated EUR/USD call options is an effective way to gain upside exposure while managing risk. The increased volatility in rate expectations will likely add to the premium on these options, but the potential payoff is significant if the ECB is forced to delay its easing cycle.
Market Positioning Considerations
Looking back at 2025, we saw how European equities rallied on the prospect of rate cuts after the difficult inflationary period that started back in 2022. This new data threatens that rally, making short positions on equity indexes like the Euro Stoxx 50 via futures contracts look increasingly attractive. Similarly, we anticipate German Bund futures will face downward pressure as yields must now adjust to the reality of stickier inflation for longer.
The US Dollar Index fell after gains earlier on Monday and ended the day sharply lower. Early Tuesday it stayed below 98.50, its lowest level since early March, before March PPI data later in the US session and speeches from major central bank officials.
On Iran, US President Donald Trump said the US had been approached by the “right people” and that they wanted a deal, and said a US blockade of the Strait of Hormuz had started. US Vice President JD Vance said talks made meaningful progress without a breakthrough, while the New York Times reported Iran proposed a 5-year nuclear suspension and the US sought 20 years.
Market Snapshot And Key Levels
US equities were mixed on Monday, with the S&P 500 down about 0.1% and the Nasdaq up more than 1%. Early Tuesday, US index futures were little changed.
Japan’s February industrial production fell 2% month on month, versus a forecast drop of 2.1%. USD/JPY traded near 159.20, EUR/USD rose towards 1.1800, and GBP/USD moved above 1.3500.
Gold recovered after dipping below $4,650 and moved towards $4,800, while WTI held slightly under $93.00.
We remember the US Dollar Index struggling below 98.50 this time in 2025, which gave a false sense of security. That dollar weakness proved temporary, as persistent US inflation, last reported at 3.4% for the first quarter of 2026, has forced the Federal Reserve to maintain its hawkish stance. We should therefore consider options strategies that protect against renewed dollar strength, a significant reversal from the market sentiment a year ago.
The tensions in the Strait of Hormuz mentioned last year never fully resolved, creating an underlying bid for oil prices. With roughly 25% of the world’s seaborne oil supply still transiting that chokepoint, West Texas Intermediate crude has been trading in a volatile range between $90 and $105 for the past six months. Volatility-based derivatives, such as straddles on oil futures, are an appropriate strategy to trade the unpredictable geopolitical headlines.
Positioning And Hedging Ideas
Last year’s mixed signal in equities, with the Nasdaq outperforming, evolved into a theme of narrow market leadership throughout 2025. Now, with the S&P 500’s top ten components making up over 35% of the index’s weight, the risk of a sudden correction is elevated despite the VIX holding near a low of 15. We are using put spreads on major indexes as a cost-effective hedge against a potential downturn in the coming weeks.
The push toward 1.1800 for EUR/USD in April 2025 now seems like a distant memory. The European Central Bank has since pivoted due to slowing growth, signaling potential rate cuts as Eurozone inflation fell to just 2.1% in the latest reading. This growing policy divergence with the Fed suggests that any short-term strength in the euro is an opportunity to position for further downside.
Gold’s rally toward $4,800 an ounce last year was a key signal, driven by persistent central bank buying which saw over 900 tonnes added to reserves globally through 2025. That underlying support, combined with geopolitical risk, has helped gold consolidate above the $5,000 level. We see buying call options on any significant dips as a prudent way to maintain upside exposure while defining risk in this high-priced environment.
Intel is pursuing a turnaround under CEO Lip-Bu Tan, with progress centred on the 18A process and a push towards AI infrastructure and manufacturing services. The share price has risen as the market reassesses Intel beyond a legacy chipmaker.
On near-term drivers, Panther Lake client chips built on 18A have started shipping, and server CPU demand is described as improving as AI workloads expand. Some analysts say Intel is close to sold out in server CPUs for 2026.
Intel has also announced partnerships and ties including Nvidia’s $5 billion investment, Google’s multiyear expansion around Xeon CPUs and custom IPUs, and participation in Terafab’s AI chip initiative. Intel has moved to buy back Apollo’s stake in its Ireland fab.
Risks include valuation and upcoming results, with Intel trading at about 63x 2027 estimated earnings, around three times Nvidia’s forward earnings multiple. Intel reports Q1 2026 results on April 23, with guidance near $12.2 billion revenue and roughly breakeven EPS.
Intel Foundry remains unproven at scale, and competition from AMD, Nvidia, and TSMC leaves limited tolerance for delays. The stock rose more than 50% in nine sessions, the fastest rally in its history, with RSI indicating overbought conditions.
With Intel’s earnings report just nine days away on April 23, the setup feels unusually binary. The stock has seen a historic rally, surging over 50% in a handful of sessions, which significantly raises the stakes for the upcoming numbers. This is no longer a slow-moving value play; it is a momentum story facing its first major test.
The options market is reflecting this tension, with implied volatility suggesting a potential stock move of over 10% in either direction following the announcement. This makes buying options outright expensive, but it also confirms that the market expects a significant reaction to the results and guidance. We believe the key is to position for this expected volatility, not just a single direction.
For those leaning bullish, buying out-of-the-money call options or using call spreads for the May expiration cycle could offer a way to play for a strong beat-and-raise quarter. The bull case hinges on management confirming strong server CPU demand and providing concrete revenue milestones for the foundry business. A positive surprise here could force investors who missed the rally to chase the stock higher.
Conversely, the risk of a “sell the news” event is very real, especially given the stock’s run-up to a forward P/E multiple near 63x. We saw a similar dynamic in Q3 of 2025, where a strong pre-earnings rally was met with a 10% pullback on solid, but not spectacular, results. Traders anticipating a repeat could consider buying put options or using put spreads to protect against a potential de-rating if guidance disappoints.
Given the high cost of options, a volatility-focused strategy like a long straddle or strangle could be a more neutral way to position for a large price swing. This approach benefits from a sharp move in either direction and essentially makes a bet that the 10% move priced in by the market is an underestimation of the actual outcome. This aligns with the idea that the April 23 report is a true binary event for the turnaround narrative.
For traders already holding a profitable long stock position from the recent rally, now is a critical time to consider hedging. Buying protective puts can lock in recent gains and provide downside protection through the earnings announcement. This allows participation in further upside while setting a clear floor on the position if the report fails to validate the stock’s recent move.
Beyond the immediate earnings catalyst, we will be watching for news flow related to foundry customers and competitor execution. Recent industry reports indicate that TSMC is making faster-than-expected progress on its next-generation node, reinforcing that any execution slip-ups from Intel will be punished. The competitive landscape leaves absolutely no room for error in the coming weeks.
Written on April 14, 2026 at 9:56 am, by josephine
A New York Times report said Iranian officials proposed pausing uranium enrichment for up to five years during weekend talks with the United States in Pakistan. The report said the US team led by Vice President JD Vance rejected the offer and pressed for a 20-year suspension.
In a separate Fox News interview earlier the same day, Vance did not refer to the reported five-year proposal. He said Iran ending its nuclear ambitions and the reopening of the Strait of Hormuz were non-negotiable terms.
Oil Upside Exposure
The breakdown in talks suggests continued tension, and we see the risk premium in crude oil remaining elevated. With Brent crude already up 7% this month to over $98 a barrel, we should consider buying call options on oil futures to profit from any further price spikes. This strategy positions us for the upside risk that escalates from the current diplomatic stalemate.
Market-wide volatility is our next focus, as geopolitical uncertainty often rattles investor confidence. The VIX is currently hovering near 26, reflecting heightened anxiety compared to the calmer periods we saw in 2025. We believe purchasing VIX call options or options on volatility ETPs provides a direct hedge against a potential equity market downturn caused by these unresolved negotiations.
The specific mention of the Strait of Hormuz, through which nearly 21 million barrels of oil per day passed before its closure late last year, presents a clear binary trade. A surprise resolution would see shipping and tanker stocks soar, making long-dated call options on these companies an attractive, albeit speculative, bet. Conversely, the continued impasse suggests global freight costs will remain high, adding to inflationary pressures.
We see this sustained energy-driven inflation as a headwind for the broader stock market. Higher fuel costs can squeeze corporate profit margins and curb consumer spending, which is a risk for the S&P 500. Therefore, buying put options on indices like the SPY can serve as an effective portfolio shield over the next several weeks.
This situation echoes the build-up of tensions we witnessed in 2025, which ultimately benefited the defense sector. With a 20-year demand from the US and only a five-year offer from Iran, the gap is wide and suggests a prolonged standoff. This environment supports a bullish view on defense contractors, and we should look at call options on defense-focused ETFs.
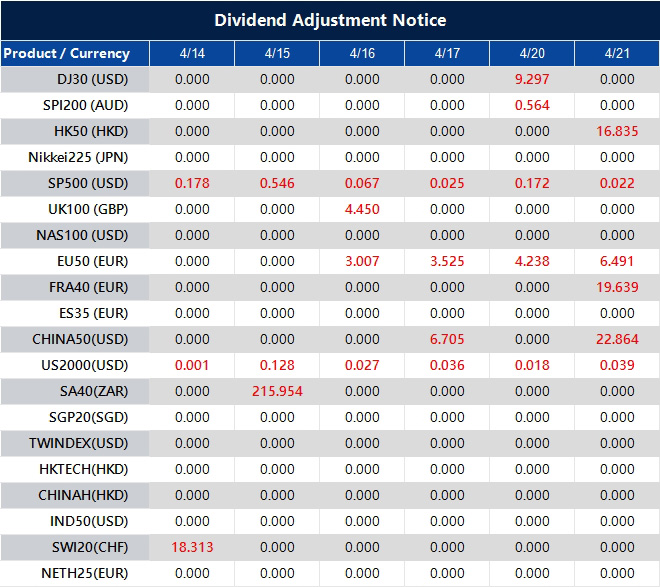
Please note that the dividends of the following products will be adjusted accordingly. Index dividends will be executed separately through a balance statement directly to your trading account, and the comment will be in the following format “Div & Product Name & Net Volume”.
Please refer to the table below for more details:
The above data is for reference only, please refer to the MT4/MT5 software for specific data.
If you’d like more information, please don’t hesitate to contact [email protected].
SPY rose from the April 7, 2025 low in wave ((1)) and reached $697.87 on January 28, 2026. It then fell in wave ((2)) to $629.23, correcting the whole move from April 2025, before turning up into wave ((3)).
A move above $697.87 is still needed to remove the risk of a double correction. The rise from $629.23 is mapped as an impulse Elliott Wave structure.
Wave Structure From The April Low
Wave ((i)) climbed to $658.52 and wave ((ii)) pulled back to $644.16. The next phase points to further gains to complete wave ((iii)).
After wave ((iii)), a wave ((iv)) pullback is expected to correct the cycle from the April 2 low, before a final rise completes the sequence. The near-term upward case remains in place while $629.23 holds.
With the market showing strength above the $629.23 pivot, we see an opportunity for income-generating strategies. Selling out-of-the-money puts, particularly with expirations in the coming weeks, allows traders to capitalize on time decay while expressing a bullish-to-neutral stance. This approach aligns with the view that any near-term weakness should find buyers, as long as that critical low from earlier this month holds.
This technical setup is supported by the recent March 2026 CPI report, which came in at a manageable 2.8%, suggesting inflationary pressures are contained for now. Furthermore, with the VIX falling to a multi-month low of 14.5, the cost of options has decreased, making bullish positions more affordable. A steady unemployment rate of 3.6% also provides a stable economic backdrop for further market gains.
Options Strategy Levels And Targets
For those targeting a move toward new all-time highs, buying call options or establishing bull call spreads offers a direct way to participate in the expected wave ((3)) advance. We are watching the previous high of $697.87 as a key level to overcome, with strikes around $700 and $710 becoming attractive targets for May and June expirations. A decisive break above that peak is needed to confirm the trend and remove the lingering risk of a more complex correction.
Looking back at the market action following the lows in late 2023, we observed a similar pattern of a sharp recovery followed by brief consolidation before the next major leg higher. That period also saw traders successfully selling puts on dips, reinforcing the idea that in a confirmed uptrend, pullbacks present opportunities. We believe the current structure presents a comparable setup for derivative traders to follow.
Gold prices in Saudi Arabia rose on Tuesday, based on FXStreet-compiled data. Gold was priced at SAR 575.95 per gram, up from SAR 572.25 on Monday.
Gold increased to SAR 6,717.77 per tola from SAR 6,674.58 a day earlier. Other listed prices were SAR 5,759.50 for 10 grams and SAR 17,914.00 per troy ounce.
Saudi Gold Price Snapshot
FXStreet converts international gold prices into Saudi riyals using the USD/SAR rate and local units. Prices are updated daily at the time of publication and are for reference, as local rates may vary.
Central banks are the largest holders of gold. They added 1,136 tonnes worth about $70 billion to reserves in 2022, the highest annual purchase on record.
Gold often moves inversely to the US Dollar and US Treasuries, and can also be inversely linked with risk assets. Its price can shift with geopolitics, recession fears, interest rates, and the US Dollar, as gold is priced in dollars (XAU/USD).
Gold’s recent rise continues the strong trend we have been watching. With prices pushing near $4,770 per ounce, it builds on the momentum that we saw beginning in the bull run of 2024 and 2025. This sustained strength suggests the factors driving investors toward safe-haven assets have not diminished.
Market Drivers And Strategy
We are seeing this rally despite the Federal Reserve holding interest rates firm, a factor that would normally pressure gold. However, with the latest March 2026 inflation figures from the Bureau of Labor Statistics coming in stubbornly high at 3.9%, traders are betting that the Fed cannot hike further without risking a recession. This creates a favorable environment for a non-yielding asset like gold.
A key pillar of support remains the aggressive purchasing from central banks, a trend that has accelerated since the record buying we observed back in 2022. The World Gold Council’s preliminary data for the first quarter of 2026 shows another 290 tonnes were added to official reserves, with the People’s Bank of China accounting for a significant portion. This consistent institutional demand creates a strong floor under the market, absorbing any price dips.
For those of us in the derivatives market, this points towards using options to manage the high price and expected volatility in the coming weeks. Buying call options or call spreads could allow for participation in further upside while clearly defining risk, a prudent strategy given that the market is at historic highs. We should also watch the inverse relationship with the S&P 500, which has shown weakness recently, falling 4% over the last month and potentially signaling more safe-haven flows into precious metals.
The index rose 1.02% on Monday, recovering losses linked to the Middle East conflict and returning to levels seen before the war-related sell-off.
Oil prices remained volatile, with Brent crude at $97.90 and WTI at $96.75, as the market reacted to tensions around the Strait of Hormuz.
While energy stocks benefited from higher oil prices earlier, tech stocks have recently taken the lead as market momentum shifted back toward growth sectors.
Earnings season is now a key focus, with major banks such as JPMorgan Chase, Wells Fargo, and Citigroup set to report.
The S&P 500 has shown notable resilience in recent sessions, with futures holding steady even amid ongoing geopolitical tensions and the breakdown of peace talks between the US and Iran.
On Monday, the index climbed 1.02%, reversing losses tied to the rising Middle East conflict and wiping out declines seen since the war began.
Major indexes closed the day higher following President Trump's announcement that Iran is looking to make a deal “very badly” with the US. 📈 pic.twitter.com/BRkQBrqYWC
Even though peace talks between the US and Iran collapsed over the weekend, the index regained its ground, showing that investors still have confidence in the market.
Despite the ongoing conflict, investors are confident in the long-term economic outlook, focusing on factors like company profits and growth rather than short-term political issues. This recovery highlights the market’s ability to adapt and stay focused on what drives economic strength.
Oil Prices Rise Amid Middle East Tensions
While the S&P 500 has remained steady, the oil market has been much more volatile. Brent crude futures fell 1.47% to $97.90 per barrel, while U.S. West Texas Intermediate (WTI) declined 2.35% to $96.75.
These price decreases are driven by rising tensions in the Middle East, especially in the Strait of Hormuz, where the US has started a blockade, tightening oil supply and pushing prices lower.
As tensions in the Middle East continue to affect the oil market, experts are weighing in on the situation. Rusty Hutson Jr., founder of Diversified Energy, provides his insight into the current dynamics driving oil prices that are not fully reflected in the market, suggesting that prices should be trading above $100 per barrel.
🛢️ "The market is screaming for more American barrels," Diversified Energy founder Rusty Hutson Jr. says, adding: "I personally believe that the oil price is not pricing in the true dynamic that's going on right now, and it should be trading over $100 right now easily." pic.twitter.com/EbxUXPYdXj
Although higher oil prices present challenges for energy consumers, they have boosted energy stocks, which are seeing gains. Despite these fluctuations, the broader market remains focused on economic recovery, maintaining its emphasis on stability and progress.
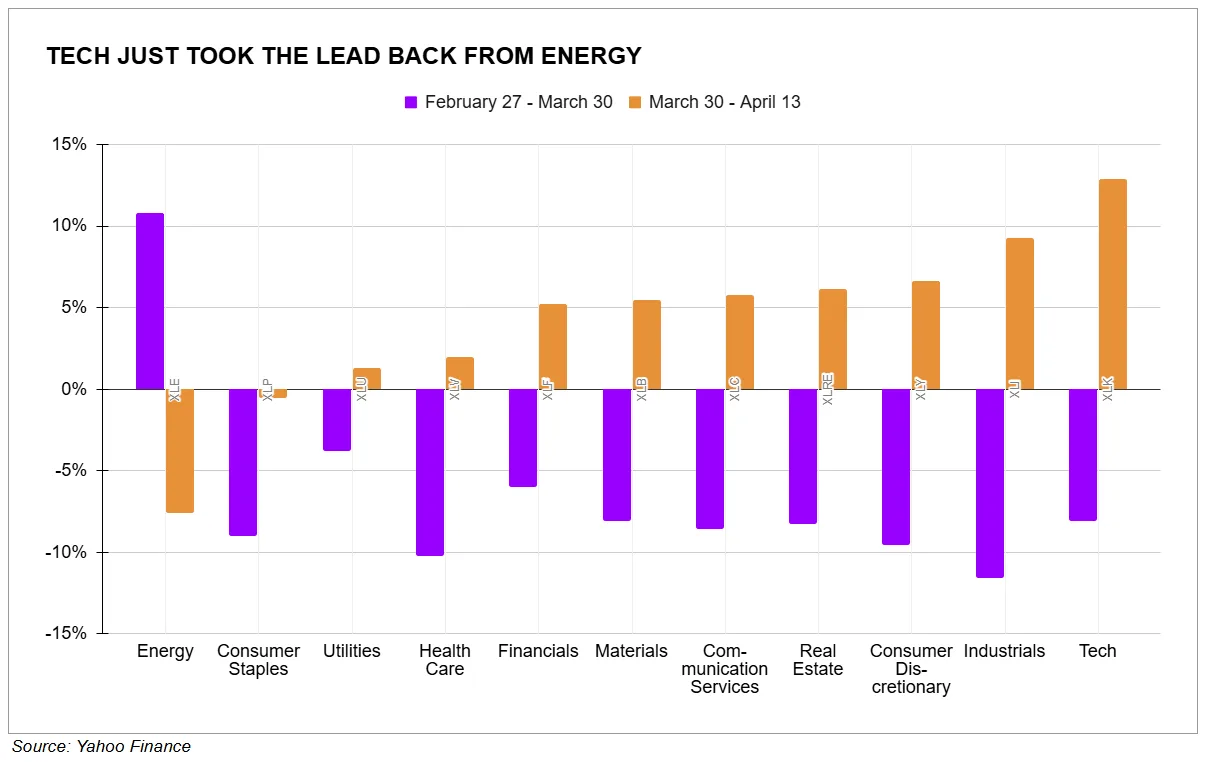
Tech Outperforms as Energy Stalls
Energy stocks have been strong performers, driven by rising oil prices that boosted expectations for higher profits in energy companies. However, as oil prices stabilise, the tech sector has regained momentum and is now outperforming energy stocks.
The graph below clearly shows the shift in sector performance, with tech stocks surging since March 30, while energy stocks have started to decline. This reversal highlights how tech, which had lagged behind, is now leading the market.
The recent rally in the Nasdaq Composite reflects this shift, with tech making strong gains as investors move back into growth stocks.
Although energy continues to benefit from rising commodity prices, it’s clear that the tech sector has reclaimed the lead, showing a strong recovery despite earlier concerns. This change suggests a return to a more traditional market dynamic, where tech sectors tend to lead during periods of economic recovery.
Earnings Season to Offer New Insights
As earnings season unfolds, the market will carefully scrutinise the results from key financial institutions.
Banks such as JPMorgan Chase, Wells Fargo, and Citigroup are set to report their quarterly earnings this week, offering critical insights into the financial health of the economy and how well the corporate sector is navigating rising geopolitical risks.
The performance of the banking sector is particularly significant this quarter, as investors will be seeking indicators of stability amid global uncertainties.
Goldman Sachs recently reported impressive earnings, with $17.55 per share and $17.23 billion in revenues, surpassing expectations despite challenges.
However, the results were somewhat mixed, as a notable decline in fixed-income trading revenue was counterbalanced by strong gains in investment banking.
With this backdrop, attention now shifts to how other major banks will fare. Solid earnings from these institutions could reinforce the belief that the economy is effectively managing geopolitical challenges, further bolstering the positive sentiment propelling the S&P 500.
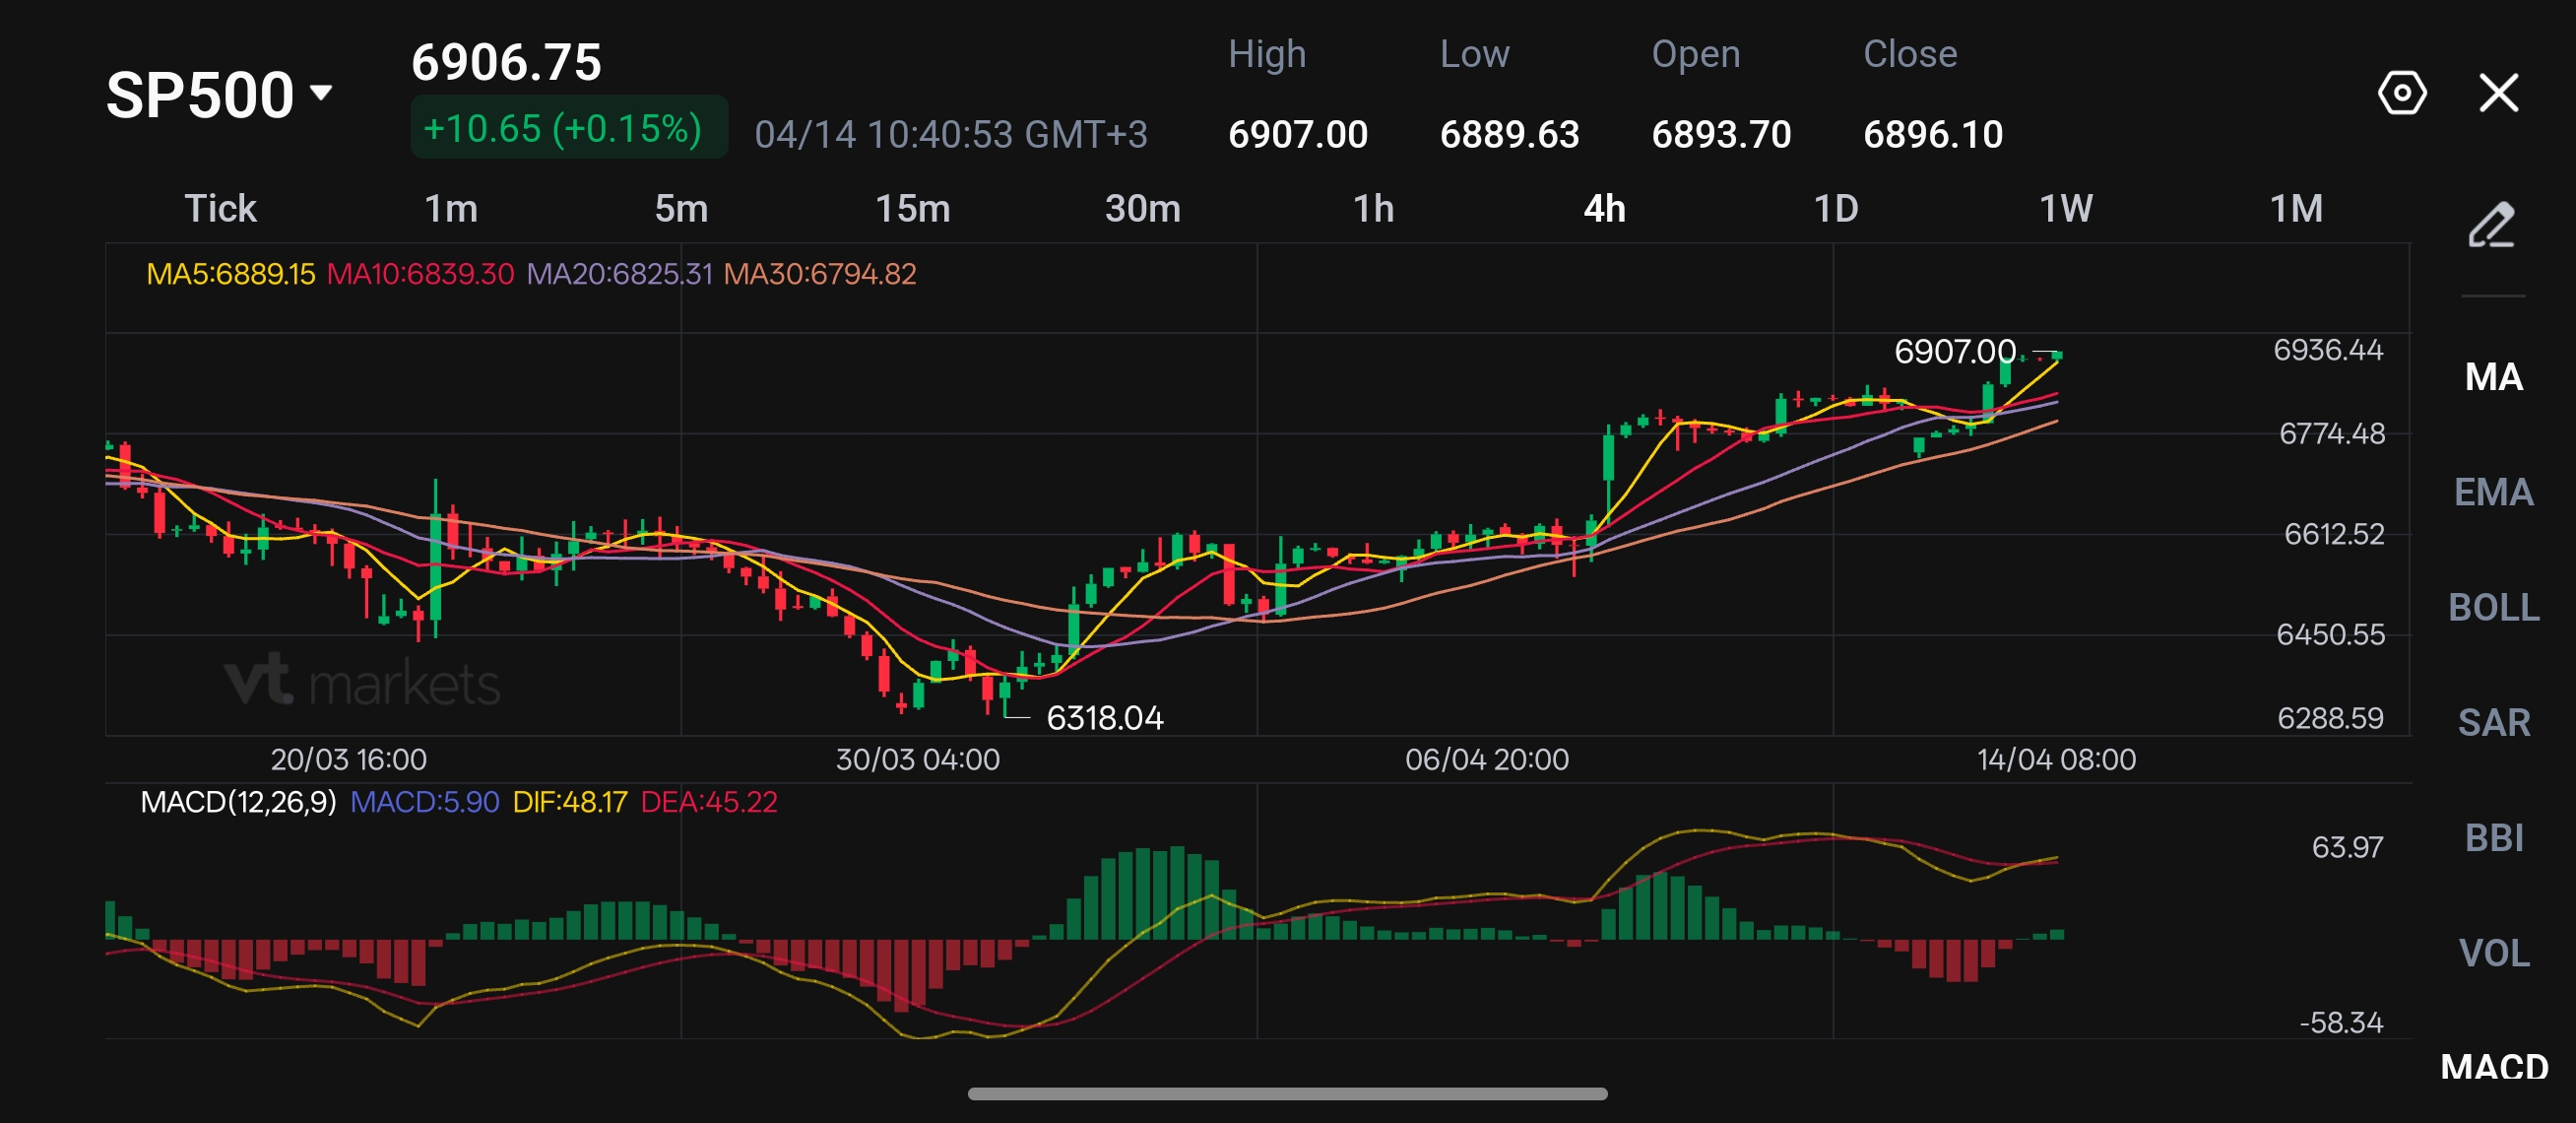
Technical Analysis
The index established a local bottom near 6318.04 on March 30. Since then, it has maintained a consistent upward trajectory, characterised by higher highs and higher lows. The current price of 6906.75 is hovering just below the recent peak of 6907.00, suggesting the market is testing immediate resistance.
The MACD indicator shows a bullish crossover that occurred around April 6. While the MACD histogram is currently positive (green bars), the momentum appears to be flattening slightly as the bars get smaller. A tightening of these lines could signal a brief consolidation or a minor pullback before the next leg up.
Key Levels To Watch:
Support: 6889
Resistance: 7000
What Traders Should Watch Next
The next move for the S&P 500 depends on how the market reacts to the upcoming earnings reports from major banks and whether geopolitical tensions, particularly in the US-Iran conflict, escalate or stabilise.
Traders will also be keeping an eye on oil prices, as any significant changes could influence both energy stocks and broader market sentiment. If tech continues its upward momentum and energy stocks stabilise, the S&P 500 may maintain its gains.
However, if energy prices spike again or geopolitical risks heighten, the index could face challenges holding its current levels.
1. Why did the S&P 500 recover even after US-Iran peace talks collapsed? The S&P 500 recovered because the market believed the conflict might not escalate further. Hopes for renewed US-Iran talks helped reduce panic, while traders shifted their focus back to company earnings, economic strength, and the broader market outlook.
2. How are Middle East tensions affecting the S&P 500? Middle East tensions are affecting the S&P 500 mainly through oil prices and market sentiment. Rising conflict risk has made the oil market more volatile, but the index has remained relatively steady as traders continue to focus on earnings season and economic resilience.
3. Why are oil prices important for the stock market right now? Oil prices matter because they influence inflation, energy company earnings, and overall market confidence. When crude prices rise sharply, they can support energy stocks but also raise concerns about higher costs across the economy, which can affect the broader stock market.
4. Why is tech outperforming energy now? Tech is outperforming energy because market momentum has shifted back toward growth stocks. Energy stocks benefited earlier from rising oil prices, but as that move cooled, traders returned to technology shares, helping the Nasdaq and other growth sectors lead the latest rally.
5. What should traders watch during earnings season? During earnings season, traders should watch results from major banks and large US companies. These reports can show how strong business activity remains, how companies are handling uncertainty, and whether the current S&P 500 rally has enough support to continue
Start trading now – Click here to create your real VT Markets account
Gold prices in the Philippines rose on Tuesday, based on data compiled by FXStreet. Gold was priced at PHP 9,178.61 per gram, up from PHP 9,119.29 on Monday.
Gold increased to PHP 107,057.70 per tola from PHP 106,365.60 a day earlier. Other listed prices were PHP 91,786.59 for 10 grams and PHP 285,486.90 per troy ounce.
How FXStreet Calculates Philippine Gold Prices
FXStreet derives Philippine gold prices by converting international rates using the USD/PHP exchange rate and local measurement units. The figures are updated daily using market rates at the time of publication, and are provided as reference as local prices may vary.
Central banks are the largest holders of gold. They added 1,136 tonnes worth about $70 billion to reserves in 2022, according to the World Gold Council, the highest annual purchase on record.
Gold prices can move with geopolitical risks, recession fears, interest rates, and changes in the US Dollar, as gold is priced in dollars (XAU/USD). Gold also tends to move inversely to the US Dollar, US Treasuries, and risk assets such as equities.
The slight rise in local gold prices reflects a much larger global story for the weeks ahead. We see the US Dollar Index has softened by nearly 3% in the first quarter of 2026, which typically provides a tailwind for gold. This inverse correlation is a fundamental principle traders should be watching.
Implications For Traders
With the Federal Reserve signaling a potential pause on rate hikes, the opportunity cost of holding a non-yielding asset like gold is decreasing. Last month’s CPI data showed inflation remains persistent at over 3%, reinforcing gold’s appeal as a hedge against eroding purchasing power. We saw how gold performed well during the similar inflationary pressures experienced back in 2024.
Geopolitical tensions are also providing a floor for prices, increasing its status as a safe-haven asset during turbulent times. The World Gold Council’s data confirmed that central banks continued their aggressive buying through the end of 2025, adding over 800 tonnes to global reserves. This shows strong underlying demand from the biggest players in the market.
For derivative traders, this environment suggests that buying call options or call spreads could be a strategy to capitalize on potential upside. The Cboe Gold ETF Volatility Index (GVZ) is up 15% since January, indicating that options are pricing in larger price swings in the weeks ahead. This makes strategies that profit from volatility worth considering if a major price move is expected.
Asian stock markets rose on Tuesday after remarks from US President Donald Trump and Vice President JD Vance suggested talks with Iran were not a complete failure, lifting demand for risk-sensitive assets.
Nikkei 225 was up over 2.5% to near 58,000, Shanghai rose 0.55% to slightly above 4,000, and Hang Seng gained 0.5% to near 25,785. Indian stock markets were closed due to Dr. Baba Saheb Ambedkar Jayanti.
Iran Talks And Market Reaction
On Monday, Trump said Iran wants a deal “very badly” and said the US Navy has blockaded Iranian ports. Vance said his team gained “valuable insight into Iran’s negotiating approach” during a first round of talks in Pakistan over the weekend.
Vance said Iran ending its nuclear ambitions and the reopening of the Strait of Hormuz are not negotiable terms. CNN reported that Washington officials are discussing a possible second in-person meeting with Iranian officials before the two-week ceasefire ends on April 21, but said it is unclear if it will happen.
Attention is also on a meeting in Washington, DC between Lebanese Ambassador Nada Hamadeh and Israeli Ambassador Yechiel Leiter at 15:00 GMT.
Looking back to this time last year, we saw a significant risk-on rally when it seemed a US-Iran deal was possible. That optimism proved short-lived, as the ceasefire expired and talks ultimately stalled by mid-2025. Today, with renewed naval exercises in the Gulf, the market is pricing in a higher probability of conflict than it did during that brief hopeful period.
Trading And Hedging Considerations
The blockade of Iranian ports in April 2025 caused Brent crude to spike over $110 a barrel, creating huge profits on long call options. We are seeing a similar setup now, as current reports from early April 2026 show Iranian-backed disruptions in the Red Sea have already pushed the CBOE Crude Oil Volatility Index (OVX) up 15% in two weeks. Traders should consider buying out-of-the-money calls on crude futures, as any escalation could cause a repeat of last year’s sharp price increase.
We recall the Nikkei 225 jumping 2.5% on the 2025 negotiation news, but those gains were erased within a month as tensions returned. This pattern suggests that traders should view any positive geopolitical headlines with skepticism and consider buying protection. For instance, VIX futures for the coming months are still relatively cheap, trading below 18, which is low considering the historical volatility during the 2019 Strait of Hormuz incidents.
The US dollar typically strengthens during Middle East crises, a trend we saw in the second quarter of 2025. As tensions simmer again, going long the dollar against riskier currencies or commodity-linked currencies is a prudent strategy. Options on currency ETFs like UUP can provide leveraged exposure to a strengthening dollar as a safe-haven asset.
While the major focus is on Iran, we must also watch for flare-ups in related conflicts, such as the Israel-Lebanon dynamic mentioned last year. These secondary events can trigger sudden, localized volatility spikes that are perfect for trading short-dated, weekly options. These situations often provide clear entry and exit points for nimble traders before the broader market fully reacts.