Gold prices rose in Malaysia on Tuesday, based on FXStreet data. Gold was priced at MYR 607.46 per gram, up from MYR 603.22 on Monday.
Gold increased to MYR 7,085.28 per tola from MYR 7,035.79 a day earlier. Other listed prices were MYR 6,074.59 for 10 grams and MYR 18,894.09 per troy ounce.
Malaysia Gold Pricing Method
FXStreet calculates Malaysia’s gold prices by converting international prices using the USD/MYR rate and local units. The figures are updated daily at the time of publication and are for reference, with local rates able to differ slightly.
Central banks are the largest holders of gold and use it as part of their reserves. World Gold Council data says central banks added 1,136 tonnes of gold worth around $70 billion in 2022, the highest annual purchase since records began.
Gold is described as inversely correlated with the US Dollar and US Treasuries, and also inversely correlated with risk assets. Gold prices can also be affected by geopolitical events, recession fears, interest rates, and the strength of the US Dollar, as gold is priced in dollars (XAU/USD).
The recent rise in gold prices, reflected in currencies like the Malaysian Ringgit, points to a broader bullish trend we are seeing globally. This momentum is supported by gold futures climbing over 8% in the first quarter of 2026, breaking past key psychological resistance levels. We believe derivative traders should view any small dips as potential buying opportunities in the near term.
Market Drivers And Trading Outlook
A key factor is the shifting stance of the US Federal Reserve. After holding interest rates at 3.5% through late 2025, recent cooling in US inflation data to 2.7% has the market anticipating at least one rate cut by the third quarter. Historically, the prospect of lower rates weakens the US dollar, which has an inverse correlation with gold.
We are also seeing continued, aggressive purchasing from central banks, a trend that has solidified since it accelerated back in 2022. The People’s Bank of China has reportedly added another 40 tonnes to its reserves in the first quarter of 2026 alone, providing a strong floor for the market. This consistent institutional demand limits the potential downside for traders holding long positions.
Looking back at the sharp volatility we experienced during 2024, it is clear that geopolitical flare-ups can cause rapid price spikes. Current tensions in the South China Sea are creating a similar environment, driving safe-haven demand that supports bullish derivative plays. We see traders increasingly using options to capitalize on this expected volatility.
Given this backdrop, strategies like buying call options or bull call spreads could be effective to capture further upside while defining risk. The implied volatility in gold options has been rising, suggesting the market anticipates significant price moves in the coming weeks. Traders should monitor the dollar index closely, as a break below its current support level could trigger the next leg up for gold.
Sterling extended gains to about 1.3515 against the US Dollar in Asian trading on Tuesday, with market mood favouring riskier assets. S&P 500 futures were flat after rising over 1% on Monday, while the US Dollar Index hit a six-week low near 98.30.
GBP/USD dipped to around 1.3380 early Monday, then recovered to close near 1.3510, up 0.35% on the day. It traded above 1.3500 for the first time since the sell-off after the Iran conflict began and reached its highest level since late February.
Risk Appetite And Dollar Softness
The pair has risen by over 350 pips from an early April low near 1.3160, reversing about half of the drop from the year-to-date high near 1.3870. Moves followed changes in risk appetite and a broad softening in the US Dollar.
A US announcement on a blockade of the Strait of Hormuz after weekend talks in Pakistan failed weighed on Sterling early in the week. The blockade began at 10:00 AM EDT on Monday and aimed to stop Iranian-flagged vessels and other ships leaving Iranian ports.
Reports also said Iran may be considering abandoning uranium enrichment and halting its nuclear programme. On Monday, GBP/USD was quoted at 1.3457.
We can see how a risk-on mood, driven by hopes of a US-Iran ceasefire, boosted the Pound to over 1.3500 around this time in 2025. This shows how quickly sentiment can shift and weaken the US Dollar, a pattern traders should watch for. That volatility based on geopolitical headlines is a key lesson from last year’s market.
Policy Divergence And Trading Implications
However, the landscape today on April 14, 2026, is shaped more by economic policy than by the specific geopolitical events of last year. Persistent US inflation, which has hovered stubbornly above 3%, is forcing the Federal Reserve to signal fewer interest rate cuts than previously expected. This contrasts with the Bank of England, which is now anticipated to cut rates sooner to stimulate a sluggish UK economy, creating a headwind for the Pound.
This policy divergence suggests derivative traders might consider strategies that hedge against further Pound weakness relative to the Dollar. Buying GBP/USD put options could be a straightforward way to position for a stronger Dollar if the Fed remains hawkish. Current one-month implied volatility is hovering around 6.8%, which is not at extreme levels and makes purchasing options a relatively affordable form of protection against a downturn.
Recalling how quickly the market shifted on headlines in 2025, positioning for a surprise is also a valid approach. A long straddle, which involves buying both a call and a put option, would profit from a significant price move in either direction. Such a strategy could pay off if upcoming inflation data or central bank statements from either the US or UK deviate sharply from current expectations.
USD/CHF fell for a seventh day and traded near 0.7830 in Asian hours on Tuesday. The move followed reports that the US and Iran may hold further talks before a two-week truce ends.
Donald Trump said Iran had made contact and wanted to resume negotiations. JD Vance referred to ongoing diplomatic efforts and said weekend talks were constructive for understanding Iran’s stance.
Swiss Franc Support And SNB Watch
The Swiss franc found support as oil prices eased, which raised attention on possible Swiss National Bank policy adjustments. Switzerland’s annual consumer inflation rose to 0.3% in March from 0.1% in February, the highest in a year, while the SNB repeated it could intervene to limit excessive CHF strength.
The US dollar also faced pressure as the drop in oil prices reduced hawkish pricing around the Federal Reserve outlook. Fed Governor Stephen Miran said the energy shock linked to Iran had not altered long-term inflation expectations and that inflation could return to target within a year.
US Treasury Secretary Scott Bessent told Semafor the US should “wait and see” before cutting rates. He said he expects recent price rises will not become embedded in inflation expectations.
Given the continued slide in USD/CHF, we should consider strategies that benefit from further Swiss Franc strength in the near term. Buying put options on the USD/CHF pair offers a way to profit from this downward momentum while limiting potential losses to the premium paid. This is particularly relevant as the market is pricing in a higher probability of a US-Iran deal, which reduces demand for the safe-haven US Dollar.
Risk Management And Cross Market Positioning
However, we must be cautious of the Swiss National Bank, as the pair approaches levels that have historically triggered intervention. We saw the SNB aggressively defend the Franc back in the 2015-2022 period, and their recent statements confirm they are ready to act again. A long volatility strategy, such as a straddle, could be prudent to capture a sharp move in either direction should the SNB surprise the market or the Iran talks suddenly collapse.
On the US side, the market seems to be ignoring underlying inflation risks. We remember that US Core CPI remained stubbornly above 3.5% for much of 2025, so the current relief from falling oil prices might be temporary. If upcoming US economic data shows persistent price pressures, the Federal Reserve could quickly turn hawkish again, causing a sharp reversal in the Dollar’s fortunes.
This situation is deeply connected to the energy markets, where easing tensions are pushing crude oil prices down. The prospect of a deal reduces the risk premium associated with potential supply disruptions in the Strait of Hormuz, where nearly 20% of the world’s oil transits daily. Consequently, bearish positions on crude oil futures could serve as a complementary trade to a short USD/CHF stance.
USD/JPY drops toward 159.00 as easing tensions over Iran and a dovish Fed outlook reduce USD’s safe-haven appeal.
Rising energy risks from the Strait of Hormuz limit JPY’s potential upside despite USD softness.
Mixed fundamentals keep USD/JPY range-bound, with geopolitical and inflation data influencing future price movement.
USD/JPY extends Monday’s pullback from the 159.85 area, drifting lower in Tuesday’s Asian session and slipping toward the 159.00 mark. However, losses appear contained amid mixed fundamentals.
Despite stalled US-Iran talks over the weekend, markets remain hopeful that diplomacy is still on the table. US Vice President JD Vance noted that meaningful progress has been made, even without a breakthrough. This optimism weighs on the US Dollar’s safe-haven appeal, adding pressure to USD/JPY.
USD pressured as Fed outlook stays mixed
Adding to this, uncertainty surrounding US inflation trends and the Federal Reserve’s policy path has weighed on the US Dollar, pushing it to its weakest level since early March.
Friday’s data showed inflation accelerating at its fastest pace in nearly four years, reinforcing concerns that price pressures remain sticky and may force the Fed to maintain a restrictive stance for longer than previously expected.
This has led markets to reassess the likelihood of additional rate hikes later this year. However, sentiment remains divided, as some traders continue to price in potential rate cuts, supported by signs of easing geopolitical tensions that could reduce inflationary risks over time.
US inflation increased in February and likely rose further in March amid the war with Iran, a trend that is expected to keep the Fed from cutting interest rates for a while. GDP increased at a downwardly revised 0.5% annualized rate https://t.co/Ybtgzo1L3ypic.twitter.com/9PvS29Bqd3
The Japanese Yen may find it difficult to attract sustained buying interest amid rising energy-related economic concerns linked to escalating instability in the Strait of Hormuz.
US President Donald Trump confirmed that a naval blockade of the strategic waterway is underway, escalating geopolitical tensions and warning of potential action against Iranian vessels operating in the region.
In response, Iran issued broad threats targeting shipping routes and ports across the Persian Gulf and the Gulf of Oman, further heightening fears of disruptions to global energy flows.
Given Japan’s heavy reliance on crude oil imports from the Middle East, any prolonged disruption or spike in energy prices could significantly strain the country’s trade balance and economic outlook. This reduces appetite for aggressive bullish positioning on the JPY, as higher import costs and growth concerns tend to undermine currency strength.
As a result, this dynamic may help cushion downside pressure in USD/JPY despite broader dollar softness. That said, growing speculation that Japanese authorities could step in to curb excessive Yen weakness may act as a limiting factor on any sustained upside in the pair, keeping overall price action relatively range-bound.
Oil prices surged as the US moved to impose a blockade on Iranian shipping after the collapse of weekend peace talks, while the dollar rose and stocks and bonds fell https://t.co/vxWjgsx8Xdpic.twitter.com/cwSJap0BrF
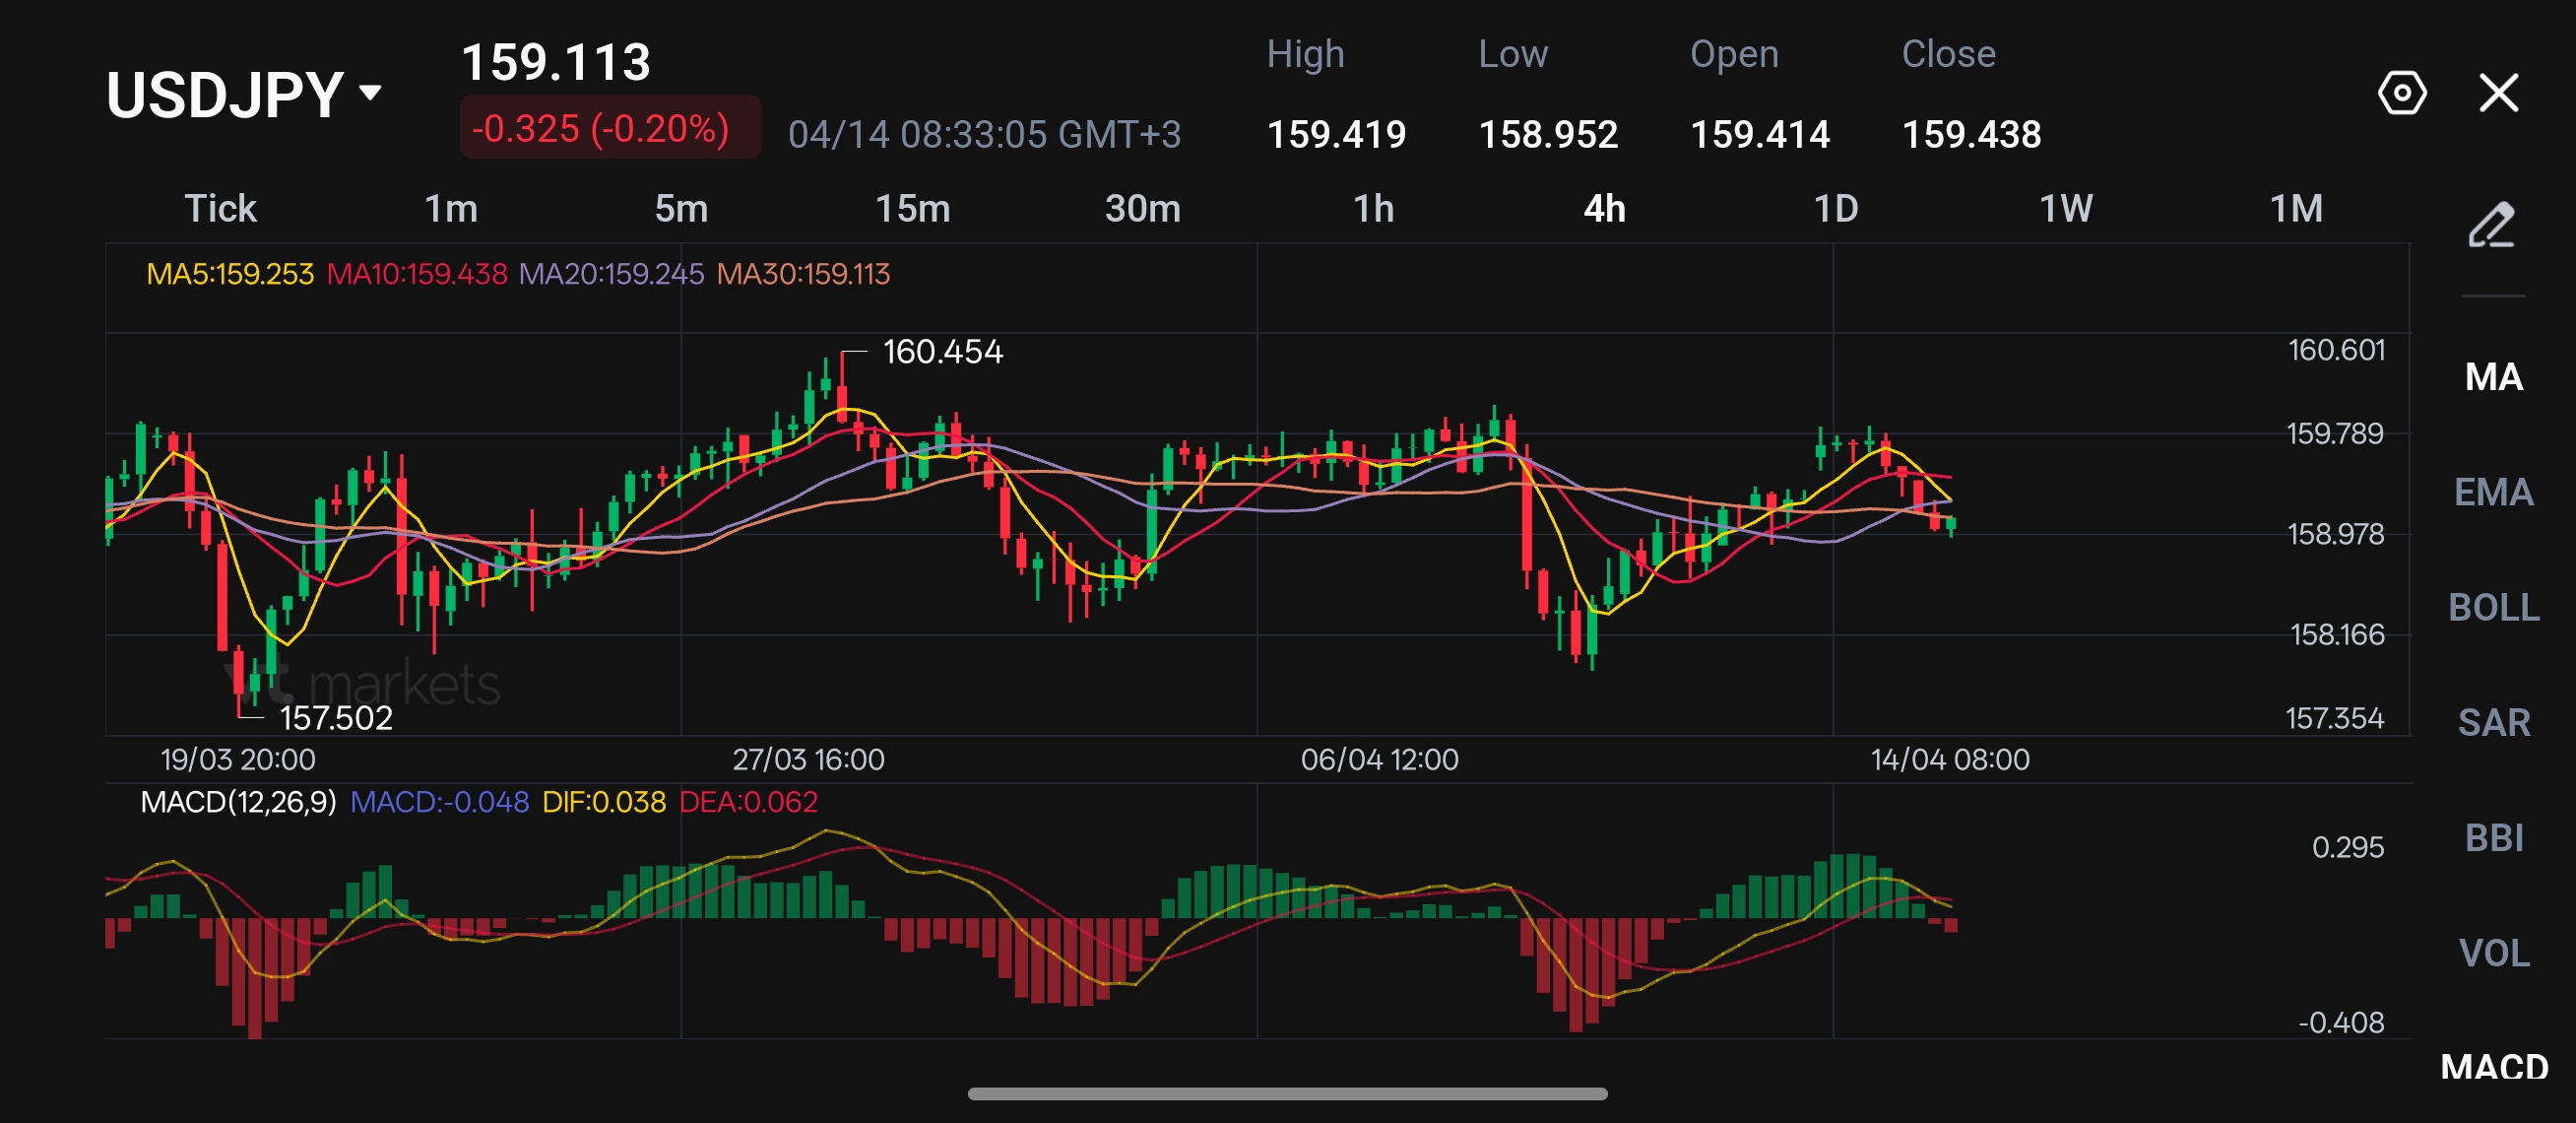
USDJPY currently trades near 160.000 key resistance levels and as seen in the chart below, USDJPY ranges between 157.000 to 160.000. It is still unclear currently to decide if USDJPY is going to create a leg up or a huge retracement coming with Japanese government intervention.
The moving averages currently are quite flat, showing neither bullish or bearish momentum is strong at the moment. To see a clear trend, we want to see the moving averages aligned with obvious gap in between to be confident that price will move towards that direction.
MACD’s histogram is starting to turn bearish and the signal line is very close to crossing into the negative region indicating sellers are starting to step into the market and want to push prices lower. However, in the lower region, there is still quite an amount of strong support levels.
Key Levels To Watch:
Support: 158.336
Resistance: 159.805
What to Watch
Going forward, USD/JPY is likely to remain sensitive to incoming US data and shifts in geopolitical headlines. Traders should closely monitor upcoming inflation releases and any signals from the Federal Reserve, as a clearer policy direction could drive the next leg for the US Dollar.
At the same time, developments surrounding the Strait of Hormuz and energy prices will be key for Yen sentiment, particularly given Japan’s import dependency. Any signs of escalation could limit JPY strength, while easing tensions may allow the currency to recover.
In parallel, market participants will stay alert to potential intervention signals from Japanese authorities, especially if USD/JPY approaches recent highs again.
Market Takeaway
USD/JPY remains trapped in a tug-of-war between softening US Dollar sentiment and underlying weakness in the Japanese Yen. While fading safe-haven demand and a mixed Fed outlook are pressuring the pair lower, energy risks and Japan’s import exposure continue to limit JPY strength.
For now, this keeps price action broadly range-bound, with neither side holding a clear directional edge until a stronger macro catalyst emerges.
The USD/JPY pair is extending its pullback toward the 159.00 level due to a combination of cooling safe-haven demand for the US Dollar and mixed signals regarding Federal Reserve policy. While US-Iran diplomatic talks haven’t reached a breakthrough, recent optimistic comments from US Vice President JD Vance have eased immediate geopolitical fears, reducing the “safety bid” that previously propped up the Greenback.
2) How is US inflation impacting the US Dollar (USD)?
The US Dollar has hit its weakest level since early March. Recent data shows inflation accelerating at its fastest pace in nearly four years. This has created a mixed outlook:
The Hawkish View: Sticky inflation may force the Fed to keep interest rates higher for longer.
The Dovish View: Easing geopolitical tensions could eventually lower energy-driven inflation, leading some traders to still bet on potential rate cuts later this year.
3) What is the Strait of Hormuz factor for the Japanese Yen?
The Japanese Yen (JPY) is currently struggling due to Japan’s heavy reliance on Middle Eastern crude oil. With reports of a naval blockade in the Strait of Hormuz and threats from Iran against shipping routes, energy supply risks are surging. High energy prices typically hurt the Yen because they worsen Japan’s trade balance, making the currency less attractive to buyers despite the USD’s weakness.
4) Will the Bank of Japan (BoJ) or Japanese authorities intervene?
Speculation is mounting that Japanese authorities may step in to support the Yen if it weakens too aggressively. Fear of direct intervention (where the government buys JPY to move the market) is currently acting as a ceiling for USD/JPY, preventing the pair from rallying too far past the 159.85 resistance zone.
5) What are the key technical levels to watch for USD/JPY?
Resistance: The recent high near 159.85 remains the primary hurdle for bulls.
Support: Traders are closely watching the 159.00 psychological mark. A sustained break below this level could open the door for a deeper correction toward March lows.
6) How does the Trump administration’s stance affect the pair?
President Trump’s confirmation of naval activity in the Persian Gulf has escalated geopolitical tensions. While this usually strengthens the USD as a safe haven, the simultaneous diplomacy narrative from the administration is creating a tug-of-war in market sentiment, keeping the pair in a volatile, range-bound pattern.
7) Is USD/JPY a “Buy” or a “Sell” right now?
The market is currently characterized by mixed fundamentals. The pair is caught between a softening US Dollar and a Yen that is burdened by energy security risks. Most analysts view the current price action as range-bound, suggesting that traders are waiting for clearer signals from either the Federal Reserve or a resolution to the tensions in the Middle East.
Start trading now – Click here to create your real VT Markets account
China’s year-on-year imports rose by 27.8% in March. The increase was above expectations of 11.1%.
The data measures how imports changed compared with the same month a year earlier. No other figures were provided in the release.
Imports Surge Signals Risk On
The massive beat on China’s year-over-year import data is a clear risk-on signal for the coming weeks. A figure of 27.8% indicates that domestic demand is running significantly hotter than anyone anticipated. This suggests the economic recovery has much stronger momentum than models predicted, requiring an immediate reassessment of global growth-sensitive assets.
We should anticipate a sustained rally in industrial commodities. With iron ore imports reportedly hitting a new monthly record and copper inventories in Shanghai falling 8% last week, the physical demand is undeniable. Long call options on copper futures and major oil contracts like Brent are attractive ways to position for this surging demand from the world’s largest consumer.
This data is extremely bullish for commodity-linked currencies, especially the Australian Dollar. The AUD/USD pair has already broken above 0.7150, but we see it heading towards the 0.7400 level we last saw before the global manufacturing slowdown in 2025. Traders should consider buying AUD/USD call options or selling out-of-the-money puts to finance those positions.
Global mining and resource equities are a direct beneficiary of this trend. Stocks like BHP and Rio Tinto are already up over 5% this week, and we expect their earnings estimates to be revised sharply higher. Bull call spreads on the MSCI World Metals and Mining Index offer a broader way to capture this upside, which should outperform general indices.
Volatility is likely to compress further as strong growth data eases recessionary fears. The VIX has already dropped below 14, a low not seen since the third quarter of 2025, suggesting a return of market complacency. Selling VIX call spreads or even cautiously buying VIX puts could be a profitable strategy as this positive sentiment solidifies.
Yuan Outlook Strengthens
The strength in the Chinese economy should also support its currency, reversing the weakening trend we observed for much of 2025. The People’s Bank of China will have less incentive to devalue, and the USD/CNH pair could break below the key 6.80 support level in the coming weeks. We are looking at put options on the USD/CNH as a direct play on renewed Yuan strength.
China’s exports grew 7.1% year on year in March. This was below the expected 8.3%.
The data shows export growth slowed compared with forecasts. The release compares March exports with the same month last year.
Implications For Currencies
The miss in China’s March export growth signals a cooling in global demand for manufactured goods. We see this as a reason to anticipate weakness in currencies closely tied to China’s economic health, such as the Australian dollar. The AUD/USD has already slipped to a three-month low around 0.6550, and we could use options to position for a further decline towards the 0.64 mark in the weeks ahead.
This data directly impacts industrial commodities, as China is the world’s largest consumer. We are therefore considering bearish derivative strategies on copper, which has now dipped below $8,400 per tonne on the LME. Shorting copper futures or buying put options on major mining companies that rely on Chinese demand are potential plays.
Global equity indices with high exposure to China, particularly Germany’s DAX, are now vulnerable. We saw a similar reaction when disappointing Chinese data was released back in the third quarter of 2025, leading to a sharp drop in European automaker and luxury goods stocks. Buying put options on the DAX index provides broad exposure to this expected downturn.
Uncertainty stemming from this data miss is likely to increase market volatility. This makes buying call options on a volatility index like the VIX a prudent hedge against broader market turbulence. A flight to safety could also boost government bonds, suggesting long positions in bond futures may become profitable.
Policy Response And Risk Management
The weak export figure puts pressure on the People’s Bank of China to introduce economic stimulus. We will be watching for any announcements regarding liquidity injections or cuts to bank reserve requirements. Such a move could cause a sharp, temporary reversal, making it essential to use stop-losses on any bearish positions we establish.
China’s trade balance in March was $51.13bn in surplus. This was below the forecast of $112bn.
The result was $60.87bn under the forecast. The data are reported in US dollars.
Global Demand Weakens
This massive miss suggests global demand for Chinese goods is faltering much more than anticipated. Data just released shows exports fell 7.5% year-over-year, which is the core reason for the weak number. This is a clear signal of a slowdown that we must act on.
We see this as a direct negative for currencies tied to Chinese growth, particularly the Australian dollar. The AUD has already dropped to a six-month low of 0.6450 against the US dollar on this news. We should consider buying put options on the AUD/USD pair or shorting it outright, expecting further weakness in the coming weeks.
This report is also a strong bearish signal for industrial commodities. We should look to increase bets against base metals, as China is the world’s largest consumer. For instance, copper futures have already fallen 2.5% to $8,300 a tonne, and we expect this downward pressure to persist.
In equity markets, this data increases the risk of a correction in China-linked indices like the Hang Seng. The CBOE Hang Seng Volatility Index (VHSI) has jumped 15% today, showing that fear is rising. We should use options to position for more downside, as buying puts is now a prudent strategy to hedge portfolios.
This setup is very similar to what we observed during the growth scare in mid-2025. Back then, a similar slump in export data preceded a 12% drop in the Hang Seng over the following two months. We believe history could be a guide for what to expect through May and June of this year.
USD/CAD stayed weak for a second day and traded near 1.3790 in Asian trading on Tuesday. The move came as the US Dollar lost ground after reports that the US and Iran may hold more talks before a two-week truce ends.
US President Donald Trump said Iran had made contact and was seeking to resume negotiations. Vice President JD Vance said diplomatic efforts were continuing and referred to weekend talks as constructive.
Dollar Pressures From Fed And Geopolitics
The US Dollar also eased as markets reduced expectations of further Federal Reserve tightening. This followed lower inflation concerns linked to a possible longer-term ceasefire and a possible reopening of the Strait of Hormuz, which has weighed on oil prices.
Fed Governor Stephen Miran said the Iran-related energy shock has not yet changed long-term inflation expectations. He said he expects price pressures to return to the central bank’s target within a year.
Falls in USD/CAD may be limited because lower oil prices can weigh on the Canadian Dollar. Canada is the largest crude exporter to the United States, and oil slipped as supply worries eased on the talk reports.
In Canada, CBC News reported that Prime Minister Mark Carney won a parliamentary majority on Monday. His Liberals secured 172 seats in the 343-seat House of Commons.
Strategy Focus On Volatility
Given the conflicting pressures on both the US and Canadian dollars, we see the recent stability in USD/CAD around 1.3790 as a sign of market indecision. A directional bet right now is risky, so the focus in the coming weeks should be on volatility. The easing of US-Iran tensions is pulling the pair in two different directions at once.
The drop in oil prices is a significant headwind for the Canadian dollar, and we must not underestimate it. Looking back, we saw WTI crude futures fall from over $90 in late 2025 to around $82 today on the prospect of a more stable supply from the Middle East. Since Canada’s economy is sensitive to energy exports, this price drop puts a natural cap on any loonie strength.
On the other hand, the US dollar’s weakness may be temporary, as markets are pricing in a less aggressive Federal Reserve too quickly. The latest US Consumer Price Index data from March showed inflation is still stubborn at 3.5%, making it unlikely the Fed will rush to cut rates. The interest rate differential, with the Fed Funds Rate at 5.5% and the Bank of Canada’s rate at 5.0%, still favors holding US dollars.
This environment suggests that USD/CAD may remain range-bound, caught between those competing forces. Derivative traders should consider strategies that profit from this lack of direction, such as selling strangles or establishing iron condors. Implied volatility for currency pairs has compressed in recent days, reflecting the current uncertainty and making these premium-selling strategies attractive.
The new majority for Prime Minister Carney’s government in Canada does introduce an element of political stability, which could provide some underlying support for the CAD. This reinforces our view that the pair is unlikely to experience a major breakout in either direction without a new catalyst. We will be closely watching upcoming inflation reports from both countries to see if the interest rate narrative shifts.
USD/JPY extended a modest pullback from the 159.85 area and moved lower in Asia on Tuesday. It fell to near 159.00, with limited follow-through downside due to mixed drivers.
US-Iran peace talks failed over the weekend, yet markets still expect diplomacy to continue. US Vice President JD Vance said meaningful progress has been made, and this weighed on the US dollar.
Dollar Pressure From Policy Uncertainty
The US dollar also hit its lowest level since early March amid uncertainty over US inflation and Federal Reserve policy. US data released on Friday showed inflation rose by the most in nearly four years, shifting attention towards possible rate rises this year, while some rate-cut expectations remain.
The yen found limited support due to concerns over energy shocks linked to instability around the Strait of Hormuz. US President Donald Trump said a US Navy blockade has officially started and said Iranian warships approaching would be destroyed, while Iran threatened ports in the Persian Gulf and the Gulf of Oman.
Japan relies mainly on Middle East oil imports, raising concerns about economic strain in the near term. This may limit yen strength and restrict deeper USD/JPY declines, while talk of Japanese official action could also cap further yen weakness.
Looking back at the situation in 2025, we saw the dollar soften on hopes of US-Iran diplomacy, while the yen was weakened by energy security fears. This created a limited trading range for USD/JPY, as both currencies faced significant headwinds. The fundamental landscape, however, has shifted dramatically over the past twelve months.
Energy Shock And Market Aftereffects
The US naval blockade in the Strait of Hormuz last year caused a severe energy shock, with Brent crude prices briefly spiking above $145 per barrel. While diplomatic channels have since eased the immediate crisis, oil prices remain elevated, with WTI currently trading around $95, keeping pressure on energy importers like Japan. This sustained high cost of energy continues to act as a major weight on the yen.
In response to the inflation surge of 2025, which saw the Consumer Price Index peak at over 7%, the Federal Reserve was forced into a much more aggressive stance than traders anticipated. The Fed has since raised the federal funds rate to 6.00% to combat these persistent price pressures, which were last recorded at 4.1% for March 2026. This high interest rate environment provides strong underlying support for the US dollar.
Consequently, the USD/JPY pair is now trading near 162.50, far above the levels discussed last year. While the Bank of Japan finally exited its negative interest rate policy, its current rate of 0.10% creates a vast and attractive interest rate differential for holding dollars over yen. This carry trade remains the dominant force driving the pair’s strength.
For the coming weeks, traders should consider strategies that capitalize on this high interest rate differential while being mindful of verbal or actual intervention from Japanese authorities. Selling out-of-the-money JPY call/USD put options is a viable strategy to collect premium, betting that the pair will not see a sharp reversal below key support levels. Alternatively, bull call spreads on USD/JPY could offer a defined-risk way to profit from further upside toward the 165.00 level.
WTI traded near $91.50 in Asian hours on Tuesday, staying subdued for a third day after reports that the US and Iran may hold further talks. The talks aim to secure a longer-term ceasefire before the current two-week truce ends.
US President Donald Trump said Tehran initiated contact with Washington, while Iranian President Masoud Pezeshkian said he is willing to continue dialogue within international law. US Vice President JD Vance said on Fox News that diplomacy is ongoing and that there has been progress, though no breakthrough.
Supply Disruption Keeps A Floor Under Prices
US Energy Secretary Chris Wright said energy prices may stay elevated and could rise until vessel traffic through the Strait of Hormuz returns to normal. He said continued disruption to the shipping route is supporting price pressures.
Trump also said high oil and petrol prices could persist through the US midterm election period. An OPEC+ report said the group’s output fell by 7.9 million barrels per day in March, largely due to the Strait of Hormuz shutdown.
Attention is also on the upcoming monthly International Energy Agency report for further supply and demand signals.
We are seeing the market caught between conflicting signals from Washington and the physical supply situation. While talk of a ceasefire is pulling prices down, the massive OPEC+ output reduction provides a strong floor. This tug-of-war is setting up a period of significant volatility for crude oil in the coming weeks.
Options Strategies For Two Way Volatility
This situation feels a lot like the uncertainty we saw back in late 2025 when concerns over the Strait of Hormuz first emerged. Implied volatility on WTI options is likely to surge, much like the oil volatility index (OVX) spiked over 60 during the initial phases of the Ukraine conflict in 2022. This makes outright directional bets expensive and risky for any trader.
Given this setup, we should consider strategies that benefit from a large price swing, regardless of the direction. A long straddle or strangle, which involves buying both a call and a put option, could be effective. This play profits if the price moves sharply up on failed talks or down on a breakthrough agreement.
The physical supply disruption at the Strait of Hormuz cannot be understated, as historically it handles over 20% of global oil consumption. The reported 7.9 million barrel per day output decline is a staggering figure, far exceeding the cuts seen during the 2020 pandemic demand collapse. These supply fundamentals provide a strong argument against any significant price collapse unless a firm deal is signed and ratified.
The political calendar, specifically the upcoming US midterm elections, adds another layer of complexity for the administration. There will be immense pressure to see gasoline prices fall, which could push for a faster resolution with Iran. Traders should watch for any shifts in rhetoric from US officials as a leading indicator of a potential deal.