WTI slipped to about $89.60 per barrel in Asian trading on Friday, holding losses near $89.50. Prices eased as supply fears softened ahead of expected US–Iran talks this weekend.
Donald Trump said Tehran agreed to abandon nuclear ambitions, offer “free oil”, and reopen the Strait of Hormuz, while Iran has not confirmed this. He also said a permanent ceasefire could be reached before it expires next week.
Ceasefire Developments In The Region
Trump said he spoke with Lebanese President Joseph Aoun and Israeli Prime Minister Benjamin Netanyahu. He said Israel and Lebanon agreed to a 10-day ceasefire starting at 5 PM ET.
CNN reported that Lebanon accused Israel of “several acts of aggression” and said shelling hit villages in southern Lebanon. Lebanon’s army urged residents to delay returning to southern towns and villages due to reported breaches.
The Strait of Hormuz is described as effectively closed by a dual US–Iran blockade, raising concern over global energy flows. ING estimates about 13 million barrels per day of oil supply has been disrupted by the closure.
We should remember the extreme price swings from the 2025 crisis when WTI hovered near $89.50 amid the Strait of Hormuz closure. Today, with the strait open, the price is more stable around $85, but that episode shows how quickly geopolitical headlines can overwhelm fundamentals. The key difference now is that the estimated 13 million barrels per day of disrupted supply from that period is back online, creating a much different market structure.
Market Structure And Trade Implications
Recent data shows US crude inventories building, with the latest EIA report for the week ending April 10, 2026, showing a surplus of 2.9 million barrels. This suggests that demand may be softening slightly, which is putting some downward pressure on front-month contracts. This is a sharp contrast to late 2025, when any news of potential supply returning from Iran caused immediate price drops from crisis-level highs.
However, we see OPEC+ providing a solid floor under the market by maintaining their voluntary production cuts of 2.2 million barrels per day. This supply management is preventing prices from falling significantly despite the inventory builds we are currently witnessing. The cartel’s discipline suggests they will act to prevent a return to the price collapses seen in previous years.
Given this dynamic of bearish inventory data fighting bullish OPEC+ policy, implied volatility in options has decreased from the highs of 2025 but remains elevated. This presents an opportunity for selling premium through strategies like covered calls on long positions or iron condors if we expect prices to remain range-bound. We should look to sell volatility while defining our risk, as the memory of last year’s Mideast flare-up is still fresh.
The forward curve is less backwardated than it was during the 2025 supply shock, indicating the market is not as worried about immediate shortages. This makes calendar spread trades less compelling than they were six months ago. Traders should focus on the current range between fundamental support from OPEC and resistance from weakening demand signals.
GBP/USD fell for a third day and traded near 1.3520 in Asian hours on Friday. The Pound weakened as markets reduced expectations of a Bank of England rate rise, alongside hopes that Middle East tensions may be easing.
BoE Governor Andrew Bailey said the Bank is “not going to rush to judgments” on rate increases. He said higher oil and gas prices will feed into inflation, but rate decisions are “very, very difficult”.
BoE Expectations Shift
On Thursday, GBP/USD dropped about 0.25% to close near 1.3525 after moving back below 1.3550. It pulled back from a Wednesday rise towards 1.3600.
UK data were mixed: GDP rose 0.5% month on month in February versus 0.1% expected, and the Index of Services rose 0.5% versus 0.3% expected. Manufacturing Production fell 0.1% month on month and fell 0.5% year on year, while Industrial Production year on year was -0.4% versus -0.9% expected.
The pair also slipped 0.17% as US data outperformed, trading near 1.3534 after a two-month high of 1.3594. US Initial Jobless Claims fell from 218K to 207K versus 215K expected, while US Industrial Production dropped from 0.7% to -0.5% month on month in March.
We are seeing a familiar pattern in GBP/USD that echoes the dynamics of early 2025. The pair is once again under pressure as expectations for a Bank of England rate hike diminish. This creates an environment where selling rallies in the pound may prove to be a sound strategy.
Policy Divergence Deepens
This view is supported by the latest UK inflation data for March 2026, which showed the headline CPI rate falling to 2.8%, down from 3.2% the previous month. This cooling inflation gives the BoE cover to remain on hold, much like Governor Bailey’s cautious comments did back in 2025 when the market was also second-guessing a rate increase. We see that Overnight Index Swaps are now pricing in less than a 20% chance of a BoE hike by August.
Just as we observed weak manufacturing figures in 2025, the latest S&P Global/CIPS UK Manufacturing PMI for March 2026 printed at a contractionary 48.9. This persistent softness in the UK’s industrial sector is offsetting any strength in services, leaving the pound without a clear economic catalyst. This recurring theme suggests a structural headwind for Sterling.
On the other side of the pair, the US economy is showing relative strength, creating a policy divergence. The most recent US Non-Farm Payrolls report for March 2026 showed a robust addition of 250,000 jobs, handily beating expectations. This mirrors the strong US jobs data from April 2025 that bolstered the dollar against the pound.
Given this setup, derivative traders should consider positions that benefit from further GBP/USD downside or range-bound action. Buying GBP/USD put options with expiries in the coming one to three months offers a direct way to profit from a decline while capping risk. Specifically, a bearish put spread could be used to reduce the upfront premium cost.
The mixed economic signals, with weakness in UK manufacturing and strength in US labor, suggest volatility may be underpriced. Looking back at the spike toward 1.3600 in 2025 and its subsequent failure, it shows that sharp but temporary moves are possible. Traders could therefore look at buying volatility through instruments like straddles, anticipating a significant price move without needing to be certain of the direction.
Asian equities fell on Friday as markets turned more cautious about whether a US–Iran ceasefire would hold, and as traders took profits after a strong rally. Japan’s Nikkei 225 was down 1% near 58,900, Hong Kong’s Hang Seng Index fell over 1.30% to near 26,05, China’s SSE Composite Index slipped 0.30% to near 4,050, and South Korea’s Kospi dropped 0.42% to near 6,200.
CNN said the Lebanese army recorded multiple Israeli ceasefire violations after the truce began, with Lebanon reporting intermittent shelling affecting villages in southern Lebanon. The army urged residents to delay returning to southern towns and villages due to the reported breaches.
Ceasefire Doubts Drive Risk Off
Donald Trump said he spoke with Lebanese President Joseph Aoun and Israeli Prime Minister Benjamin Netanyahu, adding that Israel and Lebanon agreed to a 10-day ceasefire starting at 5 PM ET. Trump also said he expected the war with Iran to end soon, and that Tehran had agreed to abandon nuclear ambitions and reopen the Strait of Hormuz.
Bank of Japan Governor Kazuo Ueda said policy must take Japan’s low real interest rates into account, while markets remain split on another rate rise later this month. Asia is estimated to deliver about 70% of global economic growth and includes major indices across Japan, South Korea, China, Hong Kong and India.
The caution in Asian markets, despite news of a US-Iran ceasefire, tells us the deal is seen as fragile. The reported violations in Lebanon support this skepticism, so we should prepare for heightened volatility in the coming weeks. This environment is ideal for derivative strategies that can profit from sharp price swings in either direction.
Given the uncertainty, we should consider buying protective put options on major indices like the Nikkei 225 and Hang Seng. This acts as insurance for any existing long positions if the ceasefire breaks down suddenly. If sentiment sours, these puts will increase in value, offsetting losses elsewhere in a portfolio.
Oil Shock Hedging And Index Shorts
The situation with the Strait of Hormuz is critical, as about 20% of the world’s oil supply passes through it. Any sign of the agreement failing should be a trigger to consider long positions in Brent or WTI crude oil futures. We only have to look back to similar tensions in 2019, which caused oil prices to spike over 15% in a single day, to see the potential here.
A surge in oil prices would heavily impact energy-importing nations like Japan and South Korea, which rely on foreign oil for over 90% of their needs. Therefore, if the deal falters, we can use futures to take short positions on the Nikkei and Kospi indices. This is a direct play on the negative economic impact that higher energy costs would have on their manufacturing and export-driven economies.
The uncertainty itself is a tradable event, as implied volatility is likely to rise. Looking at history, major geopolitical events like the one in early 2022 pushed the CBOE Volatility Index (VIX) above 40, far above its average. We can use options strategies like straddles on key Asian ETFs to profit from a large market move, regardless of its direction.
Separately, we must watch the Bank of Japan, as markets are divided on a potential interest rate hike this month. This creates a distinct trading opportunity in the Japanese yen. We can use options on the USD/JPY pair to position for a surprise move, as a hike would likely cause the yen to strengthen significantly.
On the other hand, if the ceasefire holds and Iran reopens the Strait of Hormuz, we should be ready to pivot quickly. A sustained peace would cause oil prices to drop and boost global trade, benefiting Asian technology and consumer sectors. In this scenario, we would look to buy call options on the Hang Seng Tech Index or the Kospi.
The IEA said it is considering a further release of emergency oil reserves, though no decision has been made yet. It said markets may remain volatile for some time.
The IEA said energy prices could rise if the Strait of Hormuz is not reopened. It also estimated it could take about two years for global oil production to return to pre-war levels.
Electric Vehicle Adoption Accelerates
The IEA said the shift towards electric vehicle use is expected to accelerate faster than earlier forecasts.
WTI crude was down 0.39% at $89.35 at the time of writing.
Given the high probability of significant price increases if the Strait of Hormuz remains closed, we believe traders should consider buying call options on crude oil futures like WTI and Brent. The market seems to be under-pricing this risk, as evidenced by the slight dip to $89.35, creating a potential entry point for long positions. We saw a similar situation during the early days of the Gulf of Aden conflict in late 2025, where prices lagged behind geopolitical risk before surging.
The possibility of an emergency oil reserve release introduces a counter-risk, which would temporarily depress prices. Therefore, a prudent strategy would be to use option spreads to cap potential losses or to be prepared to take profits on any sharp price run-up before an official announcement is made. A coordinated release in the third quarter of 2025 caused a brief 7% drop in prices, showing how quickly sentiment can turn on this news.
Positioning For Volatility
However, we see any such dip as a buying opportunity, since the underlying supply issue will persist for a long time. The two-year timeline to restore production to pre-war levels, combined with global spare capacity already reported to be under 2.5 million barrels per day, suggests a sustained period of elevated prices. This structural deficit will likely outweigh the short-term impact of any reserve releases.
Longer-term, the accelerated shift to electric vehicles (EVs) is a key takeaway from this crisis. While this points to lower oil demand years from now, it creates an immediate opportunity in other commodities. We are seeing increased interest in call options on copper and lithium futures, as global EV sales already surpassed 14 million units in 2025 and are now projected to grow even faster.
USD/JPY rose for a third day, rebounding from about 158.25 and reaching the mid-159.00s in the Asian session. The move follows a bounce from the 200-period EMA on the 4-hour chart, near the lower edge of a short-term range.
The Japanese yen weakened amid concerns about the economic effects of the Middle East conflict and reduced expectations of a Bank of Japan rate rise in April. This supported US dollar demand and lifted the pair.
Dollar Support From Geopolitical Risk
Tensions around the Strait of Hormuz, linked to a US naval blockade of Iranian ports, helped the US dollar hold gains after touching its lowest level since late February. Hopes for diplomacy with Iran and softer expectations for US Federal Reserve policy were noted as limiting further USD strength.
Technical indicators point upwards, with the Relative Strength Index near 61 and the MACD rising in positive territory. Support is cited near 159.47, with further support at the 200-period EMA around 158.46.
We are seeing a familiar pattern in USD/JPY, reminiscent of the range-bound trading we observed around this time in 2025. The yen’s weakness is being driven by the Bank of Japan’s cautious stance, especially after the latest Tankan survey showed a decline in manufacturer sentiment, making further rate hikes seem unlikely. The pair is currently testing the 164.75 level, a multi-decade high that is making markets nervous.
Safe-haven flows are giving the US dollar a modest lift amid ongoing maritime tensions in the South China Sea. However, with the latest US CPI data showing inflation cooling to 2.8%, market pricing now suggests a 65% probability of a Fed rate cut before the fourth quarter, limiting the dollar’s potential. This policy divergence between a hesitant BoJ and a potentially easing Fed continues to be the central theme.
Options Strategies And Risk Management
For derivative traders, this suggests that buying call options on USD/JPY could be a viable strategy to capture potential upside toward the 165.00 psychological barrier. Given the capped upside from potential Fed easing, constructing a bull call spread might be more prudent than buying outright calls. This strategy allows us to profit from a moderate upward move while limiting our initial premium cost.
We must remain vigilant for intervention risk from Japanese authorities, as we saw with direct market action in late 2022 and with stern verbal warnings throughout 2024. As the pair pushes these highs, the probability of intervention increases significantly, which could cause a sudden and sharp drop of 300-500 pips. Therefore, traders holding long positions should consider buying out-of-the-money puts with a short-term expiry as a relatively cheap hedge against such an event.
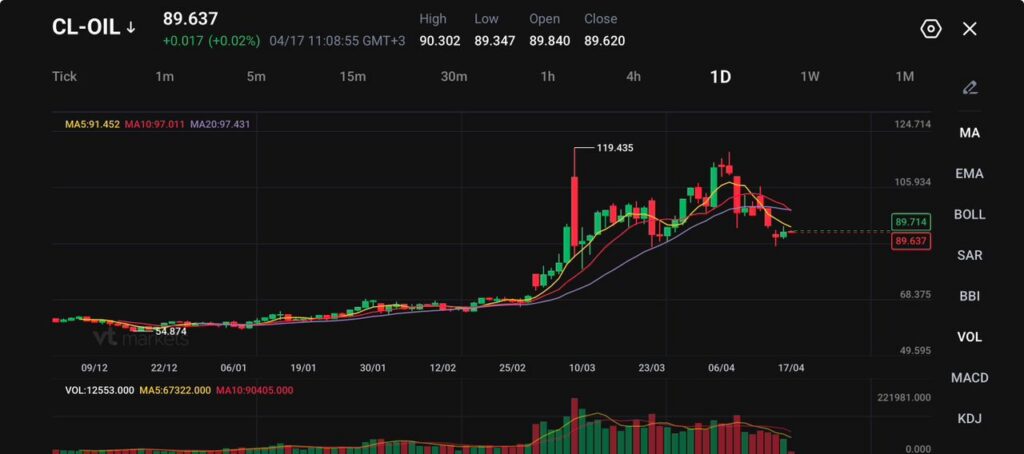
CL-OIL trades at 89.637, up 0.017 (+0.02%), after a high of 90.302 and a low of 89.347.
Brent fell 0.8% to $98.57 and WTI dropped 1.1% to $93.61 in early Europe as diplomacy improved sentiment.
The market still sees tight physical supply because the Strait of Hormuz has been disrupted for seven weeks, affecting about 20% of global oil supply.
Crude has moved lower because the market is stripping out part of the war premium that built through March. A 10-day ceasefire between Israel and Lebanon and fresh talk of possible US-Iran discussions have reduced the need for immediate panic buying. That shift has pushed Brent back below $100 and pulled WTI closer to the low $90s.
The decline still looks more like a repricing of fear than a return to normal conditions. Traders are no longer treating every headline as a straight line toward escalation, but they are also not pricing a clean recovery in Gulf energy flows. That keeps oil softer than the March highs without turning the market outright bearish.
A cautious near-term view still favours headline-driven volatility with prices supported above pre-war levels.
Hormuz Still Controls The Floor
The biggest reason the downside has stayed limited is that the physical bottleneck has not been solved. The Strait of Hormuz remains the central issue because it handles roughly one-fifthof global oil supply, and disruption there continues to distort flows, freight costs, and insurance pricing.
Trump’s plan to blockade the Strait of Hormuz would halt the nearly 2 million barrels a day of Iranian oil that’s been passing through the waterway, further squeezing global supply and cutting off a vital lifeline for the country. https://t.co/nSLfR1CYl4
ING estimated the interruption at roughly 13 million barrels per day of affected supply.
That means the market can fall on diplomacy without collapsing on it. Traders still need to see a more reliable reopening path before they price crude as though the supply shock is finished. Until then, every ceasefire headline removes some premium, but not all of it.
Market Focus on Trade Flow, Not Politics
The pricing now reflects a simple distinction. Political calm helps. Physical normalisation matters more. Even if negotiations continue, crude stays supported as long as shipping remains patchy and inventories outside the Gulf keep doing more of the balancing work.
A Pakistan-flagged tanker that entered the Persian Gulf over the weekend has become the first carrier to exit through the Strait of Hormuz with a crude cargo since a US blockade began on Monday https://t.co/AZkJV3XIt8
That is why the recent weakness in oil has been orderly rather than aggressive. Traders are more willing to sell the spike, but they are not yet willing to price a fully restored supply chain. The market still sees enough friction in the physical system to keep a floor under prices.
The Broader Macro Story Has Improved, But Only Partly
Lower oil has helped risk assets because it eases the inflation shock that had been tightening financial conditions. That support has shown up in equities and in a softer dollar tone.
At the same time, crude is still far above the levels that would signal a fully normal energy backdrop, and that leaves central banks with less room to relax.
That makes the current oil move important for two reasons. First, it reduces immediate stagflation fear. Second, it still leaves enough supply stress in place to stop markets from getting too comfortable. That balance is why oil has come off the highs while remaining fundamentally elevated.
CL-OIL Technical Outlook
CL-OIL is trading near 89.64, continuing to drift lower after pulling back sharply from the recent high around 119.43, with price now stabilising near the lower end of its recent range. The selloff has been steady, and recent price action suggests the market is attempting to find a base, though upside momentum remains weak for now.
From a technical standpoint, the structure has shifted into a short-term bearish correction within a broader uptrend. Price is trading below the 5-day (91.45) and 10-day (97.01) moving averages, both of which are sloping downward and acting as dynamic resistance.
The 20-day (97.43) sits just above, reinforcing a strong resistance cluster and signalling that bearish pressure is still in control in the near term.
Key levels to watch:
Support: 89.30 → 87.15 → 68.30
Resistance: 91.50 → 97.00 → 105.90
Oil is currently hovering just above the 89.30 support area. A break below this level could open the path toward 87.15, with further downside risk if selling pressure accelerates.
On the upside, 91.50 is acting as immediate resistance. A move back above this level could trigger a recovery toward 97.00, though stronger confirmation would be needed to suggest a broader trend reversal.
Overall, CL-OIL is in a corrective phase with bearish momentum still present, as the market digests the prior rally. The next move will likely depend on whether support at 89.30 holds or gives way to further downside.
What Traders Should Watch Next
The next move depends on whether diplomacy produces real improvement in Gulf flows or just a pause in escalation. Watch the pace of shipping through Hormuz, the tone of any weekend US-Iran discussions, and whether Brent can stay below $100 without triggering fresh concern over supply tightness. If flow confidence improves, crude can keep easing. If talks stall and transport remains constrained, the current dip may start to look too deep.
Learn more about trading Energies on VT Markets here.
Trader Questions
Why Did Oil Prices Fall After The Ceasefire News?
Crude eased because the market removed part of the war premium after a 10-day ceasefire between Israel and Lebanon and fresh discussion of possible US-Iran talks reduced immediate escalation risk. That pushed Brent to $98.57 and WTI to $93.61 in early European trade.
Why Haven’t Oil Prices Fallen More Sharply?
The market still sees tight physical supply. Shipping disruption through the Strait of Hormuz, higher insurance costs, and operational friction are still limiting how quickly flows can normalise.
Why Does The Strait Of Hormuz Still Matter So Much?
Because it handles about 20% of global oil supply. Even partial disruption can keep freight costs high and leave the physical crude market tighter than headline diplomacy alone would suggest.
Does A Ceasefire Mean The Oil Shock Is Over?
No. The ceasefire reduces immediate panic, but the supply story is still unresolved. The market still needs evidence that Gulf flows are moving more reliably before it prices a full return to normal conditions.
Why Is Oil Still Elevated Compared With Pre-War Levels?
Because supply risk remains embedded in the market. Traders have cut some of the premium, but not all of it, since disrupted Middle East production and transport bottlenecks are still feeding into physical pricing.
Start trading now – Click here to create your real VT Markets account
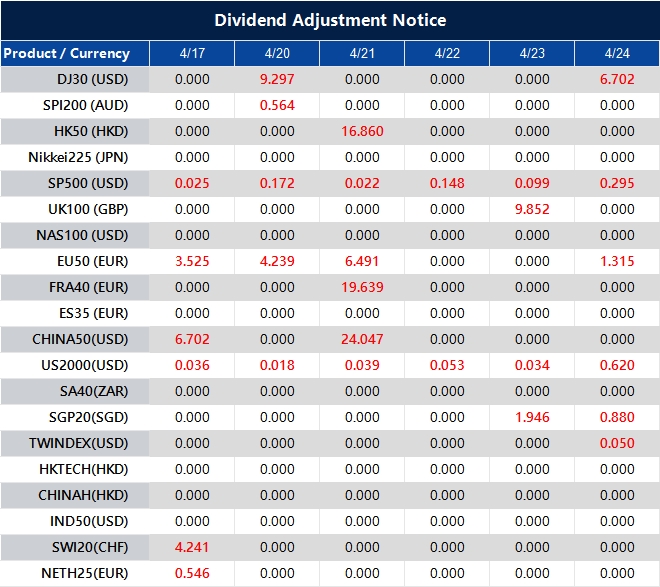
Please note that the dividends of the following products will be adjusted accordingly. Index dividends will be executed separately through a balance statement directly to your trading account, and the comment will be in the following format “Div & Product Name & Net Volume”.
Please refer to the table below for more details:
The above data is for reference only, please refer to the MT4/MT5 software for specific data.
If you’d like more information, please don’t hesitate to contact [email protected].
EUR/JPY rose after small losses the day before and traded at 187.83 during Asian hours on Friday. This was a new all-time high, with price moving higher inside an ascending channel.
The pair stayed above the nine-day and 50-day Exponential Moving Averages (EMAs). These levels were used as signals that the short-term trend remained upward.
Momentum Signals And Overbought Risk
The 14-day Relative Strength Index (RSI) was near 71, in overbought territory. This can point to strong momentum but also the risk of a pullback and consolidation.
Next resistance was noted at 188.00, then near 188.50 at the top of the ascending channel. Key support was placed at the nine-day EMA of 186.76.
If price moved below 186.76, focus could shift to the lower channel boundary around 185.80. Further down, the 50-day EMA support was listed at 184.46.
The report said the technical analysis was produced with help from an AI tool.
Strategy And Risk Management Considerations
We are seeing the EUR/JPY push into uncharted territory, which confirms the powerful uptrend we’ve been riding. This move is fundamentally supported by recent Eurozone inflation data for March 2026 coming in at 2.8%, keeping the ECB cautious, while the Bank of Japan continues to signal accommodative policy. The policy divergence between the two central banks remains the primary driver for this cross.
The Relative Strength Index hitting 71 is a clear signal to be cautious about entering new long positions at these record highs. We should anticipate a potential pullback, possibly toward the nine-day EMA at 186.76. This level presents an opportunity to buy call options or add to long futures positions, allowing us to re-enter the trend at a better price.
For those looking to trade the immediate momentum, the psychological level of 188.00 is the next clear target. A bull call spread could be an effective strategy to profit from a move toward the upper channel boundary around 188.50 while defining risk. This is a sensible approach given the overbought conditions.
On the downside, a break below 186.76 would be our first warning that the short-term momentum is fading. We would then look to the 185.80 level as the next major support. Traders holding long positions should consider buying protective put options if we see a decisive close below the nine-day EMA.
We remember that even the Bank of Japan’s historic policy shift away from negative interest rates back in 2024 did little to halt the Yen’s long-term weakness. Looking back at late 2025, we saw similar overbought RSI readings lead to brief consolidations before the uptrend resumed. This historical pattern suggests that viewing any potential dips as buying opportunities is the correct strategy for now.
Nvidia (NVDA) peaked at $212.19 on 29 October 2025, then fell to $164.27 to complete a correction that began from the April 2025 low. The price then turned higher with stronger momentum.
From the 30 March 2026 low, the move is described as a five-wave rise. Wave 1 ended at $177.37, followed by wave 2 down to $170.23 on the 30-minute chart.
Wave 3 is underway and is broken into smaller waves. From $170.23, wave ((i)) reached $190, wave ((ii)) pulled back to $185.14, and wave ((iii)) rose to $200.4.
Further upward legs are expected to complete the five-wave advance from 30 March 2026, then a corrective phase is anticipated. The upside view is tied to $170.23 holding, with pullbacks expected to form either a three-swing or seven-swing pattern.
Given the strong impulsive structure forming from the March 30, 2026 low, we believe derivative traders should position for a move toward, and likely beyond, the October 2025 record high of $212.19. The current setup, identified as a powerful wave 3, suggests that near-term weakness should be treated as a buying opportunity. This environment is favorable for strategies like buying call options or selling cash-secured puts to capitalize on the expected upward trend.
This technical strength is reinforced by fundamental tailwinds, as recent industry data from February 2026 showed a 24% year-over-year increase in data center chip sales. Furthermore, with the next earnings report anticipated in late May, implied volatility may begin to rise, which presents opportunities for traders positioning for a positive surprise. The continued rollout of enterprise AI applications is a significant catalyst that supports the technical outlook.
For the coming weeks, we see value in selling out-of-the-money put credit spreads with strikes below the key pivot of $170.23 for May or June 2026 expiration. This strategy collects premium while defining risk, aligning perfectly with the view that this critical support level will hold. As long as NVDA remains above that pivot, the bullish thesis remains firmly intact.
We are viewing this price action through the lens of past cycles, particularly the powerful recovery that began in early 2023. That period demonstrated how a confirmed market bottom, followed by an impulsive five-wave advance, could lead to a sustained rally. The current structure mirrors that earlier setup, giving us confidence that this is more than just a short-term bounce.
Written on April 17, 2026 at 8:52 am, by josephine
BRP sits in a unique position within the consumer discretionary sector. Its products are not essential, but they are aspirational, which makes the stock a useful signal of how confident consumers really are.
BRP is a premium discretionary brand, tied to leisure spending rather than necessity.
Higher interest rates are starting to pressure financing-driven demand.
The key question is whether higher-income consumers can sustain spending.
Consumer spending rarely weakens evenly. Instead, it fragments, with different income groups and categories adjusting at different speeds. This makes premium discretionary stocks particularly useful as indicators of underlying economic conditions.
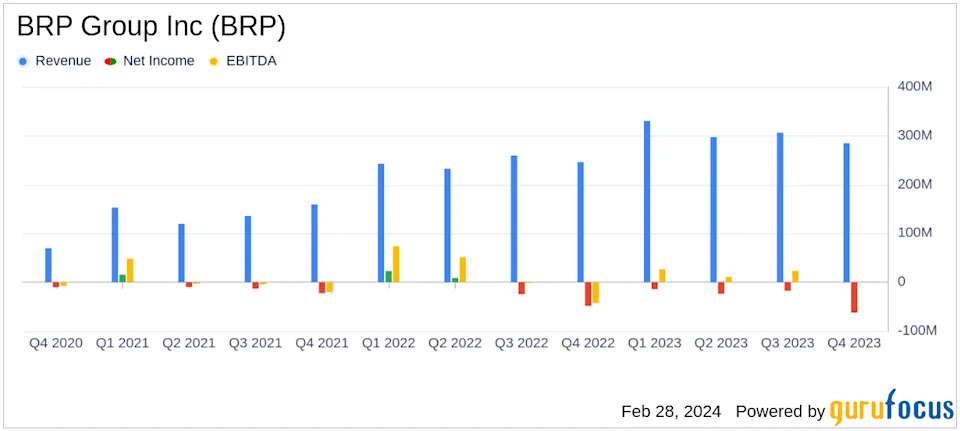
Companies like BRP Inc. offer one view into this dynamic. Their products, including recreational vehicles and leisure equipment, are high-ticket purchases tied to lifestyle and confidence rather than necessity. Recent results, including quarterly revenue of C$2.46 billion, up 16% year on year, suggest that demand remains present, but the composition of that demand is shifting.
Source: Yahoo Finance
Rather than focusing on a single company, the more important question is broader. Can premium consumer spending as a whole remain resilient as financial conditions tighten?
Premium Spending is Not Uniform
The resilience of premium spending is often misunderstood. It does not mean that demand remains strong across all segments. It means that it behaves differently.
Higher-income consumers tend to be less sensitive to short-term economic pressure. Their spending is influenced more by long-term wealth and asset values than by immediate income constraints. This allows premium brands to hold up longer during slowdowns.
However, recent trends suggest that even this segment is beginning to show signs of adjustment. Companies like Diageo, a leader in premium spirits, have faced pressure as consumers become more selective, particularly in markets where discretionary budgets are tightening.
This creates a layered demand environment. Spending does not collapse, but it becomes more uneven, with some categories holding up better than others and growth becoming harder to sustain.
Interest Rates are Reshaping Discretionary Demand
Interest rates are one of the most important drivers of this shift. Higher borrowing costs reduce flexibility across the consumer base, particularly for high-ticket purchases that rely on financing.
In sectors such as recreational vehicles, the impact is direct. Higher monthly payments reduce affordability, lengthen purchase cycles, and lead to more cautious decision-making. In other areas, such as premium goods and lifestyle spending, the effect is more indirect but still meaningful.
Consumers respond by becoming more selective. Purchases are delayed, spending is prioritised, and discretionary budgets are reassessed. This does not eliminate demand, but it changes its timing and intensity.
For traders, this is where the signal becomes valuable. Rate-sensitive consumer stocks often move ahead of broader economic data, reflecting real-time shifts in behaviour.
As interest rate expectations evolve, traders often track these effects across a range of global equities. CFD Shares on the VT Markets platform provide access to companies exposed to these same macro forces.
From Pandemic Boom to Demand Normalisation
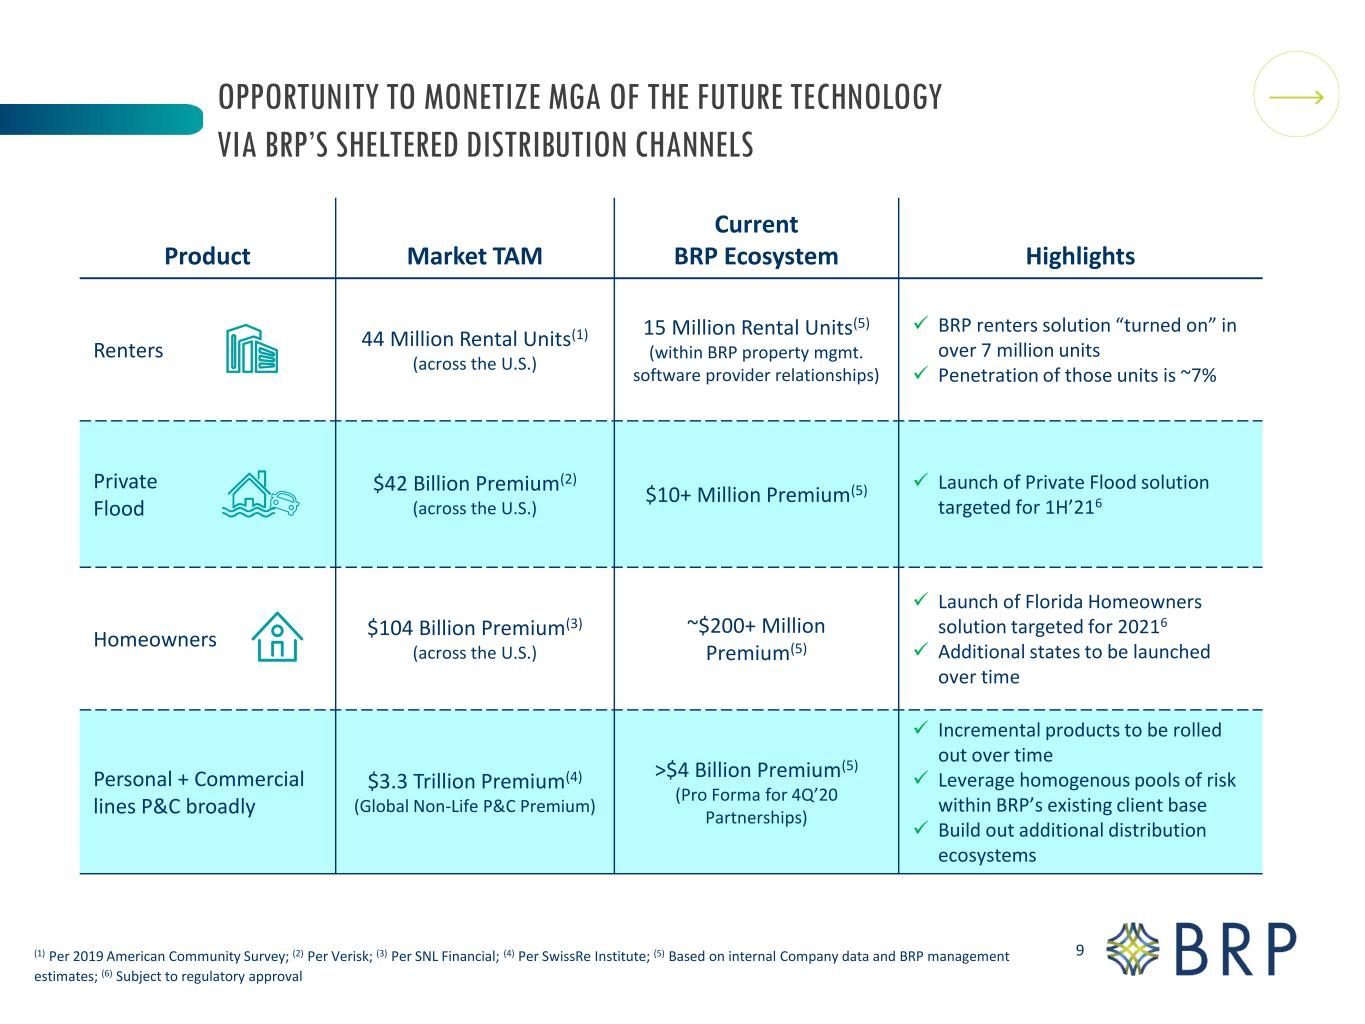
The current environment cannot be understood without considering the demand surge during the pandemic period. Between 2020 and 2022, consumers redirected spending toward goods, particularly those linked to outdoor and lifestyle activities.
Source: BRP
This created a powerful growth cycle across premium discretionary sectors. Companies benefited from elevated demand, strong pricing power, and accelerated customer acquisition.
That surge also pulled forward future demand. Many purchases that would have occurred later were brought forward, leaving a gap in subsequent periods.
“I think the higher-end consumer, the premium consumer, is candidly immune, becoming more immune to the headlines and not delaying their investment in the experience economy,” Delta Air Lines CEO Ed Bastian says on the company’s Q1 earnings call. pic.twitter.com/w5nDTBWuIE
Now, the market is adjusting. Growth is moderating, replacement cycles are extending, and new demand is entering at a slower pace. This is not necessarily a sign of weakness, but a transition toward more sustainable levels.
Similar patterns can be observed across sectors. From recreational products to premium consumer goods and even technology, many industries are now moving through a phase of recalibration following unusually strong growth, . Ttake Allbirds’ complete overhaul into AI this week.
Inventory, Pricing, and Margin Discipline
As demand normalises, the focus shifts to how companies manage the transition.
Inventory becomes a key indicator. When products take longer to sell, stock begins to build, creating pressure across the supply chain. This can eventually lead to discounting and margin compression if not managed carefully.
The same principle applies across premium lifestyle sectors. Strong brands are better positioned to preserve margins, but they are not immune to pressure. The ability to manage inventory without aggressive discounting is often a key differentiator during this phase of the cycle.
Interest Rates Are a Key Pressure Point
Interest rates remain one of the most direct drivers of BRP’s performance. Because many purchases are financed, affordability is highly sensitive to changes in borrowing costs. Even modest increases in rates can significantly affect monthly payments, altering the total cost of ownership.
This creates a clear transmission mechanism into demand. As rates rise, financing becomes more expensive, approvals may tighten, and consumers become more cautious about committing to large purchases. These effects do not always appear immediately in revenue, but they can be observed in the operating environment.
Sales cycles tend to lengthen, dealer turnover slows, and inventory begins to build. Companies may respond with increased promotional activity or incentives to stimulate demand. In this way, BRP acts as a direct reflection of how monetary policy filters into real-world consumer decisions.
This is why rate-sensitive stocks like BRP are often watched alongside broader macro assets. Traders looking to position around interest rate shifts can also explore opportunities across global shares and indices through CFDs on the VT Markets app.
Wealth Effects and Diverging Consumers
One of the defining features of the current environment is divergence between consumer groups.
Higher-income consumers, who drive much of the demand for premium products, tend to remain more resilient. Their spending is influenced by asset values and long-term financial outlook rather than immediate income pressure.
At the same time, middle-income consumers face tighter conditions. Higher borrowing costs, reduced savings buffers, and rising living expenses all contribute to more cautious spending behaviour.
Health-care costs are one part of a broader affordability crisis squeezing the middle class nationwide. That financial burden feels particularly heavy in Florida. https://t.co/libkhDEpSd
This creates a split dynamic within premium discretionary sectors. Demand may hold at the top end while weakening elsewhere, leading to changes in product mix and overall growth patterns.
For traders, this divergence helps explain why some premium stocks remain stable while others come under pressure. The underlying driver is not just income, but the distribution of financial resilience across the consumer base.
What Traders Should Watch
For traders, the key is to monitor how these figures evolve in relation to broader economic conditions. Unit sales trends provide a direct read on demand, while inventory levels offer early signals of slowing turnover. Pricing behaviour and promotional activity can indicate whether margins are under pressure, and interest rate trends remain central to understanding affordability. Consumer sentiment data adds an additional layer, helping to contextualise discretionary spending behaviour.
BRP often moves alongside consumer discretionary trends, and traders may track it in conjunction with broader retail and lifestyle sectors to gain a more complete picture of demand.
BRP often moves alongside consumer discretionary trends. Traders can explore opportunities across retail, lifestyle, and global consumer stocks through CFD Shares on VT Markets.
How Premium Lifestyle Stocks Fit Into a Broader Strategy
Premium discretionary stocks offer a targeted way to express views on consumer behaviour. They sit at the intersection of confidence, income, and financial conditions, making them particularly sensitive to changes in the economic environment.
This makes them useful in several ways. They can act as indicators of discretionary confidence, reflect the impact of interest rates on spending, and provide insight into how different consumer segments are adjusting to changing conditions.
They also offer a point of comparison with other sectors. While premium consumer stocks reflect spending behaviour, areas such as technology and AI often respond differently to the same macro drivers. Comparing these signals can help traders build a more complete view of the market.
Bottom Line
Premium lifestyle stocks are not immune to economic pressure, but they tend to adjust differently. Demand becomes more selective rather than disappearing, and resilience depends on both brand strength and the financial position of the consumer.
The current environment reflects a transition from exceptional demand to a more balanced phase. For traders, the key is understanding how this shift plays out across different sectors and consumer groups.
Create a live VT Markets account today to access our platform features, including market insights and educational content.
Trader Questions
What are premium lifestyle stocks?
Premium lifestyle stocks refer to companies that sell high-end discretionary products such as luxury goods, premium alcohol, and recreational equipment. Their performance is closely tied to consumer confidence and spending behaviour.
Why are premium brands affected by interest rates?
Higher interest rates increase borrowing costs and reduce disposable income, which can lead consumers to delay or reduce spending on non-essential purchases.
Do premium brands perform better in slow economies?
Premium brands often show more resilience because their customers tend to have higher incomes, but demand can still soften as economic pressure builds.
What stocks reflect discretionary spending trends?
Stocks in sectors such as luxury goods, premium alcohol, and lifestyle products, including companies like Diageo, often reflect broader consumer behaviour.
How can traders approach premium consumer stocks?
Traders often track a group of discretionary stocks rather than focusing on one company, using them to gauge broader trends in spending and economic conditions.
Start trading now – Click here to create your real VT Markets account