South Korea’s S&P Global Manufacturing PMI rose to 53.6 in April from 52.6 in the previous reading.
A PMI figure above 50 indicates improved manufacturing conditions, while below 50 indicates a decline.
The rise in South Korea’s manufacturing PMI to 53.6 for April shows an accelerating expansion, which is a strong bullish signal for the economy. This points to a healthy increase in new orders and production, suggesting underlying strength in demand. We should therefore consider positioning for further upside in South Korean assets in the coming weeks.
This data directly supports a long position on KOSPI 200 index futures or buying call options on the index itself. This view is strengthened by recent industry data showing global semiconductor sales rose 8% year-over-year in the first quarter of 2026, a key export for South Korea. This continues the positive momentum we have seen building since the export slump of mid-2025.
A strengthening economy will also likely lead to an appreciation of the South Korean Won against the US dollar. We can express this view by buying KRW call options or establishing other long positions on the currency. This robust data makes it far less likely that the Bank of Korea will consider interest rate cuts, providing further support for the Won.
This positive outlook is reinforced by stabilizing demand from China, whose own manufacturing PMI recently edged up to 51.1. Consequently, we see opportunities in buying call options on major individual exporters within the semiconductor and automotive sectors. These firms are direct beneficiaries of the export-led growth that this PMI data confirms.
Mediation efforts continued as the war in Iran entered its third month, while US President Donald Trump indicated that Tehran’s latest peace proposal might not meet his demands, according to Bloomberg on Sunday.
Iran proposed a one-month deadline for talks on a deal to reopen the Strait of Hormuz and end the US naval blockade, as well as the conflict in Iran and Lebanon, Axios reported, citing two sources familiar with the matter.
Oil Market Reaction
If such an agreement is reached, the plan would start a further month of discussions aimed at securing a deal on Iran’s nuclear programme, the sources said.
In market trading at the time of writing, West Texas Intermediate (WTI) was down 1.05% on the day at $98.18.
The recent dip in West Texas Intermediate to $98.18 reflects market optimism that these peace talks might de-escalate the conflict. We must remember this price is still highly elevated due to the ongoing US naval blockade of the Strait of Hormuz. That waterway is critical, as it consistently handles over 20% of the world’s daily seaborne oil supply, a statistic confirmed by the U.S. Energy Information Administration in recent years.
For those who believe a deal is likely within the one-month deadline, buying WTI put options could be a prudent strategy. This allows us to position for a sharp price drop if the strait reopens, but with a defined risk compared to shorting futures. We see that implied volatility is extremely high, making options costly, but that volatility will collapse and reward put holders if a peace pact is signed.
Hedging Escalation Risk
However, we remain cautious, as the president’s remarks suggest a high probability that the talks will fail. We only have to look back to early 2022, when the conflict in Ukraine caused WTI prices to surge well over $120 a barrel in a matter of weeks. A breakdown in these negotiations could easily trigger a similar spike, making out-of-the-money call options an attractive way to hedge against an escalation.
This binary situation, with a major potential move in either direction, means strategies that profit from volatility itself should be considered. A long strangle, which involves buying both an out-of-the-money call and an out-of-the-money put, positions a trader to benefit from a significant price move regardless of direction. This is a direct bet that the current stalemate, and the sub-$100 price, will not last.
AUD/USD rose to about 0.7215 in early Asian trading on Monday. The Australian dollar advanced as markets expected a Reserve Bank of Australia rate rise on Tuesday.
Reuters put the odds of a third consecutive RBA rate increase at nearly 80%. Australian headline CPI inflation rose to 4.6% year on year in March, below the 4.7% forecast but above the bank’s target range.
Rba Expectations Lift The Aussie
Middle East tensions supported demand for the US dollar as a safe-haven, which could limit gains in AUD/USD. Bloomberg reported that US President Donald Trump said the US would start guiding some neutral ships in the Persian Gulf out through the Strait of Hormuz from Monday.
An Iranian official said any US interference in the Strait of Hormuz’s new maritime regime would be seen as a ceasefire violation. These developments added to uncertainty around the currency pair.
We remember looking at this exact situation back in early May 2025, when the market was pricing in an aggressive Reserve Bank of Australia. Headline inflation had just hit 4.6%, pushing the AUD/USD exchange rate toward 0.7215 on the expectation of another rate hike. The primary trade was to be long the Australian dollar, but it was complicated by tensions in the Persian Gulf.
Today, the dynamic has completely changed, as those rate hikes from last year have worked to cool the economy. The latest quarterly CPI data showed inflation has fallen to 2.8%, well within the RBA’s target range. In contrast, US core inflation remains sticky at 3.7%, meaning the Federal Reserve is signaling no rate cuts until at least the end of this year.
Policy Divergence And Downside Risks
This growing policy divergence, with a dovish RBA and a hawkish Fed, creates a fundamental downward pressure on the AUD/USD pair. We’ve seen one-month implied volatility on the pair creep up from 9% to 12.5% over the last few weeks, indicating the market is preparing for a move. Therefore, positions that benefit from a weaker Australian dollar appear logical.
Much like the Middle East risk we saw in 2025, we now face geopolitical uncertainty from ongoing trade disputes in the South China Sea. Any escalation there would likely trigger a flight to safety, further strengthening the US dollar as a safe-haven asset. This acts as a potential catalyst that could accelerate any AUD/USD decline.
Given this outlook, we are considering strategies like bear put spreads for the June and July expiries. This approach allows us to capitalize on a potential slide in the AUD/USD driven by central bank policy differences. Crucially, it also defines our maximum risk, which is prudent in case a sudden resolution in trade tensions causes an unexpected snap-back rally.
US markets have been unsettled by uncertainty in the Middle East, with the S&P 500 down around 4%, compared with Europe’s STOXX 600 down 9% and Japan’s Nikkei down 12%. This has increased caution towards speculative shares, including high-priced AI names.
By the end of Q1 2026, every member of the Magnificent Seven was down more than the S&P 500, alongside falling price-to-earnings ratios. The article contrasts this with fintech firms that tend to have lower valuations and established product demand.
Fintech Names In Focus
SoFi Technologies has a market capitalisation of $21 billion and is linked to forecasts of 30% revenue growth and 34% EBITDA growth by 2026. Its shares are down 34% in 2026 amid allegations of account abuse and unrecorded debt, which the company denies.
Block processes merchant payments at an annualised rate of more than $250 billion and offers banking via Square Financial Services. Its shares are down 6% in 2026, and Cash App has 58 million active monthly users.
Nubank has a $71 billion market capitalisation and 127 million users across Latin America. It counts around 60% of Brazil’s adult population as users and is seeking a Brazilian banking licence this year.
With the VIX volatility index hovering around 25, significantly higher than last year’s average, the market is pricing in continued uncertainty. The recent dip in the S&P 500 by 4% since the Iran conflict began has been led by tech, with the Nasdaq 100 down over 8% year-to-date. This environment makes selling options premium an attractive strategy, as elevated implied volatility inflates their prices.
Options Strategies For Volatility
We have seen this pattern before, particularly looking back at the rate-hike cycle of 2022, where high-growth, high-valuation stocks were punished first. The Magnificent Seven are following this script in 2026, with a leader like Nvidia having fallen over 15% from its highs this year. The market is signaling a clear rotation away from names with lofty price-to-earnings ratios and toward companies with more tangible valuations.
For a high-risk name like SoFi, its 34% year-to-date decline has pushed its implied volatility rank into the 90th percentile. This presents an opportunity for us to sell cash-secured puts at strike prices well below the current level, allowing us to collect a high premium with a significant margin of safety. This strategy profits from both time decay and any potential stabilization or recovery in the stock price.
Block appears far more resilient, having declined only 6% in 2026, outperforming its large-cap tech peers. Given the recent analyst upgrades, we could consider buying bullish call debit spreads for the summer months. This approach defines our risk while allowing us to capitalize on a potential grind higher, without paying the full price for expensive outright calls.
Nu Holdings presents a unique catalyst with its pending Brazilian banking license decision. This binary event makes its options pricing particularly sensitive, so we can position for a significant move by purchasing a long straddle with a 90-day expiration. This strategy allows us to profit from a large swing in either direction following the announcement, capitalizing on the expected explosion in volatility.
To hedge against broader market weakness while isolating this fintech thesis, we can structure a pair trade. This could involve buying a basket of calls on Block and Nu while simultaneously buying puts on the QQQ ETF. This position is designed to profit if fintech stocks show relative strength and outperform the broader tech sector in the turbulent weeks ahead.
Singapore’s Manufacturing Purchasing Managers’ Index (PMI) rose to 50.7 in April. It was 50.5 in the previous month.
A PMI reading above 50 indicates expansion in manufacturing activity. A reading below 50 indicates contraction.
Manufacturing Expansion Remains Intact
The latest manufacturing PMI data for April shows continued expansion, moving up to 50.7. This marks the ninth consecutive month of growth, suggesting a resilient economic undercurrent. For us, this steady, albeit slow, acceleration signals that the foundation of the Singaporean economy is firming up.
This positive headline figure is strongly supported by the electronics sector, a key driver for Singapore’s economy, which saw its own sub-index rise to 51.2. This aligns with the most recent non-oil domestic exports (NODX) data from March, which showed a year-on-year increase of 3.1%, beating consensus forecasts. The consistent positive data points towards a solidifying recovery in global tech demand.
Looking back, this trend is a welcome change from the more volatile readings we saw in late 2025 when the PMI hovered much closer to the 50-point mark. The sustained growth in early 2026 suggests the manufacturing downturn from that period is now firmly behind us. This gradual improvement builds confidence that the current momentum is sustainable.
For equity derivative traders, this reinforces a bullish bias on the Straits Times Index (STI). We should consider buying STI call options with June and July expiries to capitalize on potential upside as positive economic news gets priced in. Selling out-of-the-money puts on blue-chip manufacturing stocks is also an attractive strategy to collect premium while expressing a positive view.
In the currency market, this data gives the Monetary Authority of Singapore (MAS) more reason to maintain its policy of gradual appreciation for the Singapore Dollar. The economic strength reduces the likelihood of any policy easing, making the SGD attractive. We see an opportunity in selling USD/SGD call options, betting that the pair will remain capped as the Singapore Dollar holds firm.
Rates Outlook And Trading Implications
The firming economic picture also has implications for interest rates, suggesting they will remain stable at current levels for longer than previously anticipated. The prospect of rate cuts is diminishing, which should be factored into pricing for interest rate swaps and futures. We should be cautious about holding positions that rely on a near-term dovish pivot from the central bank.
While this shift has been gradual, it is now the foundation of global competition. Over the last two decades, major economies have learned to turn their commercial strengths into political leverage. By controlling trade access, energy supplies, or financial infrastructure, states can now extract concessions and reshape relationships without firing a single shot.
From Military Force to Economic Pressure
The best way to see this shift is to look at the tools leaders look to first.
The United States operates at the structural level. By controlling access to the US dollar and the SWIFT payment system, it can effectively decide who gets to participate in global trade.
Russia spent decades building energy dependency in Europe, using natural gas exports as a tether.
China has secured a near-monopoly on processing rare earth minerals — the essential ingredients for electric vehicles, smartphones, and defense systems.
Saudi Arabia and OPEC use oil production levels to do more than just stabilise prices; they use them to signal friendship or displeasure to the West.
The logic across the board is identical: convert a dominant economic position into raw political power.
Key Leverages
1. Energy as a Tether: The “Interdependence” Theory
For decades, the West followed a theory called Change through Trade. The idea was that deep commercial links would make war too expensive for anyone to start. If Germany bought Russian gas and Russia needed German Euros, both were “locked in” to peace. In reality, this created a lopsided vulnerability. While Russia wanted cash, Europe needed the heat. When conflict broke out, Russia used this dependency as a leash, threatening to cut off fuel supplies to paralyze Europe’s political response.
This same logic applies to global “chokepoints” like the Strait of Hormuz. Roughly 20% of the world’s total oil consumption passes through this narrow stretch of water controlled by Iran. Much like Russia’s pipelines, the Strait is a physical valve. Iran has frequently used the threat of closing the Strait to deter sanctions or military pressure from the West. Today, global strategy has flipped: concentrated infrastructure and narrow shipping lanes are no longer seen as bridges to peace, but as “choke points” that a rival can squeeze to force submission.
2. The Resource Monopoly: Understanding “Rare Earths”
“Rare earths” are a group of 17 minerals used in almost everything high-tech, from smartphone screens to electric vehicle motors and missile guidance systems. While these minerals aren’t actually rare in nature, they are incredibly difficult and “dirty” to refine. Over the last few decades, China has positioned itself to handle about 60% of the world’s mining and nearly 90% of the refining for these materials. Read about China’s Export Surplus here.
Because China handles processing plants, they can slow down global tech production simply by tightening export licenses or changing regulations. They don’t need to declare a formal trade war to make an impact; the mere threat of a supply hiccup is enough to make other countries think twice during a diplomatic dispute. It turns a mining industry into a powerful tool for global negotiation.
3. The Financial Thermostat: What is OPEC?
OPEC acts as a global economic “thermostat.” By coordinating how much oil they pump, these nations can swing global prices, which directly impacts inflation and interest rates worldwide. However, this collective power is currently facing its biggest test following the UAE’s historic decision to go it alone.
Feature
The Old Model (OPEC Unity)
The New Reality (UAE Exit)
Membership
A 13-nation cartel led by Saudi Arabia.
The UAE officially exited on May 1, 2026.
Strategy
Members follow strict production quotas to keep oil prices high.
The UAE is prioritizing its own national revenue over group discipline.
Leverage
A unified “shock” to the market can force global political concessions.
Influence is now fragmented, making oil markets more volatile and harder to predict.
Goal
Collective price stability for the group.
Maximising individual production (targeting 5M barrels/day).
The UAE’s departure, the most significant in OPEC’s 65-year history, signals a shift away from central control. As major players prioritize their own investments over old alliances, the “thermostat” becomes much harder for any one group to control.
4. The ‘Chokepoint’: Payment Channels
SWIFT is often described as the “financial nervous system” of the world. It isn’t a bank, and it doesn’t hold money; it is a messaging network that allows 11,000 banks in 200 countries to securely send instructions for cross-border payments. Because it is so dominant and connects nearly every major financial institution, it has become the go-to for global trade.
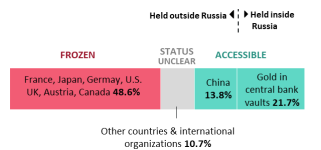
Bank of Russia: Frozen Reserves. Source: Congress.gov
When a country is disconnected from SWIFT — as happened to several major Russian banks in 2022 — it effectively becomes an island in the global economy. Companies find it nearly impossible to pay for imports or receive money for exports.
The risk of being cut off has triggered a “fragmentation” of the global payments market, where “new forms of money are being developed” to ensure countries have a backup plan.
While these alternatives are growing, the dollar-based SWIFT system remains the central hub, meaning the ability to grant or deny access to this network remains one of the most significant tools of political pressure today.
The Axis is Changing
The global map is reshaping.
The common thread here is dependency. The more you need something, and the fewer alternatives you have, the more leverage the supplier holds.
As a result, we aren’t seeing “deglobalisation,” but rather a “strategic restructuring.”
Countries are no longer building supply chains based purely on the lowest cost. Instead, they are prioritising security:
Europe is diversifying its energy sources.
The US and Australia are racing to build domestic mineral processing.
China is attempting to internationalise the Yuan to bypass the dollar.
These aren’t just business moves; they are insurance premiums against economic coercion. Something that every country is increasingly impacted by in current trade dynamics of the Trump era.
What This Means for the Future
Markets are great at pricing known risks, but they are historically bad at pricing “strategic dependency.” A commercial relationship looks normal until the moment it is weaponized.
For investors and policy leaders, the gap between business and geopolitics has vanished. Exposure to oil prices or semiconductor minerals is no longer just a line item on a balance sheet—it’s a vulnerability.
In this new multipolar world, the most powerful players aren’t necessarily those with the biggest militaries. They are the ones who identified early which economic gears move the world—and put their hands on the lever. Find the most relevant, tradable assets and the latest news on world trade here at VT Markets.
Tap here for Article summary
What is “weaponised interdependence”? It is a strategy where a state uses its control over a global network (like a payment system or a pipeline) to pressure others. Since modern nations are “locked in” to these networks to function, the party that controls the “tap” can exert political power without military force.
Why are “rare earths” a geopolitical risk? While the minerals themselves are common, China controls nearly 90% of the refining process. Because they are essential for high-tech goods (EVs, smartphones, missiles), this monopoly allows one country to disrupt global tech supply chains through simple regulatory changes or export limits.
What does the UAE’s exit from OPEC mean for oil prices? The UAE’s departure on May 1, 2026, signals the decline of centralised oil pricing. By leaving the cartel to maximize its own production (targeting 5M barrels/day), the UAE has prioritized national revenue over group unity, likely leading to a more volatile and competitive global energy market.
Is the world actually deglobalizing? No, it is “restructuring.” Trade is moving away from the lowest-cost models toward “security-first” models. Countries are now willing to pay more to build redundant supply chains and domestic industries as an insurance premium against being coerced by rivals.
How does being cut off from SWIFT affect a country? It acts as a financial “kill-switch.” Disconnected banks lose the ability to send secure payment instructions across borders, making it almost impossible to pay for imports or receive money for exports. This effectively exiles a nation from the global financial system.
Create a live VT Markets account today to access our platform features, including market insights and educational content!
Start trading now – Click here to create your real VT Markets account
AUD/USD traded near the top of a 0.7100–0.7200 consolidation band, hovering around 0.7200. Late in the North American session it was up 0.10%, and it was set to end the week 0.84% higher.
A bullish engulfing pattern was cited as limiting moves lower, while the Relative Strength Index remained above 50. That setup points to upward momentum within the current 100‑pip range.
Key Technical Levels
Resistance is seen at 0.7250, then 0.7282 (June 3, 2022 high) and 0.7300. A further level referenced is 0.7661 (April 5, 2022).
If the pair closes below 0.7200, support levels include the 20‑day SMA at 0.7121, then 0.7100 and the 50‑day SMA at 0.7059. These levels outline potential downside tests within the range.
The Australian Dollar is influenced by Reserve Bank of Australia policy, commodity prices and China’s economic conditions. The RBA targets inflation of 2–3% and can also use quantitative easing or tightening to affect credit conditions.
Iron ore is Australia’s largest export, totalling $118 billion a year based on 2021 data. Trade balance outcomes can also affect the currency.
Market Context In 2025
We can see how, when looking at the situation from the perspective of 2025, the bullish sentiment for the AUD/USD hovering around 0.7200 was based on strong technical signals like the RSI. That consolidation period represented a different market environment compared to where we stand today. The fundamental drivers, especially interest rate differentials, have since shifted the entire landscape.
The Reserve Bank of Australia has held its cash rate at 4.35% for several months now into mid-2026, trying to bring stubborn inflation back to its 2-3% target. However, with the U.S. Federal Reserve rate holding higher, the interest rate differential continues to favor the US dollar. This fundamental pressure is a key reason the pair now trades closer to 0.6650, far below the levels seen in that earlier analysis.
The commodity story, which was a tailwind back then, is now offering less support. Iron ore prices are currently hovering around $115 per tonne, a significant step down from the volatile but often higher prices we saw through much of 2022 and 2023. At the same time, recent manufacturing PMI data out of China has been mixed, creating uncertainty about demand from Australia’s largest trading partner.
This shift suggests that upside potential for the Aussie is capped for now. Derivative traders should note that implied volatility has been moderate, suggesting the market is not expecting explosive moves but is wary of downside risks. The old 0.7100-0.7200 range is now a distant memory, replaced by a new battleground between roughly 0.6600 and 0.6700.
Given the fundamental headwinds, traders might consider buying put options with a strike below the 0.6600 support level to position for a potential break lower, driven by any surprisingly weak Australian data or hawkish Fed commentary. For those who believe the downside is limited, selling out-of-the-money call options, perhaps with a 0.6800 strike, could be a strategy to collect premium while acknowledging the strong resistance overhead. This approach defines risk while capitalizing on the currently restrained upside.
Looking ahead, the next RBA meeting and upcoming U.S. inflation figures will be critical catalysts. Any sign that the RBA is becoming more concerned about growth than inflation could accelerate downside momentum. Traders should therefore watch these events closely to adjust their positions or identify fresh opportunities in the options market.
Japan’s CFTC data shows non-commercial net positions in the Japanese yen fell to ¥-102.1K. This compares with the previous level of ¥-94.5K.
This indicates a larger net short position than before. The change is ¥-7.6K from the prior reading.
The net short position against the Japanese Yen has deepened significantly, reaching -102.1K contracts. This shows us that speculative traders are increasing their bets that the Yen will continue to fall in value. This is the most bearish positioning we have seen in several months and reinforces the ongoing downtrend.
This sentiment is anchored by the wide interest rate differential between the Bank of Japan and other central banks, particularly the U.S. Federal Reserve. Recent data from April 2026 showed U.S. core inflation remaining persistent around 2.9%, making near-term Fed rate cuts unlikely. This fundamental mismatch continues to fuel the carry trade, where traders borrow Yen to invest in higher-yielding currencies like the dollar.
For traders aligned with this trend, the data supports adding to short Yen positions through futures or buying call options on the USD/JPY pair. The path of least resistance appears higher for USD/JPY, especially as it tests levels above the 165 mark. The market momentum is clearly positioned for further Yen weakness in the coming weeks.
However, such a crowded trade presents a significant risk of a sharp reversal, much like the volatile swings we observed in late 2025. A surprise intervention by Japanese authorities or a sudden downturn in U.S. economic data could trigger a violent short squeeze. The extreme level of negative sentiment itself is a contrarian warning sign.
Therefore, a cautious strategy involves hedging these short positions. We should consider buying cheap, out-of-the-money put options on USD/JPY as a form of insurance. This provides a safety net against sudden policy shifts from Tokyo, a risk that has grown substantially since the confirmed interventions back in the spring and summer of 2024.
US CFTC data shows net positions in gold for non-commercial traders fell from 164,000 to 159,600.
The change points to a drop of 4,400 contracts from the prior reading.
Speculative Positioning Shifts
We are seeing large speculators slightly reduce their bullish bets on gold, with net long positions dipping to $159.6K. This indicates some profit-taking or a small increase in caution after a period of strong buying. While not a major reversal, it is a signal that conviction may be starting to wane at current price levels.
This shift in positioning aligns with recent economic data, as the April 2026 jobs report came in stronger than expected, showing 285,000 new jobs against a forecast of 190,000. These numbers, combined with recent hawkish tones from the Federal Reserve, are pushing back expectations for a summer interest rate cut. A strong dollar, which just hit a three-month high around 106.50 on the DXY, adds further pressure on gold prices.
For derivative traders, this suggests a more defensive posture in the coming weeks. The failure of gold to convincingly hold above the $2,450 per ounce level last month makes the current price action look like a potential short-term top. We saw a similar pattern in the fall of 2025 when strong economic data caused a sharp, temporary pullback before the uptrend resumed.
Considering this, buying put options to hedge existing long positions appears to be a prudent strategy. It provides downside protection if gold tests lower support levels, possibly near the $2,300 mark, without requiring a full exit from the market. Bear put spreads could also be used to cheapen this hedge, defining the risk while targeting a moderate downturn.
Options Volatility Strategies
The uncertainty around the Fed’s next move may also increase implied volatility in the options market. Traders could look at strategies like long straddles or strangles if they expect a significant price move but are unsure of the direction. This would capitalize on a breakout from the current range, which often follows a period of consolidation and indecision.
UK CFTC data showed GBP non-commercial net positions fell to £-60.6K from £-52K.
This indicates a larger net short position in sterling in the latest reporting period.
We are seeing speculative sentiment turn increasingly bearish on the British Pound. The net short position held by non-commercial traders has deepened to -£60.6k, indicating that more traders are betting on a fall in its value. This is a significant shift that warrants attention.
This negative positioning is likely driven by recent economic data showing UK inflation unexpectedly ticking up to 3.5% in April, while first-quarter GDP growth remained stagnant at just 0.2%. This combination of stubborn price pressures and a weak economy is putting the Bank of England in a difficult position. The market is now pricing in a lower probability of interest rate cuts this summer, which is weighing on growth prospects.
Looking back, we saw a similar dynamic unfold in mid-2025 when concerns about the UK’s twin deficits resurfaced alongside sticky services inflation. That period saw the pound weaken considerably against the dollar as capital sought safer havens. History suggests that when speculative shorts build to these levels, the currency can be vulnerable to a sharp move lower.
For derivative traders, this environment suggests considering strategies that profit from a decline in the pound. Buying put options on the GBP/USD pair, or establishing bear put spreads to limit cost and define risk, could be effective ways to position for potential downside. These instruments allow traders to capitalize on falling prices while controlling their maximum potential loss.
We should be watching key technical levels, particularly the 1.2350 support for GBP/USD, as a break below could trigger further selling. Upcoming UK employment and retail sales figures will be critical catalysts in the coming weeks. Any signs of further economic weakness could easily accelerate the pound’s decline.