South Korea’s unemployment rate fell to 2.7% in March. It had been 2.9% in the previous period.
This lower unemployment figure, dropping to 2.7%, points to a surprisingly robust labor market. Combined with recent inflation data showing core CPI holding firm at 3.2%, it suggests underlying economic strength is greater than we anticipated. This tightens the path forward for monetary policy.
Implications For Monetary Policy
We see the Bank of Korea now having almost no justification to consider an interest rate cut in the near term. With the policy rate currently at 3.50%, this strong employment report effectively shelves any dovish pivot we might have been expecting. The focus for traders should now shift towards the possibility of a more hawkish stance from the central bank.
For interest rate traders, this means positioning for higher yields, particularly at the short end of the curve. Shorting the 3-year Korea Treasury Bond futures is a direct way to express this view, as the market will have to price out any remaining chance of a rate cut this year. We’ve already seen the 3-year yield climb 5 basis points to 3.45% on the news, and we expect this trend to continue.
This outlook is also supportive for the Korean Won. A stronger economy paired with a central bank that is unable to cut rates makes the currency more attractive, especially as the last trade data from March showed a $4.9 billion surplus. We believe going long the Won against the US dollar is the logical currency trade, with a potential target of 1320 for the USD/KRW pair in the coming weeks.
On the equity side, specifically the KOSPI 200 index, the picture is less clear and warrants a more cautious approach. While a strong economy is good for corporate earnings, the corresponding threat of higher interest rates can put a ceiling on valuations, similar to the volatility we witnessed when rate fears hit the market back in 2025. Selling out-of-the-money call options on the index near the 2,800 level could be a prudent strategy to hedge against limited upside.
NZD/USD rose over 0.55% on Tuesday, reaching about 0.5920 before easing back to around 0.5900. It has rebounded from early-April lows near 0.5790, but price action showed rejection around 0.5900 and short-term momentum faded, with the intraday Stochastic moving back into oversold.
US data weighed on the US Dollar, supporting the New Zealand Dollar. US PPI was 0.5% month-on-month versus a 1.2% consensus, while core PPI was 0.1% versus 0.6% expected, and services were flat.
Drivers And Near Term Catalysts
A comment from President Trump about possible US-Iran talks within days also reduced demand for the US Dollar as a safe haven. RBNZ’s Breman spoke during the week with no major policy change signalled, while Thursday brings China’s first-quarter GDP and Australian jobs data.
On a 15-minute chart, NZD/USD held above the daily open at 0.5869, with Stochastic RSI recovering towards the low-30s. On the daily chart, it stayed above the 200-day EMA at 0.5852 and the 50-day EMA at 0.5847, while daily Stochastic RSI hovered near 70.
Looking back to this time in 2025, we saw the NZD/USD pair struggling to break past the 0.5900 resistance level. Weak US data gave the Kiwi a boost, but momentum was clearly fading at that key ceiling. This setup provided a critical test for the pair’s underlying strength, which it eventually passed.
Today, we are in a different position, with the pair trading significantly higher around 0.6150. The Reserve Bank of New Zealand has maintained its hawkish stance with the official cash rate at 5.50%, as inflation remains a concern above their target band. This contrasts with the Federal Reserve, which began a cautious easing cycle earlier this year.
However, some headwinds are emerging that traders should watch closely in the coming weeks. China’s latest GDP figures for the first quarter came in at 4.8%, just missing expectations and raising concerns about demand from New Zealand’s largest trading partner. Furthermore, the most recent Global Dairy Trade auction saw prices slip by 1.5%, which could weigh on Kiwi sentiment if the trend continues.
Options Positioning And Key Levels
Given this environment, a cautious but bullish stance using options could be appropriate. We believe traders should consider buying bull call spreads, which involves buying a call option at a lower strike price and selling one at a higher strike. This strategy allows for profit if the NZD/USD continues its gradual climb but caps both potential gains and losses, protecting against a sudden reversal.
For those more concerned about the weaker Chinese data, buying put options could serve as a hedge or a direct bet on a downturn. If the pair breaks below the crucial 0.6100 support level, it could signal a deeper correction is underway. This would be a clear signal to re-evaluate any long positions.
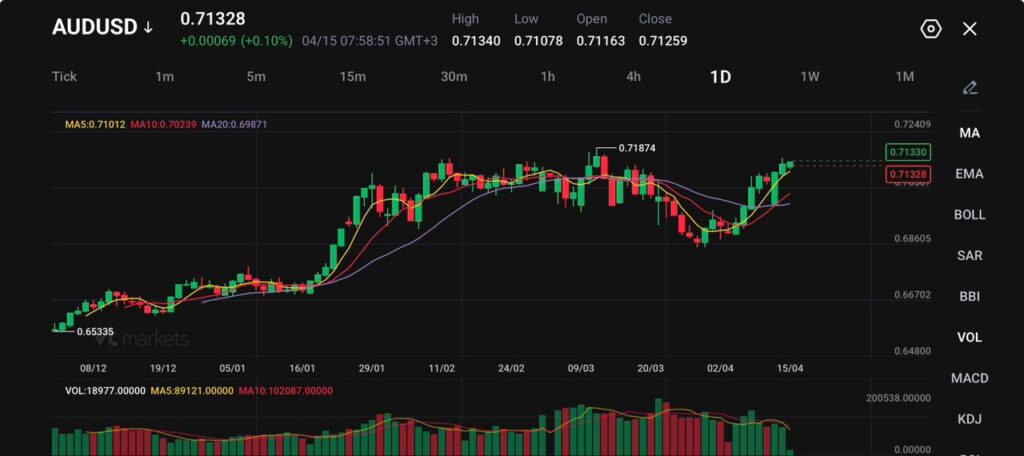
AUDUSD trades at 0.71328, up 0.00069 (+0.10%), after touching 0.71340 and building on a recent one-month high.
Bond yields eased, with Australia’s 3-year yield at 4.607% and the 10-year yield at 4.932%, as lower oil prices reduced inflation fear.
Markets are watching Australian labour data, with consensus looking for 20,000 new jobs in March and an unemployment rate of 4.3%.
The Australian dollar is staying bid because the market has shifted back toward risk after oil prices pulled lower and ceasefire hopes improved sentiment. AUDUSD is trading near 0.71328, after testing 0.71340, and remains close to the recent one-month peak. The move has come alongside stronger equities, softer energy prices, and a weaker US dollar backdrop.
That mix suits the Aussie. It tends to perform well when growth fear fades, commodities stay orderly, and traders step out of defensive dollar positions. The latest dip in oil has reduced some of the inflation shock that had been weighing on global risk assets through late March.
A cautious near-term view still favours support for AUDUSD while risk appetite holds up and crude stays off the highs.
Lower Oil Eases Pressure
The recent energy shock created a difficult backdrop for the Australian dollar. Higher oil prices had lifted global inflation risk, increased rate uncertainty, and made traders more defensive. Once hopes of peace talks pulled Brent down toward the mid-$94 area and US crude toward the low $90s, the pressure started to ease.
The Trump administration will allow a waiver temporarily authorizing the purchase of certain Iranian crude oil to expire this weekend, according to a White House official. https://t.co/wUPaeTphDB
That helped bonds recover and gave yield-sensitive currencies some breathing room. Australia’s 3-year government yield fell 2 basis points to 4.607%, while the 10-year yield dropped 2 basis points to 4.932% after an earlier 7-basis-point decline.
Lower yields did not hurt the Aussie in this case because they reflected falling inflation stress rather than collapsing growth expectations.
The market is effectively treating the oil pullback as a net positive for Australia at this stage. It lowers imported inflation pressure without yet signalling a broader global downturn.
AUDUSD Technical Outlook
AUDUSD is trading near 0.7133, pushing higher and approaching the upper end of its recent range after a clean rebound from the early April lows.
Price action shows improving bullish momentum, with the pair climbing steadily and now testing levels just below the prior swing high around 0.7187. The structure suggests buyers are regaining control, though price is nearing a key decision zone.
From a technical standpoint, the trend is shifting back into a bullish recovery phase. Price is holding firmly above the 5-day (0.7101) and 10-day (0.7023) moving averages, both of which are sloping upward and providing near-term support.
The 20-day (0.6987) sits below as a stronger base, reinforcing the shift in short-term sentiment from bearish to constructive.
Key levels to watch:
Support: 0.7100 → 0.7020 → 0.6985
Resistance: 0.7150 → 0.7187 → 0.7240
The pair is now pressing into the 0.7150–0.7187 resistance zone. A sustained break above this area would likely open the path toward 0.7240, with momentum potentially accelerating if the breakout holds.
On the downside, 0.7100 is acting as immediate support. A move below this level could trigger a pullback toward 0.7020, though this would likely remain corrective unless the broader structure weakens.
Overall, AUDUSD is showing renewed bullish momentum within a recovering structure, with price testing key resistance. The next move hinges on whether buyers can clear the 0.7187 high or if the pair stalls and rotates back into consolidation.
What Traders Should Watch Next
The next move depends on whether the risk-on mood holds and whether Australian jobs data validates the yield story. If oil stays lower, global equities remain firm, and employment beats expectations, AUDUSD can keep pressing toward 0.71874.
If talks around Iran stall or labour data disappoints, the pair may slip back toward the low 0.70s instead.
AUDUSD is staying firm because lower oil prices have improved risk sentiment, eased inflation fear, and reduced demand for the US dollar as a defensive trade. The pair was recently near 0.7131 to 0.7133 after reaching a one-month high around 0.7147.
Why Does Falling Oil Help The Australian Dollar?
Lower oil prices reduce the inflation shock that had been pushing markets into defensive positioning. That supports equities, helps bonds recover, and makes risk-linked currencies like the Aussie more attractive again. Australia’s 3-year yield fell to 4.607% and the 10-year yield to 4.932% as oil retreated.
Why Didn’t Lower Bond Yields Hurt AUDUSD?
In this case, falling yields reflected easing inflation stress rather than a collapse in growth expectations. That allowed the Aussie to benefit from better sentiment even as Australian bond yields moved lower.
How Important Are Iran Peace Talks For AUDUSD Right Now?
They matter a lot because they are shaping oil prices and overall risk appetite. Hopes that talks could resume in Pakistan helped push oil below $100 a barrel and supported the broader rally in risk assets and pro-cyclical currencies.
What Is Supporting The Aussie Beyond Global Risk Sentiment?
The rates backdrop is still helping. Markets continue to see the Reserve Bank of Australia as relatively firm compared with some peers, and the labour market has stayed resilient enough to keep yield support in the conversation.
Start trading now – Click here to create your real VT Markets account
Spot gold held around 4,841.76, while June gold futures rose 0.3% to 4,866.50.
The US dollar stayed near its weakest level in over a month, giving bullion extra support.
Traders now see roughly a 30% to 33% chance of a 25-basis-point Fed cut this year, up from around 13% last week, but still far below the two cuts that had been expected before the war.
Gold prices held close to a one-week high as traders waited for clearer direction from US-Iran diplomacy. Spot gold was steady at 4,841.76 per ounce, while June futures rose 0.3% to 4,866.50. The market had already rallied strongly into the session, then shifted into wait-and-see mode rather than extending the move immediately.
Central banks were buying gold at record levels. Here's why they're selling now https://t.co/d61M5P3Gyw
The price action reflects a market balancing two forces. Hopes for fresh talks in Pakistan have reduced some of the panic around the conflict, but they have not removed uncertainty around the Strait of Hormuz or the broader inflation shock that followed the war.
Soft Dollar Underpins Gains
The clearest support is coming from the currency side. The dollar stayed near its weakest level in more than a month, which made bullion cheaper for buyers using other currencies.
That has helped gold hold firm even as broader markets shifted into a more risk-on tone, with equities rising and oil pulling back on renewed talk of negotiations.
That matters because gold has not been rallying off pure fear alone. The move has also been driven by a weaker dollar and lower immediate pressure from oil. When both of those shift in gold’s favour at the same time, bullion can stay resilient even if the market is not fully defensive.
Rate-Cut Hopes Have Improved, but Only Slightly
Fed expectations have softened, though not enough to create a fully bullish rates backdrop for gold. Traders now see about a 30% to 33% chance of one 25-basis-point cut this year. That is up sharply from about 13% last week, but it is still well below the pre-war view that had allowed for two cuts in 2026.
Former Treasury Secretary and ex-Fed Chair Janet Yellen says she still sees prospects for a US rate cut later this year, though the unfolding oil shock caused by the war in Iran clouds the outlook https://t.co/JX9b4wLVe9
That leaves gold in a middle ground. Lower yields and a softer dollar can help, but the market still knows the Fed may stay cautious if energy-driven inflation proves sticky. March producer prices rose less than expected, yet the annual pace still reached 4.0%, the highest since February 2023, with gasoline up 15.7%, jet fuel up 30.7%, and overall energy prices up 8.5%. Services prices were unchanged, which helped limit the monthly upside surprise.
XAUUSD Technical Outlook
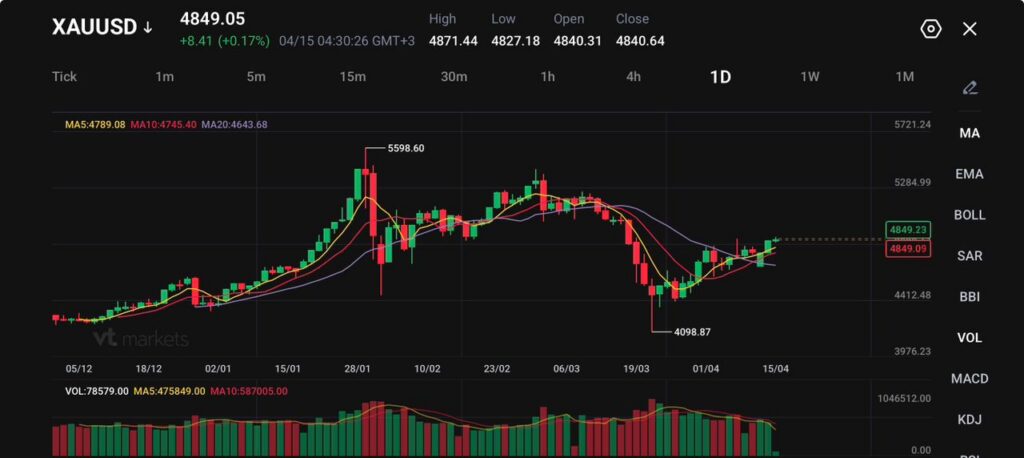
XAUUSD is trading near 4849, edging higher after rebounding from the recent swing low around 4098, with the price now stabilising in the mid-range of its broader structure.
The recovery has been steady rather than aggressive, suggesting buyers are regaining control, but without the same momentum seen in the earlier rally toward the 5598 peak. Price is now pressing into a short-term consolidation zone, hinting at a potential base forming.
From a technical standpoint, the structure is shifting back toward a bullish recovery phase. Price has moved back above the 5-day (4789) and 10-day (4745) moving averages, which are beginning to turn upward and provide immediate support.
The 20-day (4643) sits below as a stronger base, indicating improving short-term sentiment, while the broader trend remains constructive as long as higher lows continue to form.
Key levels to watch:
Support: 4780 → 4640 → 4410
Resistance: 4900 → 5050 → 5280
Gold is currently testing the 4900 resistance area. A clean break above this level could open the door toward 5050, with further upside potential if bullish momentum builds.
On the downside, 4780 is acting as immediate support. A break below this level may lead to a deeper pullback toward 4640, though this would likely remain corrective unless price slips back into the prior range.
Overall, XAUUSD is showing early signs of recovery within a broader consolidation, with buyers gradually stepping back in. The next move depends on whether the price can push through 4900 or stalls and rotates back into range.
What Traders Should Watch Next
The next move depends on whether talks with Iran produce anything durable and whether US inflation data gives the market room to lean more clearly toward easier policy.
If the dollar stays soft and diplomacy reduces oil pressure further, gold can keep holding near the weekly highs. If talks stall and inflation stays sticky, bullion may struggle to do much more than trade sideways in the high 4,800s.
Gold is staying firm because a softer US dollar has improved demand, while traders are still treating the Iran talks as unresolved rather than settled. Spot gold was recently around 4,841.76, after hitting its highest level since April 8 earlier in the session.
Why Does A Weaker Dollar Support Gold Prices?
Gold is priced in dollars, so a weaker dollar makes bullion cheaper for buyers using other currencies. That usually improves demand and helps support prices. The dollar was trading near its weakest level in more than a month during the move higher in gold.
Why Has Gold Stayed Strong Even Though Markets Look More Risk-On?
Gold has been getting support from the softer dollar and slightly better rate-cut expectations, even as equities rose and oil pulled back. That mix has allowed bullion to stay firm without needing a full flight-to-safety move.
What Are Traders Watching In The Iran Talks?
The market wants to see whether talks in Pakistan lead to a more durable de-escalation and a clearer path for normalising traffic through the Strait of Hormuz. Until that happens, traders are likely to keep some defensive demand in gold.
How Have Fed Rate Expectations Changed?
Traders now see roughly a 30% to 33% chance of one 25-basis-point Fed cut this year, up from around 13% last week. That is still much less dovish than the earlier expectation for two cuts before the war shock intensified.
Start trading now – Click here to create your real VT Markets account
NZD/USD traded near 0.5900 on Wednesday, with the New Zealand Dollar firming as global risk sentiment improved and the US Dollar weakened. The move followed softer-than-expected US Producer Price Index (PPI) data, which supported the view of easing inflation pressure.
Lower US yields added to USD softness. China’s latest trade figures failed to lift the pair during Asian hours, so early gains were capped before a rebound in the European session.
On the four-hour chart, NZD/USD held a bullish bias while consolidating above the 20-period Simple Moving Average (SMA) at 0.5860 and the 100-period SMA at 0.5784. The Relative Strength Index (RSI) was 69.2, just below overbought levels, pointing to strong momentum with scope for brief consolidation.
Resistance levels were noted at 0.5907, 0.5911 and 0.5920, with a further barrier at 0.5965. Support sat at 0.5899, then the 20-period SMA at 0.5860, with deeper support at the 100-period SMA at 0.5784.
The technical section was produced with assistance from an AI tool.
Given the bullish momentum pushing NZD/USD toward 0.5900, we see an opportunity driven by sustained US Dollar softness. The weaker Producer Price Index mentioned is now reinforced by the latest March 2026 US Consumer Price Index data, which came in at 2.8%, slightly below market expectations. This confirms the disinflationary trend and solidifies market pricing for a potential Federal Reserve rate cut in the third quarter of this year.
On the New Zealand side, fundamental support is growing beyond just general risk sentiment. Fonterra’s most recent Global Dairy Trade auction showed a solid 2.5% increase in whole milk powder prices, a key export for New Zealand. This provides a domestic reason for the Kiwi’s strength and suggests the currency is not just moving on external factors.
The broader market environment supports this view, with the VIX index recently dropping below 15, signaling a calm market and a greater appetite for higher-yielding currencies. This makes the NZD attractive for carry trades against lower-yielding currencies. We saw a similar dynamic in late 2025 when improved risk sentiment helped the pair climb from its lows, though it struggled to maintain momentum above the 0.6000 mark.
For the coming weeks, we believe buying call options with a strike price around 0.5950 is a direct way to capitalize on further upside. This strategy allows traders to benefit from a potential move toward the 0.5965 resistance level mentioned, while clearly defining the maximum risk to the premium paid. The high RSI reading near 70 suggests momentum is strong, which is favourable for option buyers.
However, considering the RSI also points to a nearly overbought condition, a more conservative strategy would be to implement a bull call spread. One could buy the 0.5900 call and simultaneously sell the 0.6000 call to finance the position. This caps the potential profit but significantly lowers the initial cost, offering a higher probability of success if the pair continues its gradual ascent.
Given the technical support levels, selling cash-secured puts with a strike near the 0.5850 level also appears viable. This area aligns with the 20-period moving average and would allow us to collect premium with the expectation that any pullback will be shallow. This strategy benefits from both a rising price and time decay, especially if the pair consolidates before its next leg up.
Written on April 15, 2026 at 4:24 am, by josephine
AUD/USD rose about 0.38% on Tuesday, reached near 0.7150, then pulled back to around 0.7120 after a sharp rejection at 0.7150. The pair has climbed from early-April lows near 0.6990, but it did not hold above 0.7150.
In Australia, Westpac Consumer Confidence fell 12.5% in April. China’s March imports rose 27.8% year on year versus an 11.1% consensus, while exports grew 2.5% against an 8.3% forecast.
Key upcoming data include Australia’s employment report on Thursday (consensus 20K) and China’s first-quarter GDP. These releases are set to affect near-term AUD moves.
In the US, March PPI rose 0.5% month on month versus a 1.2% consensus, while core PPI increased 0.1%. Headline PPI was 4.0% year on year, the highest since February 2023, with energy prices linked to the Iran conflict.
On the 15-minute chart, AUD/USD was 0.7126 versus a daily open of 0.7093, with Stochastic RSI at 25.35. On the daily chart, EMAs sit at 0.6981 (50-day) and 0.6761 (200-day), while Stochastic RSI is 81.10.
Looking back at the situation in April of last year, we saw a strong push in AUD/USD that ultimately failed around the 0.7150 level. That rally was fueled by a soft US Producer Price Index and hopes for Mideast peace talks, creating a headwind for the US dollar. This history of sellers defending that 0.7150 area is important context for our current trading.
The concerns over Australian consumer confidence we noted in 2025 have persisted, with households now feeling the pressure of the RBA’s subsequent rate hikes. Australia’s most recent quarterly CPI for Q1 2026 came in at 3.9%, which is still well above the central bank’s target and suggests policy will remain tight. This tight policy could limit significant further upside for the Aussie dollar, as it weighs on economic growth prospects.
China remains a crucial, though mixed, influence, much like it was last year when strong import data suggested robust demand. Recent data shows China’s official March 2026 Manufacturing PMI registered at 50.8, indicating a slight expansion that continues to support commodity prices and, by extension, the Australian dollar. This provides a fundamental reason to believe that dips in AUD/USD may find buyers.
On the US side, the dynamic has shifted from the PPI miss we saw in March 2025, which eased rate hike pressure back then. Today, the latest US CPI print for March 2026 was 3.1%, showing inflation is proving stubborn and keeping the Fed in a cautious, data-dependent mode. This stickiness in US inflation provides underlying support for the US dollar that was less apparent this time last year.
Given this backdrop, we should consider strategies that benefit from upward movement but also protect against a potential pullback. The overbought daily stochastic signal from last year serves as a good reminder that rallies can become exhausted. Therefore, buying call options on AUD/USD offers a way to participate in potential gains, while defining our maximum risk to the premium paid.
To manage the risk of another rejection from higher levels, using a bull call spread by selling a higher strike call against a purchased call could be a prudent approach. This strategy would lower the upfront cost of the position and profit from a modest rise, which aligns with the current mix of supportive fundamentals and persistent resistance. For downside protection on existing long positions, buying put options below key support levels, like the current 50-day moving average near 0.7010, would act as a valuable hedge against a sudden reversal.
Written on April 15, 2026 at 4:22 am, by josephine
USD/JPY fell about 0.4% on Tuesday and moved back below 159.00, ending near 158.85. It stayed within a two-yen range between 160.00 and 158.00, after failing near 159.30 and then bouncing from around 158.60.
The US Dollar weakened after the BLS said March PPI for final demand rose 0.5% month-on-month, below the 1.2% consensus. Core PPI increased 0.1% versus expectations of 0.6%, while petrol rose 15.7% and made up nearly half of the headline rise; services were flat.
The Dollar also softened after President Trump said peace talks with Iran could restart within two days. The Japanese Yen drew support from safe-haven demand linked to Middle East uncertainty, while BoJ policy played a smaller role.
On the 15-minute chart, USD/JPY traded at 158.83 and stayed below the day’s open at 159.21, with Stochastic RSI near 59. Resistance stood at 159.21, while the daily chart showed price at 158.84 above the 50-day EMA at 158.02 and the 200-day EMA at 154.56, with daily Stochastic RSI near 28.
Next US data include Initial Jobless Claims and the Philadelphia Fed Manufacturing Survey on Thursday. The technical analysis was produced with help from an AI tool.
We remember looking at this price action around April of last year, when USD/JPY was struggling to find direction inside a tight 158.00 to 160.00 range. That period of consolidation, marked by soft US inflation data, was a pause before the underlying trend reasserted itself. The divergence in central bank policy ultimately forced a breakout to the upside later in 2025.
Fast forward to today, April 15, 2026, the pair is trading near 168.50, demonstrating the powerful effect of the interest rate differential. The U.S. Federal Reserve’s key rate remains elevated at 5.3%, while the Bank of Japan’s rate is just 0.1%, creating a significant incentive for carry trades. This persistent gap has been the primary driver overwhelming other factors over the past year.
Unlike the surprising downside miss in the Producer Price Index we saw in March 2025, recent U.S. inflation has been stubbornly firm. The latest Consumer Price Index report for March 2026 showed a year-over-year increase of 3.5%, discouraging any thoughts of imminent rate cuts from the Fed. This backdrop suggests dollar strength will continue to be a dominant theme for the foreseeable future.
While geopolitics were a focus last year, the main risk now is direct intervention from Japanese authorities to strengthen the yen. We have heard repeated warnings from finance ministry officials about taking “decisive steps” against speculative currency moves. Historical interventions, such as those in late 2022, show that authorities can trigger sharp, multi-yen drops in the pair with no warning.
Given the high implied volatility from this intervention risk, traders should consider selling out-of-the-money puts to collect premium, betting that the strong underlying uptrend will provide support on any dips. To protect against a sudden plunge, pairing this with buying cheaper, further-dated puts creates a hedge against a sharp, intervention-driven reversal. This strategy aims to profit from the current upward momentum while respecting the significant tail risk from official action.
Written on April 15, 2026 at 3:59 am, by josephine
EUR/USD rose for a seventh session as the US dollar fell to a six-week low. The pair traded near 1.1790, up 0.30%, helped by expectations of possible US–Iran talks in the week ahead.
Reports said Donald Trump indicated talks could resume this week and said he opposed a 20-year suspension of Iran’s uranium enrichment. Energy prices kept falling, which can reduce cost pressure for the Eurozone, a net importer of crude and natural gas.
US producer inflation rose to 4% year on year in March, below the 4.6% forecast and up from 3.4% in February, according to the BLS. Core PPI was 3.8% year on year, unchanged, while the ADP Employment Change 4-week average rose to 39,250 from 26,000.
Market pricing shifted towards the Fed keeping rates unchanged this year, according to PMT. Chicago Fed President Austan Goolsbee said rate cuts could be delayed until 2027 if oil prices slow progress towards the 2% inflation goal.
ECB President Christine Lagarde said the ECB is well placed to handle Iran-related developments and warned against dismissing the shock too early. Upcoming releases include the Fed’s Beige Book, US policymaker speeches, Eurozone February industrial production, and comments from ECB members.
EUR/USD traded near 1.1793, above clustered 50-, 100- and 200-day SMAs around 1.1673 and supported by a rising trend line from 1.1411. RSI (14) was 64.8, with resistance linked to the 1.1929 area.
We recall the optimism in 2025 when EUR/USD pushed toward 1.1800, driven by hopes of US-Iran de-escalation. That sentiment has since been replaced by a focus on central bank policy divergence, which now dictates the market. The pair currently trades much lower, around 1.1250, reflecting this new reality.
The Federal Reserve’s hawkish stance, which was taking shape last year, remains the dominant force. The latest US Consumer Price Index reading for March 2026 came in at a persistent 3.1%, keeping it well above the Fed’s 2% target. This stubborn inflation, combined with a still-resilient labor market, has pushed expectations for a first rate cut deep into the third quarter of 2026.
Conversely, the European Central Bank has already begun its easing cycle, cutting its main deposit rate by 25 basis points in March 2026. Eurozone HICP inflation fell to 2.4% last month, moving much closer to its target and giving the ECB cover to act. This confirms the policy split that we see widening between the two central banks.
For derivative traders, this clear policy path suggests selling out-of-the-money EUR/USD call options or establishing bear call spreads. This strategy profits from the expected continued weakness or sideways movement in the pair, with defined risk. Implied volatility has decreased from the peaks seen during the 2025 Iran conflict, making option premiums for bearish positions more reasonably priced.
Looking ahead, we must closely monitor upcoming US core PCE data, as this is the Fed’s preferred inflation gauge. The CME FedWatch Tool currently shows markets are pricing in only a 20% chance of a rate cut before September 2026. Any data that shifts these probabilities will be the next major catalyst for the currency pair.
Written on April 15, 2026 at 3:57 am, by josephine
China’s March trade data came in slightly below expectations. Exports were weaker than forecasts, while imports rose sharply, which narrowed the trade surplus.
Imports increased by 27.8% year-on-year. The trade surplus declined, but remained high at $51.1 billion.
Current Account Balance Update
China’s current account surplus in Q1, relative to GDP, was estimated to be slightly lower than in Q4. In Q4, it reached a multi-year high of 4.9%.
The renminbi strengthened against the US dollar despite the weaker trade balance. USD/CNY traded below 6.82, its lowest level in more than three years.
Since the start of the month, the CNY rose by over 1% against the USD. The article states it was produced using an AI tool and then reviewed by an editor.
We recall that around this time last year, China’s trade data showed a narrowing surplus due to surging imports. Despite this, the yuan surprisingly strengthened against the dollar, with USD/CNY falling below 6.82. This move occurred even with rising uncertainty in global markets.
Market Implications For The Yuan
The situation today appears quite different, presenting a new set of opportunities. The most recent data for March 2026 shows China’s trade surplus actually expanded to $58.55 billion, but this was driven by a sharp 7.5% year-over-year fall in exports, which is a sign of weakening global demand. Unlike last year, the yuan has not strengthened; in fact, the USD/CNY is currently trading much higher, around the 7.23 mark.
This suggests the market is now more focused on China’s domestic economic headwinds and the policy divergence with the United States. We see persistent deflationary pressures and an embattled property sector weighing on sentiment, encouraging capital outflows. This contrasts with last year when optimism around China’s reopening seemed to support the currency.
Given this backdrop, traders should consider positions that benefit from further yuan weakness against the dollar. Buying USD/CNY call options or entering into long forward contracts could be an effective strategy to capitalize on this trend in the coming weeks. The clear pressure on the yuan suggests this direction is more probable than a repeat of last year’s strength.
Another approach involves trading volatility, as the People’s Bank of China will likely intervene to prevent a disorderly decline of the currency. This intervention can cause sharp, short-term price swings, making long volatility strategies like straddles potentially profitable. For those with existing exposure to Chinese assets, hedging currency risk by buying puts on the yuan is now critical.
South Korea’s import prices rose 18.4% year on year in March. This compares with a 1.2% rise in the previous period.
This massive jump in import prices, from 1.2% to 18.4%, is a major inflation signal that we cannot ignore. It suggests a significant cost-push shock is hitting the South Korean economy. The coming weeks will likely see the market price in a much more aggressive Bank of Korea.
Inflation Implications For Policy
This data forces the central bank’s hand, making future interest rate hikes almost a certainty to combat runaway inflation. With the latest consumer price index already running hot at 3.7%, well above the 2% target, the Bank of Korea will need to act decisively. We should anticipate a hawkish shift in their forward guidance immediately.
Given this, we see an opportunity in shorting Korean Treasury Bond (KTB) futures. As the market digests this inflationary pressure, expectations for higher rates will grow, pushing bond prices down. We remember from the rate hike cycle of 2022-2023 how quickly bond markets can reprice in these situations.
This also creates a compelling trade in the currency market, specifically going long the Korean Won. While high inflation is typically a negative, the prospect of aggressive rate hikes makes the Won attractive to carry traders seeking higher yields. A move in the USD/KRW exchange rate from its current 1345 level towards 1300 seems increasingly plausible.
For equity markets, this is a clear headwind, as higher import costs will squeeze corporate profit margins, especially for manufacturers. Buying put options on the KOSPI 200 index is a direct way to position for a potential market downturn. The combination of margin pressure and higher interest rates creates a difficult environment for stocks.
The primary driver for this import price shock appears to be energy, as WTI crude oil has surged past $95 a barrel in recent weeks. This external factor is not expected to fade quickly, giving this inflationary trend strong momentum. This makes our bearish view on bonds and equities more convincing.
Positioning For Higher Volatility
Overall market volatility is set to rise sharply following such a surprising data release. We can use options to position for these larger price swings across all asset classes. Establishing long volatility positions could be a prudent strategy to hedge against the increased uncertainty.