Germany’s GfK consumer confidence fell to -24.7, below the March forecast of -23.5
Germany’s GfK consumer confidence index was -24.7 for March. That was weaker than the expected -23.5.
This reading shows consumer sentiment is softer than forecast. The update did not include any other survey details.
EUR/GBP rises above 0.8700 as sterling weakens on looming UK political uncertainty, near 0.8725
EUR/GBP traded higher near 0.8725 in early European trade on Wednesday. It moved back above 0.8700 and snapped a three-day decline. The Pound weakened against the Euro ahead of UK political events. European Central Bank President Christine Lagarde is also scheduled to speak later on Wednesday.
A by-election will be held on Thursday in Manchester’s Gorton and Denton constituency to fill a vacant parliamentary seat. The vote comes as UK Prime Minister Keir Starmer faces rising tension within his party and low approval ratings.
Uk Political Risk And Sterling
In the US, the Supreme Court ruled on Friday against many tariffs introduced by President Donald Trump. On Saturday, Trump said he would add a further 15% tariff. On Monday, the European Parliament agreed to delay a vote on the EU–US trade agreement. Fresh trade tensions could weigh on the Euro, because the Eurozone is more exposed to trade disruption than the UK. Looking back at 2025, UK politics were a key driver of Sterling weakness. Attention on the Manchester by-election added uncertainty and helped push EUR/GBP above 0.8700. By-elections are often tough for the party in power. Since 2000, ruling parties have lost more than half of these contests. However, the larger risk is the renewed trade dispute between the US and the European Union. Similar tariff escalation in 2018 helped drive a drop of more than 5% in the Euro in a single quarter. Germany is especially exposed because its economy depends heavily on exports. This risk can limit how far EUR/GBP can rise.Volatility Outlook And Trading Approach
With these pressures pulling in different directions, the main expectation is higher volatility rather than a clear trend. One-week implied volatility for EUR/GBP is already rising, moving from an average of 5.5% to nearly 8% as traders price in these events. Derivatives traders may therefore look at strategies such as long straddles or strangles. These can profit from a large move either way and may suit a choppy market. Create your live VT Markets account and start trading now.Dividend Adjustment Notice – Feb 25 ,2026
Dear Client,
Please note that the dividends of the following products will be adjusted accordingly. Index dividends will be executed separately through a balance statement directly to your trading account, and the comment will be in the following format “Div & Product Name & Net Volume”.
Please refer to the table below for more details:
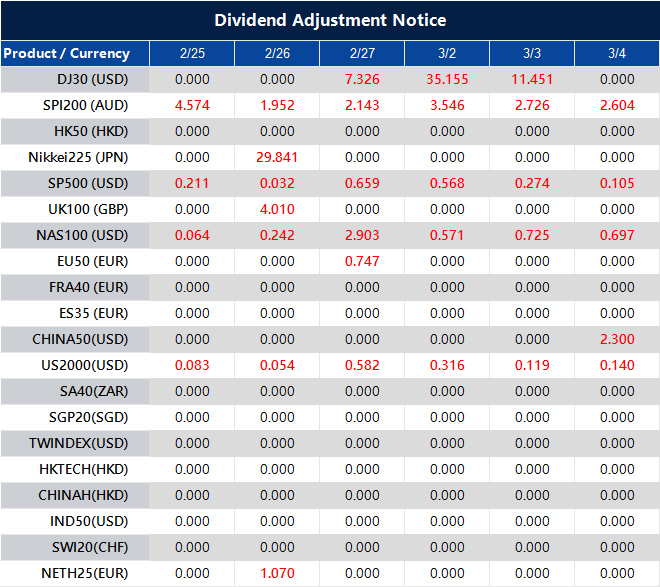
The above data is for reference only, please refer to the MT4/MT5 software for specific data.
If you’d like more information, please don’t hesitate to contact [email protected].
FXStreet data shows gold prices in the Philippines rose during Wednesday trading
Gold prices in the Philippines rose on Wednesday, based on FXStreet data. Gold was priced at PHP 9,588.53 per gram, up from PHP 9,555.42 on Tuesday.
Per tola, gold increased to PHP 111,838.70 from PHP 111,452.50 a day earlier. Other listed prices were PHP 95,885.27 for 10 grams and PHP 298,236.80 per troy ounce.
Philippine Gold Price Reference
FXStreet converts global gold prices into Philippine pesos using the USD/PHP exchange rate and local units. Prices are updated daily using market rates at the time of publication. These figures are for reference only, as local prices can differ. Gold has long been used to store value and as a form of payment. It is also widely used in jewellery. Demand often rises during market stress and when investors seek protection from inflation or a weaker currency. Central banks hold the most gold. World Gold Council data shows they bought 1,136 tonnes worth about $70 billion in 2022, the highest yearly total on record. Gold often moves in the opposite direction to the US Dollar and US Treasuries. It can also move against risk assets. Prices are shaped by geopolitics, recession fears, interest rates, and changes in the US Dollar, since gold is priced in dollars (XAU/USD).Market Outlook And Key Drivers
The recent rise in local gold prices is driven more by global markets than by domestic factors. It mainly reflects a mild pullback in the US Dollar. This inverse link between gold and the dollar will be important in the weeks ahead. Traders should watch US economic data closely, as it may set the next major move in gold. The market also appears to be moving past the high-rate environment that defined much of 2025. CME Group futures data suggests traders expect at least two Federal Reserve rate cuts before year-end. Lower expected rates reduce the cost of holding gold, which can support prices. Another key support is steady central bank buying, which helps put a floor under prices. In 2024, central banks added more than 1,037 tonnes—close to the 2022 record—and strong buying continued through 2025. This kind of demand suggests big pullbacks may be bought quickly by large institutions. Inflation and geopolitical risks also keep gold in focus as a safe haven. While the US Consumer Price Index has cooled from past peaks, it has struggled to drop below 3%. That keeps inflation concerns alive and supports gold as a hedge against currency weakness and unexpected global shocks. With this backdrop, volatility may rise, creating potential opportunities for options traders. Some may look at defined-risk strategies such as bull call spreads on gold futures or gold-linked ETFs. Timing will matter, especially around major US inflation releases and central bank updates in the near term. Create your live VT Markets account and start trading now.Gold prices in the United Arab Emirates rose today, according to FXStreet data
Gold prices in the United Arab Emirates rose on Wednesday, according to FXStreet data. Gold was priced at AED 611.76 per gram, up from AED 609.76 on Tuesday.
Gold rose to AED 7,135.46 per tola from AED 7,112.11 a day earlier. FXStreet also listed AED 6,117.61 for 10 grams and AED 19,027.92 per troy ounce.
How FXStreet Converts Global Prices
FXStreet converts global gold prices into AED using the USD/AED exchange rate and local units. Prices are updated daily at the time of publication and are for reference only. Local prices may vary slightly. Central banks are the biggest holders of gold. In 2022, they added 1,136 tonnes—worth about $70 billion—to their reserves. This was the highest yearly total on record, according to the World Gold Council. Gold is often seen as a store of value and is widely used in jewellery. Many investors also use it to help protect against inflation and currency weakness. Gold often moves in the opposite direction of the US Dollar and US Treasuries. It can also move against risk assets such as stocks.Market Drivers To Watch
The small rise in gold prices fits a broader trend. Markets are mainly focused on the Federal Reserve’s interest-rate policy. The Fed began cutting rates late last year in 2025. Lower rates reduce the cost of holding assets that do not pay interest, like gold, which can make gold more appealing. Another support for gold is the mild weakness in the US Dollar. As US interest rates fall, the dollar often softens against other major currencies. This matters because a weaker dollar makes gold cheaper for buyers using other currencies, which can lift global demand. Central-bank buying also provides strong long-term support. After record purchases in 2022 and 2023, the World Gold Council said central banks—especially in emerging markets—kept adding to reserves throughout 2025 at a fast pace. This steady demand suggests that sharp dips may attract strong buying interest. With ongoing geopolitical tension and uncertainty about the economic recovery, volatility in gold options may stay high. Traders may consider strategies such as bull call spreads to gain upside exposure while reducing option costs. Another approach is to sell out-of-the-money put spreads to collect premium, based on the strong demand that may support prices on declines. In the weeks ahead, key US inflation and employment reports will be important. If inflation stays high, the Fed could slow its planned rate cuts, which could temporarily pressure gold. Any pullback could still be seen as a possible entry point, as the broader trend remains supportive for gold. Create your live VT Markets account and start trading now.After Trump’s address, the US dollar slips, pulling USD/CHF to around 0.7730 and below 0.7750 in Europe
USD/CHF dropped below 0.7750 and traded near 0.7730 in early European trading on Wednesday. The move came as the US Dollar weakened against the Swiss Franc after Donald Trump’s annual State of the Union address to Congress. Swiss Q4 GDP and the US January Producer Price Index (PPI) are due on Friday.
In his speech, Trump described a “turnaround for the ages.” He focused on lower inflation, and on efforts to reduce illegal immigration and fentanyl at the border. He also said tariffs were “one of the main reasons” for the US economic shift, and called a US Supreme Court ruling on tariffs “unfortunate”.
Tariff Policy Uncertainty
Trump also talked about new 15% global tariffs under Section 122 of the Trade Act. He said they were “a little more complicated” and suggested they could lead to results “even stronger than before”. Continued uncertainty around US tariff policy has pressured the US Dollar. Markets are also watching US–Iran tensions ahead of nuclear talks in Geneva on Thursday. The US embassy in Lebanon evacuated “dozens of its staff members” on Monday. Any change in the dispute could affect demand for the Swiss Franc. This is similar to late February 2025, when the dollar fell sharply after President Trump’s speech. New ideas for global tariffs created major uncertainty and weighed on the dollar. As traders looked for the relative safety of the franc, USD/CHF fell below 0.7750. Tariffs then became one of the main themes of 2025. They helped drive ongoing dollar weakness and higher market volatility. Tensions with Iran also stayed in the background, keeping demand steady for safe-haven assets like the Swiss franc. This trend has continued, with the pair now trading near a multi-year low of 0.7520.Central Bank Expectations
Looking ahead, the key difference is what markets expect from central banks. January 2026 inflation data showed US core CPI holding at 2.9%, which makes it harder for the Federal Reserve to consider rate cuts. In Switzerland, inflation is still well below target at 1.3%, giving the Swiss National Bank (SNB) less reason to act aggressively. It is also important to watch how much strength in the franc the SNB will accept. The SNB has stepped in before to weaken its currency. SNB sight deposits, often used as a proxy for intervention, rose slightly in the latest reporting week. This suggests the SNB is watching current levels closely. If the franc strengthens sharply from here, the SNB could respond more forcefully. Because of this, traders may want strategies that can benefit from a slow move lower in USD/CHF, while also protecting against a sudden rebound. Buying put options gives downside exposure, but a bear put spread may be a better fit. This approach limits the maximum profit, but lowers the upfront cost and defines risk if the SNB steps into the market. Create your live VT Markets account and start trading now.FXStreet-compiled figures show Pakistan’s gold prices rose, increasing from the previous update.
Gold prices in Pakistan rose on Wednesday, according to FXStreet data. Gold was priced at **PKR 46,590.97 per gram**, up from **PKR 46,422.55** on Tuesday.
The price per tola increased to **PKR 543,428.00** from **PKR 541,463.60** a day earlier. Other listed rates were **PKR 465,909.70** for 10 grams and **PKR 1,449,138.00** per troy ounce.
Pakistan Gold Price Calculation
FXStreet calculates Pakistan gold prices by converting global prices using the **USD/PKR** exchange rate and local weight units. The figures are updated daily at the time of publication. They are meant as a reference, and local market prices may differ slightly. Central banks hold the largest gold reserves. According to the World Gold Council, they added **1,136 tonnes** (about **$70 billion**) in 2022—the highest annual total since records began. Gold often moves in the opposite direction to the **US Dollar** and **US Treasury yields**. It can also move differently from risk assets. Prices may change due to geopolitical news, recession worries, and interest-rate shifts, since gold is priced in US dollars. In today’s market, gold’s value as an inflation hedge looks more important. January inflation came in slightly above expectations, and the price pressures seen through 2025 may still be present. Because of that, holding long exposure through call options or futures can help protect against the steady loss of purchasing power.Key Market Drivers And Strategy
Central bank buying continues to support the market and help limit sharp sell-offs. The heavy buying seen in 2025—when central banks added more than **1,037 tonnes**—appears to be continuing, led by emerging markets that are diversifying away from the dollar. This steady demand suggests that sizable dips may offer entry points for traders. The **US Federal Reserve** also matters because gold does not pay interest. While rates remain high, markets are increasingly pricing in possible rate cuts later this year—an expectation that helped fuel rallies in late 2025. Traders may use options to position for upside swings if the Fed turns more dovish in the coming weeks. Gold’s inverse link with the US Dollar remains a key part of the outlook. A strong dollar has weighed on gold, but recent data suggests the dollar’s strength may be topping out. In late 2025, a weaker dollar clearly lifted gold prices, and that pattern could return. Geopolitical tensions are still a risk, which supports gold’s role as a safe-haven asset. Any sudden escalation could trigger a rush into safety and push prices up quickly. For that reason, keeping some long exposure—either directly or through derivatives—can be a sensible part of a diversified trading book. Create your live VT Markets account and start trading now.AUD/JPY stays above 110.00 after Australian CPI, rising for a second straight session in Asian trading hours
AUD/JPY rose for a second session and traded near 110.10 during Asian hours on Wednesday. The Australian Dollar gained after inflation data came in above forecasts. This lifted expectations of more Reserve Bank of Australia (RBA) rate hikes this year.
Australia’s Consumer Price Index rose 3.8% year-on-year in January. This matched the prior reading and beat the 3.7% forecast. CPI rose 0.4% month-on-month, down from 1.0% previously. The RBA’s Trimmed Mean CPI rose 0.3% month-on-month and 3.4% year-on-year.
Rba Governor Bullock Speech Watch
Traders will watch RBA Governor Michele Bullock, who is set to speak at a fireside chat at the Melbourne University Faculty of Economics & Business Foundation Dinner. The event will take place in Melbourne, Australia. The pair also gained as the Japanese Yen weakened. Mainichi Shimbun reported that Prime Minister Sanae Takaichi raised concerns about further rate rises in a meeting last week with Bank of Japan Governor Kazuo Ueda. Ueda said the meeting covered broad economic and financial issues, and that no specific monetary policy requests were made. Takaichi is known for pro-stimulus views, including looser fiscal policy and easier monetary settings. The report added uncertainty about the outlook for Bank of Japan rate hikes, even as markets speculate about further policy normalization later this year. This takes us back to this time last year, in early 2025. At that point, stronger-than-expected Australian inflation was pushing AUD/JPY toward 110.10. Markets expected more RBA rate hikes. At the same time, the Yen was weak, partly due to political pressure to keep stimulus in place. Together, these forces drove a strong uptrend in the pair.Changed Macro Backdrop
One year later, the macro picture looks very different. Australian inflation has eased. The latest January 2026 data shows annual CPI has fallen to 2.9%, which is back inside the RBA’s target band. As a result, markets are no longer pricing in RBA hikes. Instead, they are leaning toward a possible rate cut later this year. Japan has also changed since the political headlines of early 2025. The Bank of Japan exited negative interest rates late last year. With core inflation still firm at 2.4%, speculation is now about when the next hike will come. This shift has pulled AUD/JPY down, with the pair trading around 98.75 today. In the weeks ahead, this policy gap points to more downside risk in AUD/JPY. Traders may consider put options to benefit from a potential drop, especially if upcoming Australian wage data is weak. Under these conditions, a move toward the 97.00 support level from late 2025 looks possible. Implied volatility in AUD/JPY options shows this added uncertainty. As a result, long-volatility trades like straddles are expensive. A more targeted approach, such as a bear put spread, may be cheaper. This strategy involves buying a put at a higher strike and selling a put at a lower strike, which limits both the upfront cost and the potential profit. Create your live VT Markets account and start trading now.USD/CAD stays near monthly highs as traders await Trump’s State of the Union, leaving the Canadian dollar directionless
USD/CAD slipped slightly during Wednesday’s Asian session, but it stayed close to the monthly high set on Tuesday. The pair traded just under 1.3700, down 0.05%, as markets waited for a speech from US President Donald Trump.
Trump is set to deliver the first State of the Union address of his second term at 02:00 GMT. The speech is expected to focus on the economy and trade uncertainty. It will also cover Iran ahead of a third round of nuclear talks on Thursday.
Oil Prices Support The Canadian Dollar
Worries about a possible US military strike on Iran lifted crude oil prices ahead of the talks. Higher oil prices supported the Canadian dollar and capped gains in USD/CAD. At the same time, hawkish comments from several Federal Reserve officials kept the US dollar firm, just below its highest level since 23 January, reached last week. This helped limit further declines in USD/CAD. In the North American session, markets are expected to respond to more remarks from Fed officials. Traders are also waiting for a clear break from last week’s range before expecting a stronger near-term move. Looking back a year to early 2025, USD/CAD was stuck near 1.3700. The main driver was geopolitical uncertainty, with traders focused on a State of the Union address and updates on US-Iran nuclear talks. The pair stayed range-bound as hawkish Fed comments offset rising oil prices.Policy Divergence Drives The Trend
By February 2026, the focus has shifted away from speeches and toward hard data and central bank policy. The key difference is that the Bank of Canada cut interest rates last month to 4.75% due to a cooling economy, while the Federal Reserve has kept its benchmark rate unchanged. This widening policy gap supports the US dollar versus the loonie. Oil’s role has also changed from the sharp geopolitical risk premium seen in 2025. WTI crude is now steady near $85 per barrel, supported more by coordinated OPEC+ production discipline than by fears of an imminent conflict. This stability helps underpin the Canadian dollar, but it has not been strong enough to offset the interest-rate-driven trend. Given this backdrop, derivative strategies should focus on the widening policy gap. Consider buying USD/CAD call options to position for more upside, as recent US inflation data suggests the Fed is unlikely to cut rates soon. A bull call spread may be a more cost-effective way to express this view while limiting premium costs, especially with the pair trading near 1.3850. Create your live VT Markets account and start trading now.With US crude inventories rising, WTI hovers near $66 as traders closely watch US-Iran developments
West Texas Intermediate (WTI), the US crude oil benchmark, traded near $66.05 in early Asian trading on Wednesday. Prices slipped after a sharp jump in US crude stockpiles. The Energy Information Administration (EIA) report is due later on Wednesday.
The American Petroleum Institute (API) said US crude stockpiles rose by 11.4 million barrels in the week ending February 20. The prior week showed a drop of 609,000 barrels. This increase added to supply worries.


