FXStreet-compiled figures show Pakistan’s gold prices rose, increasing from the previous update.
Gold prices in Pakistan rose on Wednesday, according to FXStreet data. Gold was priced at **PKR 46,590.97 per gram**, up from **PKR 46,422.55** on Tuesday.
The price per tola increased to **PKR 543,428.00** from **PKR 541,463.60** a day earlier. Other listed rates were **PKR 465,909.70** for 10 grams and **PKR 1,449,138.00** per troy ounce.
AUD/JPY stays above 110.00 after Australian CPI, rising for a second straight session in Asian trading hours
AUD/JPY rose for a second session and traded near 110.10 during Asian hours on Wednesday. The Australian Dollar gained after inflation data came in above forecasts. This lifted expectations of more Reserve Bank of Australia (RBA) rate hikes this year.
Australia’s Consumer Price Index rose 3.8% year-on-year in January. This matched the prior reading and beat the 3.7% forecast. CPI rose 0.4% month-on-month, down from 1.0% previously. The RBA’s Trimmed Mean CPI rose 0.3% month-on-month and 3.4% year-on-year.
Rba Governor Bullock Speech Watch
Traders will watch RBA Governor Michele Bullock, who is set to speak at a fireside chat at the Melbourne University Faculty of Economics & Business Foundation Dinner. The event will take place in Melbourne, Australia. The pair also gained as the Japanese Yen weakened. Mainichi Shimbun reported that Prime Minister Sanae Takaichi raised concerns about further rate rises in a meeting last week with Bank of Japan Governor Kazuo Ueda. Ueda said the meeting covered broad economic and financial issues, and that no specific monetary policy requests were made. Takaichi is known for pro-stimulus views, including looser fiscal policy and easier monetary settings. The report added uncertainty about the outlook for Bank of Japan rate hikes, even as markets speculate about further policy normalization later this year. This takes us back to this time last year, in early 2025. At that point, stronger-than-expected Australian inflation was pushing AUD/JPY toward 110.10. Markets expected more RBA rate hikes. At the same time, the Yen was weak, partly due to political pressure to keep stimulus in place. Together, these forces drove a strong uptrend in the pair.Changed Macro Backdrop
One year later, the macro picture looks very different. Australian inflation has eased. The latest January 2026 data shows annual CPI has fallen to 2.9%, which is back inside the RBA’s target band. As a result, markets are no longer pricing in RBA hikes. Instead, they are leaning toward a possible rate cut later this year. Japan has also changed since the political headlines of early 2025. The Bank of Japan exited negative interest rates late last year. With core inflation still firm at 2.4%, speculation is now about when the next hike will come. This shift has pulled AUD/JPY down, with the pair trading around 98.75 today. In the weeks ahead, this policy gap points to more downside risk in AUD/JPY. Traders may consider put options to benefit from a potential drop, especially if upcoming Australian wage data is weak. Under these conditions, a move toward the 97.00 support level from late 2025 looks possible. Implied volatility in AUD/JPY options shows this added uncertainty. As a result, long-volatility trades like straddles are expensive. A more targeted approach, such as a bear put spread, may be cheaper. This strategy involves buying a put at a higher strike and selling a put at a lower strike, which limits both the upfront cost and the potential profit. Create your live VT Markets account and start trading now.USD/CAD stays near monthly highs as traders await Trump’s State of the Union, leaving the Canadian dollar directionless
USD/CAD slipped slightly during Wednesday’s Asian session, but it stayed close to the monthly high set on Tuesday. The pair traded just under 1.3700, down 0.05%, as markets waited for a speech from US President Donald Trump.
Trump is set to deliver the first State of the Union address of his second term at 02:00 GMT. The speech is expected to focus on the economy and trade uncertainty. It will also cover Iran ahead of a third round of nuclear talks on Thursday.
Oil Prices Support The Canadian Dollar
Worries about a possible US military strike on Iran lifted crude oil prices ahead of the talks. Higher oil prices supported the Canadian dollar and capped gains in USD/CAD. At the same time, hawkish comments from several Federal Reserve officials kept the US dollar firm, just below its highest level since 23 January, reached last week. This helped limit further declines in USD/CAD. In the North American session, markets are expected to respond to more remarks from Fed officials. Traders are also waiting for a clear break from last week’s range before expecting a stronger near-term move. Looking back a year to early 2025, USD/CAD was stuck near 1.3700. The main driver was geopolitical uncertainty, with traders focused on a State of the Union address and updates on US-Iran nuclear talks. The pair stayed range-bound as hawkish Fed comments offset rising oil prices.Policy Divergence Drives The Trend
By February 2026, the focus has shifted away from speeches and toward hard data and central bank policy. The key difference is that the Bank of Canada cut interest rates last month to 4.75% due to a cooling economy, while the Federal Reserve has kept its benchmark rate unchanged. This widening policy gap supports the US dollar versus the loonie. Oil’s role has also changed from the sharp geopolitical risk premium seen in 2025. WTI crude is now steady near $85 per barrel, supported more by coordinated OPEC+ production discipline than by fears of an imminent conflict. This stability helps underpin the Canadian dollar, but it has not been strong enough to offset the interest-rate-driven trend. Given this backdrop, derivative strategies should focus on the widening policy gap. Consider buying USD/CAD call options to position for more upside, as recent US inflation data suggests the Fed is unlikely to cut rates soon. A bull call spread may be a more cost-effective way to express this view while limiting premium costs, especially with the pair trading near 1.3850. Create your live VT Markets account and start trading now.With US crude inventories rising, WTI hovers near $66 as traders closely watch US-Iran developments
West Texas Intermediate (WTI), the US crude oil benchmark, traded near $66.05 in early Asian trading on Wednesday. Prices slipped after a sharp jump in US crude stockpiles. The Energy Information Administration (EIA) report is due later on Wednesday.
The American Petroleum Institute (API) said US crude stockpiles rose by 11.4 million barrels in the week ending February 20. The prior week showed a drop of 609,000 barrels. This increase added to supply worries.
Geopolitical Tensions And Market Focus
Traders also watched US-Iran news ahead of nuclear talks on Thursday in Geneva. On Monday, the US embassy in Lebanon evacuated “dozens of its staff members” as a precaution. US President Donald Trump said last week he was considering a limited military strike on Iran to push for a nuclear deal. He said 10 to 15 days was “pretty much” the “maximum” time he would allow talks to continue. The EIA report could move prices if it shows a draw or a build in inventories. A bigger-than-expected draw may signal stronger demand. A larger build may point to weaker demand or added supply. With WTI now trading near $82 a barrel, the market is still reacting to last week’s unexpected inventory news. The EIA reported a 3.5 million barrel increase for the week ending February 20, which put downward pressure on prices. This has led many traders to question near-term demand, especially with fears of a slowing global economy.Options Strategies For A Two Sided Market
We saw a similar clash between fundamentals and geopolitics around this time in 2025. The API reported a huge 11.4 million barrel build, which suggested a supply glut. At the same time, the market was nervous about rising US-Iran tensions ahead of planned nuclear talks. This sets up a classic push and pull, which makes simple directional trades risky over the next few weeks. One possible approach is to buy volatility using options strategies like straddles or strangles. These trades can benefit from a large price move in either direction, whether the driver is inventory data or geopolitical headlines. In the past, when geopolitical threats did not lead to real supply disruptions, large inventory builds tended to pull prices lower. After the inventory concerns in early 2025, prices eased once the immediate Iran fears faded. Because of this, buying puts with expiries a few weeks out may help hedge against bearish supply data coming back into focus. Create your live VT Markets account and start trading now.PBOC fixes USD/CNY at 6.9321 vs 6.9414 prior, diverging from Reuters’ 6.8824 estimate
The People’s Bank of China set the USD/CNY central rate for Wednesday at 6.9321. This compares with Tuesday’s fix of 6.9414 and a Reuters estimate of 6.8824.
The People’s Bank of China aims to keep prices stable, including the exchange rate. It also works to support economic growth and push financial reforms, such as opening and developing financial markets.
Pboc Governance And Policy Mandate
The PBoC is state-owned and is not viewed as independent. The Chinese Communist Party Committee Secretary, nominated by the Chairman of the State Council, helps shape management and policy direction. Pan Gongsheng holds both that post and the governor role. The PBoC uses several policy tools. These include the seven-day reverse repo rate, the Medium-term Lending Facility, foreign exchange intervention, and the reserve requirement ratio. The Loan Prime Rate is China’s main benchmark rate. It influences loan, mortgage, and deposit rates, and it can also affect the Renminbi exchange rate. China has 19 private banks. The largest are digital lenders WeBank and MYbank, backed by Tencent and Ant Group. Regulators first allowed privately funded domestic banks in 2014. Today’s stronger yuan fixing signals that the PBoC wants to guide the currency higher, but not as fast as the market expects. The central bank appears to be managing the pace to avoid sharp, disruptive moves. This slow, controlled strengthening is an important signal for our strategy in the weeks ahead.Implications For Usdcny Trading Strategy
This move follows stronger-than-expected export data for January 2026, showing exports up 4.5% year over year. That naturally puts upward pressure on the yuan. Foreign direct investment also turned positive in Q4 2025—the first net inflow in more than a year—adding to demand for the currency. The PBoC is likely trying to limit excessive strength so it does not undermine the export recovery. For derivatives traders, this points to low-to-moderate volatility in USD/CNY. Strong central-bank guidance can limit big swings, making sudden spikes less likely. In this kind of environment, selling volatility—such as with short strangles—may work well, since the pair may stay within a managed range. The 2025 experience is a useful guide. Early bursts of yuan strength often triggered official pushback once the move reached key psychological levels. The current stance looks similar. It suggests a gradual rise in the yuan rather than a breakout rally. Because of this, any outright long-yuan positions should be managed tightly, with profits taken as the currency nears important technical levels. A softer US Dollar Index also supports this setup. The index has drifted down to around 101.5 after the Federal Reserve held rates in January. It is easier for the PBoC to guide the yuan higher when the dollar is not rising broadly. This global backdrop supports the view that USD/CNY is more likely to drift moderately lower. With that in mind, we see value in selling out-of-the-money call options on USD/CNH to collect premium. The idea is that the PBoC will likely limit any large dollar rallies against the yuan. This approach benefits from both a slowly strengthening yuan and lower volatility. Overall, positioning should favor a steady, managed appreciation rather than a sudden revaluation. Create your live VT Markets account and start trading now.US Dollar Index Declines Amid Tariff Uncertainty
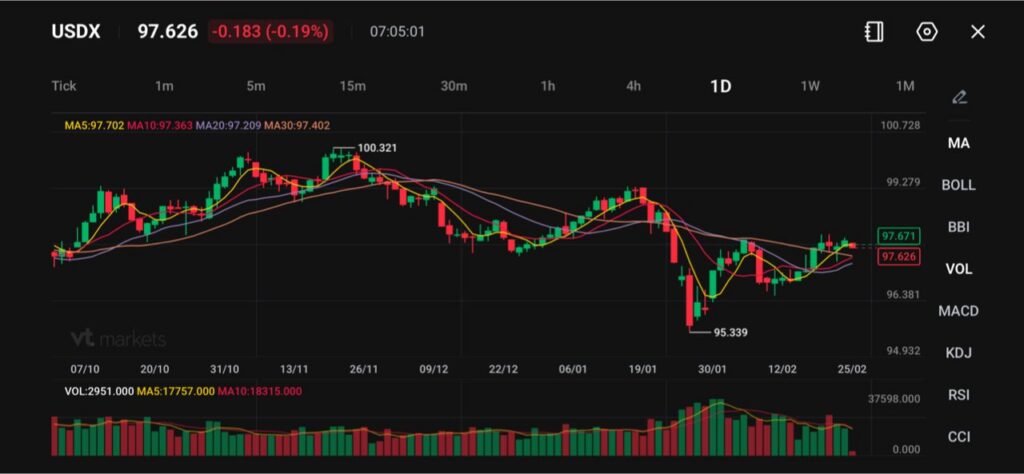
The US Dollar Index (USDX) fell beneath 97.8 on Wednesday, surrendering a portion of the prior session’s advance as renewed doubts over trade policy weighed on the currency.
During his State of the Union speech, President Donald Trump gave no signal that tariff measures would be relaxed. Instead, he voiced confidence that overseas governments would comply with trade agreements and floated the idea that tariffs might ultimately substitute income taxes.
This week, the United States introduced a temporary 10% universal tariff, with reports suggesting the White House intends to increase it to 15%. The move follows the Supreme Court’s decision to strike down Trump’s reciprocal tariff proposal.
The absence of clear policy direction has injected additional volatility into foreign exchange markets.
Federal Reserve Policy Outlook And Implications For The Dollar
Recent remarks from Federal Reserve officials continue to support a pause in interest rate adjustments.
Susan Collins indicated that keeping rates at current levels appears appropriate in light of a strengthening US labour market and lingering inflation concerns.
Thomas Barkin similarly remarked that monetary policy is suitably calibrated to address prevailing economic risks.
Nevertheless, markets are still pricing in roughly three quarter-point reductions this year, creating a disconnect between central bank guidance and investor expectations.
This gap is restraining any sustained upward momentum in the dollar.
Technical Analysis
The Dollar Index is presently trading at 97.626 (-0.19%), positioned close to its short-term moving averages.
Key technical levels:
MA5: 97.702
MA10: 97.363
MA20: 97.209
MA30: 97.402
Price action remains capped beneath the psychologically significant 98.00 mark. Immediate resistance is located around 99.30, with the 100.32 swing high beyond that.
On the downside, first support is seen at 96.38, while stronger support stands at 95.34, the recent trough.
A sustained move below 97.00 may accelerate bearish momentum towards the 96.00 area.
The Impact Of Tariffs On The US Dollar
Trade-related uncertainty is once again emerging as a structural headwind for the currency.
Elevated tariffs can:
– Restrict global trade activity
– Intensify domestic inflationary pressures
– Complicate the Federal Reserve’s timeline for rate reductions
Although tariffs might, in theory, underpin the dollar through higher inflation and interest rates, inconsistent policy signals tend to undermine investor confidence, prompting diversification away from US-denominated assets.
US Dollar Outlook: What Lies Ahead For USDX?
The US Dollar Index remains confined within a range, though downside risks persist.
In the near term, a move above 98.00–98.50 would indicate a revival in bullish momentum, while a decline beneath 96.50 could open the path towards the 95.30 low.
The next meaningful directional trigger is likely to stem from US inflation data, labour market data and tariff clarity.
Unless forthcoming economic data strongly reinforces the case for postponing rate cuts, the dollar may find it difficult to establish a durable upward trend.
For the moment, USDX appears caught between trade policy uncertainty and the Federal Reserve’s cautious stance.
China-led liquidation pushes XAG/USD lower for a second session, trading near $87.20 per ounce
Silver (XAG/USD) fell for a second straight session. It traded near $87.20 during Asian hours on Wednesday after dipping toward $87.00. The drop followed heavy selling in China, tied to the unwinding of leveraged positions and a pullback in retail speculation.
The Shanghai Futures Exchange tightened delivery rules and set delivery allocations to zero for many traders without approved hedging quotas. Silver also came under pressure from a stronger US Dollar, which makes it more expensive for buyers using other currencies.
China Liquidation And Positioning
Demand signals are mixed. Some solar manufacturers are switching from silver to copper to cut costs. At the same time, the market is still running a structural supply deficit, now heading into its sixth straight year. Demand from AI and electric vehicle sectors continues. Chinese domestic prices also traded at about a 10% premium, suggesting local tightness that is not fully reflected in global prices. Policy news added uncertainty. President Donald Trump said duties would rise to 15% after a Supreme Court decision limited his emergency tariff powers. The US also imposed a 10% tariff on all non-exempt goods. Markets are watching for Trump’s State of the Union address ahead of US–Iran nuclear talks on Thursday. The market is still absorbing the impact of last year’s large China-led liquidation. That selloff came from the rapid unwind of leveraged speculative positions on the Shanghai exchange, showing how fast sentiment can change. While the speculative excess is mostly gone, open interest in SHFE silver contracts has rebounded about 35% from the lows. This points to a return of more stable, long-term participants. The shift from silver to copper in solar production remains a headwind, but it may be slowing. Newer N-type solar cell technology is more than 25% more efficient and requires more silver, which partly offsets the substitution trend. This supports longer-term demand, especially as the global structural deficit is now officially in its seventh consecutive year.Macro And Strategy Outlook
The macro backdrop looks different from last year’s tariff disputes. The US Dollar Index has eased from its 2025 highs, down nearly 4%, as the Federal Reserve has signaled a clear pause in its tightening cycle. A softer dollar can support dollar-priced silver by improving affordability for overseas buyers. With mixed signals, derivatives traders may look at strategies that can work in a range while still leaving room for upside. One approach is selling cash-secured puts below the current price, such as around $85, to collect premium while setting a potential entry level. Another is using long-dated call spreads to target gradual gains, driven by ongoing supply deficits and rising demand from EV and AI industries. Create your live VT Markets account and start trading now.ABS data showed Australia’s January CPI inflation held at 3.8% year on year, above the 3.7% forecast
Australia’s CPI rose 3.8% year-on-year in January, according to the ABS. This was slightly above the 3.7% forecast and unchanged from the prior 3.8%. Monthly CPI was 0.4% in January, down from 1.0% previously.
The RBA trimmed mean CPI rose 0.3% month-on-month and 3.4% year-on-year in January. After the release, AUD/USD was up 0.23% to 0.7077.
Inflation Surprise And Market Reaction
Before the release, CPI was expected to come in at 3.7% year-on-year. Trimmed mean inflation was forecast at 3.3%. AUD/USD was trading near 0.7100. The RBA’s inflation target is 2–3%. In its February Statement on Monetary Policy, the RBA assumed about 60 basis points of rate hikes this year. Markets had priced nearly 39 basis points of tightening and expected the cash rate to hold at 3.85% in March. The RBA forecast growth of 2.1% by June. It also forecast trimmed mean inflation at 3.7% by mid-year, and core inflation at 2.6% by mid-2028. Headline inflation was projected to peak at 4.2%, partly due to the expiry of electricity rebates. Iron ore is Australia’s largest export, worth about $118 billion a year in 2021. Technical levels cited for AUD/USD include 0.7147, 0.7157, 0.6897, 0.6821, 0.6687, 0.6663, and 0.6605, with RSI above 62 and ADX near 43.Implications For Rates And Trading
January inflation came in a touch hotter than expected, at 3.8%. This suggests the disinflation we saw in late 2025 has paused for now. As a result, the case strengthens for the Reserve Bank of Australia (RBA) to keep a cautious, hawkish stance in the months ahead. This report also backs up the RBA’s recent message that policy may not be restrictive enough. With trimmed mean inflation still elevated at 3.4%, there is little reason for the central bank to consider easing. Markets may now more seriously price in the chance of at least one more rate hike by mid-year. The labour market also remains very tight. The latest data shows the unemployment rate holding at 3.8% in January. A strong job market often supports wage growth and consumer demand, which can make it harder to push core inflation down quickly. This resilience gives the RBA more room to keep rates high, or even lift them further. External conditions are also turning more supportive for the Australian dollar. Recent trade data from China, Australia’s largest trading partner, showed a surprise rise in factory orders. This helped push iron ore prices back above $135 per tonne. Strong commodity demand like this is a fundamental tailwind for the AUD. For derivatives traders, this points to several possible approaches. One way to position for higher rates is to sell Australian government bond futures, since bond prices typically fall when markets price in a more hawkish RBA. With inflation proving sticky, rate cuts before year-end look less likely. In FX, AUD/USD looks supported around 0.7077. Buying AUD/USD call options with a strike near 0.7150 could be a lower-cost way to target more upside. Implied volatility may rise ahead of the next RBA meeting, which could also support long-volatility strategies. Create your live VT Markets account and start trading now.After Australian inflation data, AUD/USD ticks slightly higher but remains rangebound as focus shifts to Trump’s speech
AUD/USD rose slightly after Australia released inflation data, but it stayed within the range seen over the past two weeks. The pair traded near 0.7075–0.7080, up more than 0.20% on the day. Focus now shifts to President Donald Trump’s State of the Union address.
The speech comes after renewed uncertainty around US tariffs. Some measures were struck down by a Supreme Court ruling last week. Markets are also watching for any mention of Iran. The risk of a US military strike could change demand for the safe-haven US Dollar and the risk-sensitive Australian Dollar.
Australian Inflation Supports Rba Stance
Australia’s ABS said the Consumer Price Index rose 3.8% year on year in January. This was above the 3.7% forecast and matched the previous month. That supports the Reserve Bank of Australia’s hawkish stance. The US Dollar held on to the previous day’s small gains and remained close to last week’s monthly peak. This could limit further upside in AUD/USD. In early 2025, AUD/USD traded in a tight range near 0.7080, helped by strong Australian inflation. A year later, conditions have changed. The pair is now much lower, near 0.6550, as other economic factors have taken over. The specific Iran-related geopolitical risks that shaped sentiment at that time have since eased. Today’s fundamentals also look different from 2025. Australian CPI has cooled slightly to 3.4% as of January 2026, while US inflation remains firm at 3.1%. This has allowed the US Federal Reserve to keep rates high at 5.50%. That is a clear yield advantage over the Reserve Bank of Australia’s 4.35% cash rate, and it has pressured the Aussie dollar over the past year.Low Volatility Options Setup
For derivatives traders, recent volatility has been low, with the VIX hovering near 14. When volatility is low, options are often cheaper. This can make it easier to position for a potential move. Buying protection or taking a directional view may cost less than it would in more turbulent markets. Because the interest rate gap continues to favour the US Dollar, traders may consider buying AUD/USD put options. This offers a defined-risk way to benefit if the pair falls further. With options relatively inexpensive, this can be a cost-effective way to position for a break below recent support in the weeks ahead. It is also important to watch upcoming employment data from Australia and the US. These releases can be major catalysts. They could quickly end the recent calm and bring volatility back into the market. A long straddle—buying both a call and a put—may be a sensible way to target a large move in either direction, no matter how the data comes out. Create your live VT Markets account and start trading now.Australian construction work done fell an unexpected 0.1% in the fourth quarter, missing forecasts of a 0.8% rise
Australia’s construction work done was expected to rise by 0.8% in the fourth quarter. Instead, it fell by 0.1%.
This drop in construction work in Q4 2025 is a clear warning sign for the Australian economy. It isn’t a minor miss. It suggests a major driver of growth weakened sharply going into this year. As a result, the Q4 GDP figures due in early March are now more likely to miss forecasts, which could put downward pressure on the Australian dollar.


