S&P 500 Holds Ground As Market Awaits Nvidia Results

The S&P 500 hovered just under the 5930 level on Wednesday, trading sideways after bouncing back from a session low of 5855.05. Market participants remained cautious ahead of Nvidia’s eagerly awaited earnings release. A glance at the 15-minute chart reveals that price movements have narrowed into a tight band between 5922 and 5934, with momentum indicators such as the MACD suggesting a waning bullish impulse.

Following Tuesday’s rally, which saw Nvidia’s share price surge more than 4% on optimism surrounding AI-related revenue growth, market sentiment has turned more restrained. Traders are now looking for confirmation that Nvidia can meet the lofty expectations. According to LSEG estimates, the company is forecast to post a 66.2% increase in first-quarter revenue, reaching $43.28 billion.

In the broader macro landscape, US consumer confidence figures came in stronger than expected, lending support to the US dollar and putting a cap on equity valuations as bond yields steadied. The dollar index climbed a further 0.25%, building on Tuesday’s 0.6% advance, while the euro dipped to $1.1304. Yields on longer-dated US Treasuries paused after recent gains, offering temporary respite to equity investors wary of valuation pressure.

Technical Analysis

The SP500 rebounded sharply from the 5855.05 low on 27 May, surging over 80 points to test resistance near 5934.70 in early 28 May trading. The recovery was driven by strong bullish candles with price action lifting above all three moving averages (5, 10, 30), signalling short-term bullish momentum. However, the rally stalled near the prior peak, with the price now consolidating just below resistance.
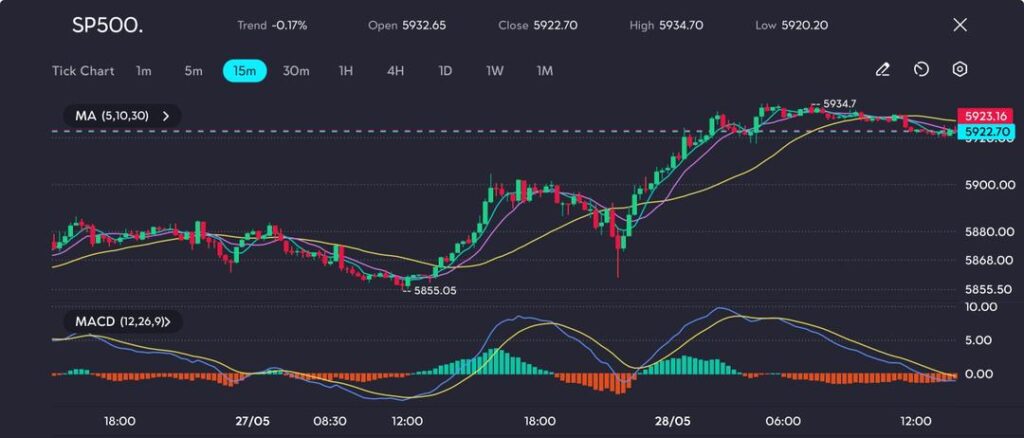
 SP500 rallies from 5855 to 5935 peak before stalling; momentum fades near resistance as bulls pause, as seen on the VT Markets app

The MACD shows waning bullish momentum, with histogram bars shrinking and the MACD line approaching a potential bearish crossover. If support at 5920 holds, a second leg higher is possible. Otherwise, a break below the 30-MA could expose the 5900–5890 region for a retest.

Measured Outlook

The next decisive move in the S&P 500 will likely be determined by Nvidia’s results. A strong earnings beat could ignite a rally toward the 5950–5970 region, whereas a disappointment might prompt a drop below the 5900 mark.

With bond market volatility easing and key economic data remaining resilient, the downside risk appears contained in the short term, but a clear catalyst is needed for further upside. For now, the mood remains one of cautious optimism.

Open a live trading account with VT Markets today and take advantage of market opportunities.

Kazuo Ueda, Governor of the Bank of Japan, expresses uncertainty over ongoing tariff negotiations and data monitoring.

Bank of Japan Governor Kazuo Ueda highlighted that many tariff negotiations are still ongoing, which creates uncertainty in the market. He stressed the importance of closely monitoring data but did not discuss short-term interest rate changes. The USD/JPY pair fell 0.27%, trading at 143.93. The Bank of Japan, as the country’s central bank, is responsible for setting monetary policy and maintaining price stability, aiming for an inflation target of about 2%.

The BoJ’s Monetary Strategy

Since 2013, the BoJ has maintained an ultra-loose monetary policy to boost the economy. This included measures like Quantitative and Qualitative Easing and negative interest rates. However, in March 2024, the bank raised interest rates, marking a shift from this approach. These policies caused the Yen to weaken against other currencies. This trend worsened in 2022 and 2023 but began to reverse in 2024 as the BoJ adapted its policies to rising inflation rates and wages. Higher global energy prices and a declining Yen have led to increased inflation in Japan. The BoJ’s decision to adjust its policy was a response to inflation consistently surpassing the 2% target. Ueda’s recent statements, combined with currency market reactions, reveal that the Bank of Japan’s changes are not just symbolic. Although he did not provide clear guidance on short-term interest rates, his focus on economic data suggests slower, more thoughtful responses ahead. These changes will rely on both domestic price trends and ongoing international trade negotiations.

Market Response and Future Projections

The Japanese Yen has begun to slip against the US Dollar, decreasing by nearly 0.25%. While this isn’t a significant drop, combined with Ueda’s cautious remarks, it indicates that markets are recalibrating. After years of decline, the Yen showed signs of reassessing its value in response to the rate increase in March. This hike was more than just a technical adjustment; it marked a shift from over ten years of supportive measures like negative rates and heavy asset purchases. These policies kept the Yen weak against other global currencies, boosting export competitiveness but leading to higher import costs, especially for energy. With rising global oil and gas prices in late 2022, Japanese consumers felt the financial strain. Increased local wages added further pressure. As a result, inflation exceeded the BoJ’s 2% target, prompting action in March. Now that the BoJ is setting the stage for a more traditional monetary policy, we should view price changes in Japan as trend indicators rather than just anomalies. This policy shift isn’t the end but the beginning; future moves will depend heavily on consumer price trends, wage growth, and global conditions—particularly Japan’s energy dependencies. For those involved in rate-sensitive investments, especially derivatives, the focus should be on the implied trajectory rather than immediate changes. The pace may remain slow, but the overall direction is crucial. Policy changes will be driven by data, and persistent inflation suggests a movement away from previous norms in the longer term. Short-term changes in the USD/JPY will reflect expectations for future movements more than immediate economic data. Given the current situation, we can expect the narrative around interest rate differences, which weakened the Yen over the past three years, to diminish if Japan continues its normalization. As rate gaps close, currency pairs often react sharply. Investment strategies should account for this potential change without trying to predict exact timing. Short gamma exposure linked to JPY could see increased volatility soon as traders anticipate BoJ actions throughout the year. The key question will be whether the central bank maintains its cautious approach or accelerates changes due to domestic pressures. Until then, market premiums remain undervalued in light of the changes underway. Create your live VT Markets account and start trading now.

here to set up a live account on VT Markets now

John Williams, New York Federal Reserve Bank president, aims to prevent persistent inflation

The President of the Federal Reserve Bank of New York highlighted the need to keep inflation expectations stable to avoid long-term inflation problems. He stressed the importance of reacting strongly when inflation goes off target to prevent lasting damage. Currently, the US Dollar Index is a bit lower, sitting at 99.50. The Federal Reserve affects the US Dollar through its monetary policy. By adjusting interest rates, it aims to achieve price stability and full employment.

The Federal Reserve Monetary Meetings

The Fed has eight monetary policy meetings each year to review the economy and make decisions. One tool they use in times of crisis is Quantitative Easing (QE), which increases credit flow by buying bonds, potentially weakening the US Dollar. On the other hand, Quantitative Tightening (QT) means stopping bond purchases, which usually helps strengthen the US Dollar. These strategies are crucial for keeping the economy stable and managing inflation expectations. The New York Fed President’s comments remind us of the central bank’s priorities and responses. If inflation expectations stray too far from the target, it can affect the labor market, spending, and investment. He believes that acting promptly when inflation veers off course is essential—it’s not just about predicting perfectly but about preventing entrenched price pressures. With the US Dollar Index around 99.50, there’s a sign of some weakness. Traders might notice this, especially since a weaker dollar can influence various economic strategies, especially those linked to currencies. This softening is likely due to minor adjustments in rate expectations or overall sentiment rather than sudden events.

Impact Of The Federal Reserve

Historically, the Federal Reserve impacts the dollar mainly through interest rates. An increase attracts capital, while a decrease often pushes it away. This pattern also holds when rates stabilize. Since there are only eight Federal Open Market Committee (FOMC) meetings each year, each one is important—every statement and projection is quickly analyzed and integrated into the market. It’s also important to consider quantitative tools beyond just rate changes. When credit is abundant, like during QE, the dollar typically weakens because there’s more liquidity. Past QE periods often led to a lower dollar, especially when other countries weren’t expanding their balance sheets at the same rate. Conversely, QT, where the Fed reduces its bond holdings, usually supports the dollar by tightening liquidity and potentially raising yields. The Fed does not operate independently. Current inflation pressures might not come from straightforward models or only domestic issues. Recent comments indicate that the Fed intends to be proactive, even amid uncertainty. There is little patience now for allowing inflation to run too hot for too long. As a result, we can expect sensitivity across interest rate products and foreign exchange futures as the market adjusts its predictions. Breakevens and yields will likely be the first to react. The front end will especially respond quickly if the Fed changes its outlook or if economic data surprises positively. In these situations, making directional trades on rate changes can be tricky unless timed closely with data releases or policy announcements. Instead, relative value strategies might work better. For example, monitoring euro-dollar or dollar-yen implied volatilities for discrepancies, or looking at spreads between Fed Funds futures and SOFR contracts. Small changes in short-term expectations can shift rapidly—in both directions. The focus on “anchoring” inflation expectations shows that policymakers won’t rush to loosen policy. Even if growth slows or there are tough labor reports, unless there’s clear evidence of inflation decreasing sustainably, calls for rate cuts might not be addressed. A practical approach in the coming weeks could be examining options positioning around ranges identified by historical volatility, especially for shorter terms. This could benefit traders who are hesitant to make bold moves in flat markets but still want to be involved in potential shifts. Macro data remains a key factor. While CPI reports, core PCE, and employment figures may not tell the whole story alone, when combined with recent Fed speeches, they become more influential. Create your live VT Markets account and start trading now.

here to set up a live account on VT Markets now

USD/CAD rises above 1.3800 during Asian session as focus shifts to FOMC minutes

Crude Oil’s Effect on CAD

The USD/CAD is showing slight gains around 1.3805 in early Wednesday trading. This rise is partly due to a boost in the US Consumer Confidence Index for May, which increased to 98.0, lending strength to the US Dollar. Market attention is on the FOMC Minutes set to be released later today. Additionally, the Canadian Q1 GDP report is expected this Friday, with a decline forecasted to 1.7% YoY, down from 2.6%. In April, US Durable Goods Orders dropped by 6.3%, which was better than the predicted 7.9% decline. The President of the Federal Reserve Bank of Minneapolis suggested keeping interest rates steady for a clearer view of inflation related to tariffs. Declining crude oil prices have impacted the CAD since Canada is the US’s largest oil supplier. A decrease in oil prices generally weakens the Canadian Dollar’s value. The Bank of Canada’s interest rates, oil prices, and the country’s economic health strongly influence the CAD. A stronger economy usually supports the CAD, which can lead to higher interest rates. Macroeconomic data such as GDP, PMIs, and job statistics affect the CAD’s trajectory. A robust economy tends to strengthen the Canadian Dollar, while weak data may lead to depreciation.

The US Economy and the Canadian Dollar

During early Wednesday trading, the USD/CAD pair is holding modest gains at around 1.3805, supported by unexpectedly strong US consumer confidence for May, which rose to 98.0. This boost seems to have invigorated the greenback as traders evaluate American households’ outlook. Later today, we will see the Federal Reserve’s meeting minutes, which could reveal their current stance on interest rates and economic risks. Although no major shifts are expected, any mention of longer-term inflation concerns could push rate expectations higher. We will scrutinize this closely. This Friday, we are expecting Canada’s GDP report for the first quarter. The forecast predicts a slowdown to 1.7% YoY from 2.6%. If the actual result is worse than expected, it may prompt investors to anticipate a higher chance of policy easing from Canada, which could weigh on the Canadian Dollar. Oil prices have also become a concern. The recent decline in crude prices has put pressure on Canada’s currency. Since Canada is a significant oil exporter—especially to the US—a continued drop in oil prices usually undermines the CAD against the USD. While the decrease may not be drastic, it is important not to overlook its effect on short-term currency movements. Last month, US durable goods orders decreased by 6.3%, which was less than the expected drop of 7.9%. This decline indicates some hesitation in capital investment, likely due to uncertainty about interest rates. Still, the better-than-expected result added some strength to the dollar. A comment from the Minneapolis Fed President suggested keeping interest rates steady for now, given the uncertainty surrounding how tariffs might affect prices. This approach highlights how closely policymakers are focused on core inflation drivers. As we assess the balance between declining Canadian growth signals and resilient US data, we also monitor where rate expectations are heading. Current mild growth in the US and less severe data provide a reason for dollar bulls to remain active. We should prepare for potential price reactions this week. The Canadian GDP report and any surprises from the Fed minutes could lead to adjustments in interest rate forecasts. Consequently, carry-sensitive strategies might react more than usual. It’s also crucial to keep an eye on PMI updates and job data to maintain a solid position this quarter. Until we see significant changes in inflation or job market conditions, central bank caution is likely to persist, which often favors range-bound trading. We are focusing on both growth trends and the correlation with oil trading. If GDP falls short and crude prices continue to decline, the CAD could face short-term pressure. Conversely, any unexpected dovish comments from the Fed could create opportunities for a short-covering rally for the loonie. During these short-term periods, liquidity may be low, making precise entries and exits even more important. Overall, the combination of weakening Canadian indicators and a sustained USD suggests that buying on dips may be a favored strategy for this currency pair in the coming days. However, any trades should be accompanied by clearly defined risks in case sentiment shifts abruptly due to policy or data surprises. Create your live VT Markets account and start trading now.

here to set up a live account on VT Markets now

Investors regained confidence, causing the Dow Jones Industrial Average to rise nearly 750 points.

Consumer Sentiment Rebounds

The Consumer Board’s May survey shows a significant boost, rising 12.3 points to reach 98.0. This is a recovery from a four-year low of 85.7. The positive trend in consumer confidence comes as fewer people expect a recession within the next year. The Dow Jones climbed nearly 750 points, breaking above the 200-day Exponential Moving Average to hit 42,250. While this is below its high of 42,800, market patterns indicate growing momentum. The Dow Jones Industrial Average is a crucial US stock index that tracks the 30 most traded stocks. It is calculated based on stock prices, with influences from company earnings, economic data, and Federal Reserve interest rates.

Market Response to Tariff Delay

Dow Theory, created by Charles Dow, analyzes stock market trends by comparing the Dow Jones indices. You can trade the DJIA through various methods including ETFs, futures, options, and mutual funds. Recently, markets have reacted in a familiar way to political changes, especially regarding tariffs. After Trump postponed a 50% tariff on EU imports that was set to start in June, we saw a market rally. This delay is now in effect until at least July 9. Such news typically triggers quick reactions, and this is reflected in the Dow’s bounce. It’s important to focus not just on headlines, but on whether these delays become a trend. Historically, these postponements don’t always mean the end of tensions. Traders with leveraged long positions might be tempted to take risks based on temporary relief, but caution is advisable. Remember, temporary relief can turn back into tension quickly if new announcements come. The rise in stock prices isn’t solely tied to geopolitical events. The Consumer Confidence Index’s jump of 12.3 points to 98.0 is also significant. This rebound could lead to increased consumer spending, as lower recession fears suggest a positive shift in sentiment. When analyzing such data for trading, it’s crucial to use reliable methods. If we take the Dow crossing above its 200-day Exponential Moving Average seriously—which we should—momentum aligns with the improved confidence. However, this doesn’t mean all risk has vanished; it simply indicates a new baseline. Traders involved with DJIA-related derivatives should protect against near-term volatility, especially before the tariff deadline. The move towards 42,250 is promising, even if it’s still below the recent high of 42,800. However, this upward movement isn’t guaranteed. Price-weighted indices can show exaggerated gains based on a few strong performers, which may falter just as easily. Managing spreads, stops, and position size is crucial right now. For those trading DJIA through futures or options, implied volatility is a key factor. As significant economic reports and trade decisions approach—like the July 9 deadline—price changes can accelerate. Longer contracts, especially those dated for August, may start to factor in inflation expectations if inflation data keeps rising. Sudden market shifts can happen if traders are overly focused in one direction. We observed that broader options premiums increased slightly after the confidence report, indicating that volatility sellers are becoming cautious. This suggests market participants expect some fluctuations, though not extreme ones. It’s not about reacting in panic—it’s about being flexible in trading strategies. Now is not the time to guess where markets *should* go. Instead, focus on where they currently stand and consider what needs to happen for stability. Recent macro data, policy changes, and index trends all suggest a short-term direction, but short trends can change quickly. Those using Dow Theory should watch not just the industrials but also the transport index. If both indicate the same direction, it might be wise to consider longer-term trades. Otherwise, using short-term positions backed by volatility forecasting tools may be the safer choice. Remember, the methods we choose to trade this index—whether futures spreads, leveraged ETFs, or vertical options structures—should match the upcoming deadline in July. After that, tariff policy changes could alter the market again. It’s better to prepare for re-entry than to hold onto early profits too long. Create your live VT Markets account and start trading now.

here to set up a live account on VT Markets now

The Nasdaq 100 rally continues, reaching record highs and showing significant gains since April.

The NASDAQ100 index has experienced impressive growth, climbing over 25% since early April predictions. Last week, it reached a peak of $21,483, then fell to $20,778, and is currently trading at $21,378, which aligns with earlier forecasts. Utilizing the Elliott Wave method has effectively tracked these market movements.

Market Predictions

We are now in the orange W-5 phase, anticipating further developments. The expectation is for the index to reach $22,000 before possibly dropping to $21,000, then rising again to between $22,400 and $22,900. This forecast hinges on maintaining levels above $20,778, especially above $20,613. Additionally, NZD/USD is moving towards 0.6000 after a rate cut by the RBNZ. USD/JPY has fallen to 144.00 following recent comments from Japan. Gold continues its rise towards $3,300 due to geopolitical tensions, while Bitcoin shows promise from significant institutional buying, with $2.9 billion entering ETFs. Trading foreign exchange carries high risks, including the potential loss of the entire investment. It’s essential to understand these risks and plan carefully before engaging in forex trading. The NASDAQ100 has had an extraordinary rise since April, surpassing 25%. It peaked at $21,483 last week, then fell to $20,778 before bouncing back to $21,378. These fluctuations align closely with earlier analyses based on the Elliott Wave theory, which continues to guide our projections. Currently, we’re in the fifth orange wave, suggesting slowing momentum but still potential for growth. We are looking for a push above $22,000, serving as a key psychological and technical target. This could lead to sellers stepping in and driving prices back down to $21,000, possibly to balance the market. If that happens, we could see upward momentum again, targeting the $22,400–$22,900 range. Maintaining levels above $20,778 is vital for this outlook. If we slip below $20,613, the bullish scenario could be at risk.

Global Market Trends

Considering this, tread carefully with derivative positions linked to the NASDAQ100 in the upcoming sessions. Using risk-defined strategies that favor upward movement—with planned exits below key support levels—can capitalize on current market structures while protecting against overexposure if the fifth wave underdelivers. In other markets, NZD/USD shows weakness after New Zealand’s recent rate cut. While the path to 0.6000 is not straightforward, it reflects interest rate shifts in the FX market. This could also signal opportunities for carry trades with limited downside risk if dovish trends continue. The decline of USD/JPY to 144.00, influenced by comments from Japan, highlights sensitivity to verbal cues. This recent drop indicates traders expect a more responsive stance from Tokyo. Shorting on rallies could provide advantages, especially if more signals from Japanese officials arise. Gold is moving deliberately, driven by increased geopolitical risks pushing prices to $3,300. Strong demand supports this upward trend, making it wise to stay aligned with it, particularly on pullbacks that stay above previous breakout levels. Bitcoin has attracted $2.9 billion into ETFs, indicating serious interest from major investors ready to jump in. This capital flow deserves attention—not for hype but for strategic positioning. Continuous inflows could adjust what seem like stretched levels higher. Synthetic long positions with controlled downside exposure could be beneficial if buying stays strong. Remember, leverage in forex and derivatives is a double-edged sword. Terms like “support” or “confirmation” don’t matter without proper position sizing and exit strategies. Always prioritize risk management before pursuing market accolades. Create your live VT Markets account and start trading now.

here to set up a live account on VT Markets now

Pressure increases on the Australian dollar as the US dollar strengthens before important data releases

The Australian Dollar (AUD) is struggling against the US Dollar (USD) due to the USD’s recent strength and mixed economic data from the US. After hitting a six-month high of 0.6537, the AUD/USD has fallen below 0.6500, affected by both technical factors and shifts in economic sentiment. The Federal Reserve’s aggressive stance contrasts with the Reserve Bank of Australia’s cautious approach, which supports the USD. The market is looking forward to Australia’s April Consumer Price Index (CPI) report, which is expected to show a drop in annual inflation to 2.3% from 2.4%. A decrease in CPI could lead to further rate cuts by the RBA.

Federal Open Market Committee Meeting

The minutes from the Federal Open Market Committee Meeting are also anticipated. They may provide insights into the Fed’s future policies amid rising inflation. The exchange rate could struggle to rise without support from domestic factors, and it risks dropping further if it falls below the 0.6450 level. Higher interest rates in any country typically strengthen its currency because they attract international investment. For gold, rising interest rates increase holding costs, which can decrease its price since it’s traded in US Dollars. The Fed funds rate reflects US interbank lending rates and influences market expectations of Federal Reserve policies. Recently, we have seen a shift away from the Australian Dollar, primarily due to the continued strength of the US Dollar, supported by strong US economic data and expectations that US interest rates will stay high for an extended period. The Federal Reserve shows no signs of easing its policies and has adopted a more restrictive tone in its communications. This has led to rising US bond yields and a clearer expectation of tighter monetary conditions as the year progresses. In contrast, Australia’s inflation outlook is becoming softer. A slight drop in April’s CPI might suggest that the RBA could become more accommodating, rather than restrictive. If the CPI reading reaches 2.3% year-on-year, it would come closer to the RBA’s target range, indicating that the urgency to keep high rates may have passed.

Interest Rate Proxies And Carry Trades

For traders involved in interest rate proxies or relative rate positioning, this divergence in rates carries significant implications. When central banks move in opposite directions, carry trades become more appealing. With the Fed likely to hold rates steady while the RBA may ease if the data supports it, the odds favor the US Dollar. The RBA’s more cautious stance makes the Australian Dollar more vulnerable, particularly if risk appetite decreases. There’s also notable friction around the 0.6450 support level for AUD/USD. If this level is broken, downward movement may accelerate. We should monitor this level closely, as it could act as a rebound point or trigger further declines. When markets cross key psychological thresholds, they often react swiftly due to stop orders and momentum algorithms. The upcoming release of the Fed meeting minutes is another critical data point that may reveal the sentiment within the central bank. Although it looks backward, we should watch for signs of ongoing discussions among committee members about inflation persistence or hesitance to cut rates in the near future. Markets will likely try to pinpoint timing for any eventual easing, but unless the tone is noticeably softer than recent comments, it is unlikely to shift the trend for the US Dollar. At the same time, keeping an eye on gold’s response to these interest rate expectations can provide useful insights. Rising yields have already diminished gold’s attractiveness, leading to steady outflows from gold-related exchange-traded products. For those trading precious metals, the cost of holding a non-yielding asset increases with each rise in real yields. As the Fed’s funds rate and longer-term yields increase, gold becomes less appealing. Thus, gold’s pricing often reflects real-time market confidence in central bank policies. The key takeaway is that interest rate differences matter, especially when shaped by diverging policy paths. Traders involved in instruments sensitive to rate expectations, such as FX forwards, rate swaps, and options linked to cross-currency spreads, should remain alert to new inflation data and updates from central banks. External risk events, especially surprising US data, will have a significant impact on positioning over the next two weeks. We will closely monitor changes in market depth and open interest across FX and rates products to catch early signs of shifting sentiment or momentum. These moments of volatility can present both opportunities and risks, especially when trends align with the fundamental divergences already underway. Create your live VT Markets account and start trading now.

here to set up a live account on VT Markets now

The British pound falls from a three-year high, now trading at approximately 1.3510 against the US dollar.

The British Pound (GBP) has dropped against the US Dollar, moving away from a three-year high. Currently, the GBP/USD pair is trading at around 1.3510. This fall follows a period of stability in the US Dollar, fueled by hopes for a quick US-EU trade agreement. On Tuesday, during North American trading, the GBP fell to approximately 1.3540 against the USD. This comes after a peak of around 1.3600 the previous day, which was a three-year high, as confidence grew in a potential US-EU trade deal.

Pound Remains Above Key Support Levels

Even with this dip, the GBP/USD is still above 1.3550, close to the 39-month high of 1.3593 reached on Monday. This stability is due in part to a weakened USD, as worries over US debt issues increase risk appetite. Although the Pound has retreated from its three-year high, traders are adjusting their expectations based on new political and economic signals. The strong gains over the past few weeks by the Pound show resilience despite the recent dip to around 1.3510. This drop seems more like a minor adjustment rather than a major trend shift, influenced by external factors. The stabilizing US Dollar, especially due to hopes for a swift resolution to trade matters between the US and EU, has given support to the greenback. Speculation around international trade—particularly a renewed focus on improving US-EU relations—has reduced demand for riskier currencies, which has pressured GBP/USD from its earlier high of 1.3600. Earlier in the month, the Dollar had weakened amid uncertainty surrounding fiscal policy in Washington. Despite this dip, prices are still above the 1.3500 level, indicating that demand for Sterling remains at lower levels. It’s not just about the numbers; the speed of the price changes and the ability to hold above minor support levels are crucial. For traders, this area could indicate whether the recent rise still has support or is merely attracting speculative interest.

Possible Market Reactions to New Data

If short-term profits have been made in the last two weeks of rising momentum, we could see forced selling if the pair decreases further. A drop below 1.3480, for example, might lead to a reevaluation of trades, especially those taken after Christmas. However, unless new macroeconomic news drives demand for the USD, the lack of movement below key support levels could revive interest in the GBP. Senior policymakers on both sides of the Atlantic are encouraging a more stable approach to economic cooperation. Should these discussions lead to tighter alliances or reduced trade barriers, the USD could benefit more broadly—especially since markets remain cautious about potential US fiscal issues. Ongoing debates about debt ceilings and budgets continue to be a concern but have not yet sparked major panic. For now, holding above 1.3550 opens possibilities for upward movement, although recent momentum has slowed. If this stabilization lasts through the week, it may be wise to consider cross-hedging strategies or steps to neutralize directional risks. Keeping an eye on options data—especially heavy positioning around 1.3500 or 1.3450—could reveal larger market players looking to defend those levels. Monitoring volume during the overlap of London and New York trading will also be beneficial. So far, liquidity appears thinner during upward movements, suggesting that participants may prefer to wait before making major trades. This correction doesn’t automatically indicate a broader directional change, but strong US economic news could put pressure on short positions as month-end approaches. Regardless of how this trend unfolds, staying attentive to underlying yields, trade outcomes between major economies, and fiscal guidance from Washington will be essential. The likelihood of a sharp decline remains low without new triggers, but positioning fluctuations could amplify price movements. Timing around key data like NFP or inflation reports will be particularly significant, especially if there’s a gap between forward guidance and actual data. Create your live VT Markets account and start trading now.

here to set up a live account on VT Markets now

The auction for the United States 2-year note yielded 3.955%, up from the previous 3.795%

The recent auction for U.S. 2-Year Notes had a yield of 3.955%, up from the previous 3.795%. Like all investments, these notes carry risks and uncertainties, so it’s essential to do thorough research before making any decisions. NZD/USD rose above 0.5950 after the Reserve Bank of New Zealand (RBNZ) cut the policy rate by 25 basis points to 3.25%. Market participants are looking forward to more insights from Acting Governor Hawkesby during his press conference.

Japanese Market Developments

USD/JPY shifted back towards 144.00, influenced by market comments and supply factors from Japan. The yen saw a rebound after statements from BoJ Governor Ueda and Finance Minister Kato, which raised concerns about the bond market. Gold prices increased to $3,300, driven by geopolitical tensions between Russia and Ukraine, U.S. fiscal issues, and expected Federal Reserve rate cuts. These same factors hindered the U.S. Dollar’s recovery and bolstered gold’s status as a safe-haven asset. Ripple’s XRP is currently trading sideways around $2.33 after reaching highs of $2.65 recently. Market sentiment is still influenced by Bitcoin’s recent all-time high, creating potential for future shifts.

Auction And Interest Rate Expectations

In the latest 2-Year U.S. Treasury auction, yields rose to 3.955%, a significant increase from 3.795%. This change reflects growing investor expectations about interest rates and stable inflation concerns in the short term. This shift indicates a steeper short-end curve, which may influence pricing mechanics in the market. Traders should consider this adjustment when assessing short-duration volatility, as it establishes a more stable foundation for near-term discounting activity. Generally, when yields go up, it suggests increased economic confidence or a withdrawal from other safe assets, but in this situation, it mainly indicates changing rate forecasts. The Reserve Bank of New Zealand’s decision to lower its policy rate by 25 basis points to 3.25% affected the NZD/USD, driving it above 0.5950. This move was expected, not due to surprise but because the market thought policymakers might hesitate to cut rates so soon. Upcoming remarks from Hawkesby could provide more clarity on the Bank’s inflation outlook, but the immediate reaction suggests that forex participants see the NZD weakness as part of a broader trend toward policy normalization among smaller economies. In the coming days, movements in AUD/NZD and related pairs may show how market makers are pricing these shifts in yield. For USD/JPY, the pair’s turn near 144.00 corresponds with developments in Tokyo, where comments from Ueda and Kato raised concerns about the domestic bond market and yield curve control. The yen’s recent strength is driven by commentary rather than actions, showing how delicate sentiment can be in this pair. Traders should stay aware of potential rate divergences, especially if demand for Japanese debt weakens due to bigger auction sizes or local pension adjustments. At the same time, gold jumped to $3,300, influenced by various factors including ongoing geopolitical unrest in Eastern Europe, persistent U.S. fiscal challenges, and expectations of Federal Reserve easing soon. This context is particularly significant because when rate-cut expectations rise, real yields usually drop, making non-yielding assets like gold more appealing. A pause in the U.S. dollar’s recovery adds further support to gold, reinforcing the inverse relationship between the dollar and precious metals. As these trends continue, gold option pricing may show an increased likelihood of upward moves, especially if volatility in rates begins to impact commodities more broadly. XRP is trading around $2.33, indicating a pause in momentum after reaching $2.65. This halt appears more technical than driven by sentiment. Overall excitement in the crypto market, largely due to Bitcoin’s recent peak, still supports alternative assets, though the current consolidation could signal short-term distribution among leveraged positions. If Bitcoin maintains its high prices, we may see renewed activity in paired tokens like XRP. Currently, implied volatility on XRP remains steady, but any new news—legal or regulatory—could lead to sharp changes in open interest and pricing from the options market. Right now, macro events are creating clearer moments for price analysis across various instruments. As activity tends to cluster around significant macro catalysts, participants should carefully review correlation trends to understand how sensitivities may shift in the upcoming pricing cycle. Create your live VT Markets account and start trading now.

here to set up a live account on VT Markets now

New Zealand dollar weakens against US dollar below 0.5950 as RBNZ rate decision approaches

The New Zealand Dollar (NZD) is declining against the US Dollar (USD) after failing to break the important 0.6000 mark. The US Dollar is bouncing back as market conditions stabilize, especially after easing trade tensions between the US and EU. Currently, NZD/USD is trading around 0.5945. The USD has gained ground since Memorial Day, fueled by a strong Consumer Confidence report. In May, the Consumer Confidence Index rose from 85.7 in April to 98, indicating increased optimism among US consumers. This has led to a drop in the NZD/USD pair.

Reserve Bank of New Zealand Decision

The Reserve Bank of New Zealand (RBNZ) is set to announce its interest rate decision soon. The market expects a 25-basis-point cut, lowering the rate to 3.25%. This announcement, along with the Monetary Policy Statement, could create market fluctuations. The US Federal Open Market Committee (FOMC) will also release minutes from its recent meeting, which may shed light on the Fed’s monetary policy. This information could impact expectations for potential rate cuts in September. The value of the NZD depends on New Zealand’s economic performance, central bank policies, the state of the Chinese economy, and dairy prices. In strong economic times, the RBNZ may raise rates, boosting the NZD. Conversely, weak economic data might decrease its value. Typically, favorable market conditions strengthen the NZD, while uncertainty can weaken it. Recent movements in the NZD/USD pair show a strong resistance at the 0.6000 level, suggesting caution in the market. Currently, the price is around 0.5945, reflecting a shift in market sentiment. This change is largely due to positive data from the US. Specifically, US Consumer Confidence jumped to 98 in May, up from April’s 85.7. This significant increase indicates that US households feel more optimistic about their financial future. As a result, traders are more inclined to invest in the USD. Whenever US data shows improvement, especially amid uneven global growth, the dollar tends to rise—and we see that happening again.

Focus On Interest Rate Policies

Attention is now turning to the RBNZ’s upcoming rate decision. Expectations suggest a rate cut of 25 basis points, bringing rates to 3.25%. For traders in derivatives, it’s crucial to pay attention to what the markets have already anticipated. Given the widespread expectation for a cut, any surprises in the tone or future rate guidance in the statement could have a more significant impact than the actual rate change. On the US side, we are also awaiting the release of the latest FOMC minutes. These could reveal how unified policymakers were during their recent decisions and whether later rate cuts remain feasible or depend on inflation metrics. Timing is key in assessing rate expectations—the potential pivot point of September is not just a theoretical idea. The markets are already adjusting, and the tone of these minutes could influence currency trading conditions. The overall value of the NZD continues to track familiar patterns: we keep an eye on New Zealand’s economic progress, any developments in China’s economy, and global dairy demand. In the past, strong demand for dairy products has supported the NZD. However, weakness in these exports can create downward pressure. Today’s market environment shows a strong preference for safety, which often favors the USD. The sensitivity of the NZD means that even minor news from China or drops in global commodity prices can lead to significant price changes, especially if the market is already imbalanced. Traders should watch for guidance from both Washington and Wellington while being ready to adapt their strategies. Create your live VT Markets account and start trading now.

here to set up a live account on VT Markets now

Back To Top
server

Hello there 👋

How can I help you?

Chat with our team instantly

Live Chat

Start a live conversation through...

  • Telegram
    hold On hold
  • Coming Soon...

Hello there 👋

How can I help you?

telegram

Scan the QR code with your smartphone to start a chat with us, or click here.

Don’t have the Telegram App or Desktop installed? Use Web Telegram instead.

QR code