Today’s gold prices in Pakistan increased, according to recent data and market trends.
Gold prices in Pakistan rose on Tuesday, according to FXStreet data. The price per gram went up to 45,489.42 Pakistani Rupees (PKR) from 45,425.48 PKR the day before. The price for one tola increased to 530,584.40 PKR, up from 529,833.90 PKR.
FXStreet determines local gold prices based on global values, factoring in the USD/PKR exchange rate. Although local prices change daily, they may differ slightly. Gold is often seen as a safe investment, a way to preserve wealth, and a shield against inflation, especially during tough times.
GBP/USD rises to around 1.3685 during the early European session, reflecting better UK economic data
The GBP/USD pair is currently at about 1.3685, its highest level since September 2025. This increase comes from better-than-expected UK Retail Sales and PMI data. Analysts now believe that further rate cuts from the Bank of England may be postponed.
Worries about the Federal Reserve’s independence and a possible US government shutdown are putting pressure on the US Dollar. The Trump administration has also hinted at tariffs on European countries due to control over Greenland, although we expect the usual back-and-forth in trade war talk.
Trading Week Overview
This trading week started with GBP/USD close to the 1.3700 level for the first time in months. Important upcoming events include a Federal Reserve interest rate decision and the nomination of Trump’s choice for the new Fed Chair. On Monday, the Pound rose by 0.55% against the US Dollar amid speculation about potential interventions in foreign exchange markets. Even with solid US data, these rumors ahead of the Federal Open Market Committee’s meeting in January can’t be overlooked. Last Friday, there were reports of interventions aimed at influencing the Japanese Yen and weakening the US Dollar. Financial institutions were approached about the yen’s exchange rate, signaling market fluctuations. With the pound pushing hard against the 1.3700 mark, the current trend favors bullish strategies. Strong economic data from the UK last week supports this momentum. It may be a good time to buy call options or set up bullish call spreads on GBP/USD to take advantage of a potential breakout in the weeks ahead.Market Analysis
The pound’s strength is backed by solid data, giving us confidence in this upward trend. Recent statistics show retail sales volumes grew by 1.2% in December 2025, altering market expectations. Traders now believe there’s a lower chance of a Bank of England rate cut in the first quarter, keeping the interest rate at 5.25% and supporting the pound. On the other hand, uncertainty surrounding the Federal Reserve is weighing on the dollar. The CME’s FedWatch Tool indicates over a 75% chance that the Fed will keep rates stable through March, a big change from the two rate cuts expected in November 2025. This caution is linked to the forthcoming announcement of a new Fed Chair, affecting dollar sentiment. This uncertainty has led to an uptick in implied volatility for GBP/USD options, making outright call purchases more expensive. In this environment, selling out-of-the-money put spreads could be advantageous. This approach allows us to collect premium while betting on the price remaining above a given level, leveraging the higher volatility. The key event to watch is the Federal Reserve’s interest rate decision and accompanying statement this week. While no rate change is expected, a more hawkish tone could quickly shift this bullish momentum and push the pair back towards the 1.3500 level. We must be ready for this possibility, as a stronger dollar might invalidate the current setup. Create your live VT Markets account and start trading now.Recent data shows an increase in gold prices in India.
Gold prices in India rose on Tuesday. According to FXStreet, the price jumped from INR 14,949.56 to INR 14,989.78 per gram. The price per tola also increased, moving from INR 174,368.80 to INR 174,846.50.
In India, FXStreet updates gold prices daily based on international rates and the USD/INR exchange rate. These prices are indicative and local rates may vary slightly.
Gold As A Safe Haven
Gold is often seen as a safe-haven investment and a way to protect against inflation, especially during tough economic times. Central banks are major gold buyers, having added 1,136 tonnes to their holdings in 2022—the largest annual purchase ever. Gold prices typically rise when the US Dollar and US Treasuries fall. When these assets drop, gold often increases, particularly during stock market declines. Political tensions and interest rate changes also play a big role in how gold performs. Prices are affected by various factors, including stability in governments and interest rates. A stronger US Dollar can lower gold prices, while a weaker Dollar can boost them. Gold prices change based on global economic conditions.Recent Gold Market Trends
The recent increase in gold prices highlights its value as a safe-haven asset amidst growing economic uncertainty. As of January 27, 2026, market concerns from late last year are still influencing the year’s start. This situation makes holding long positions in gold derivatives—like futures or call options—an appealing strategy to protect against possible declines. We should keep an eye on the strong demand from central banks, which helps support prices. According to the World Gold Council, central banks bought over 1,000 tonnes for the third consecutive year in 2025, with emerging markets leading this trend. This steady demand indicates that any significant price drops are likely to attract strong buyer interest. The U.S. Federal Reserve’s decision to cut interest rates throughout 2025 has also positively impacted gold. With the Fed’s pause on the funds rate, the U.S. dollar has weakened, currently around 101.50 on the DXY index, making gold cheaper for foreign buyers. Traders might find strategies that profit from a weak dollar useful, as this trend supports higher gold prices. We’re also noticing pressure in the equity markets, with the VIX volatility index recently rising above 20. The volatility seen in the S&P 500 during the second half of 2025 has made many investors anxious. This cautious sentiment often leads to money moving from stocks to gold, suggesting that put options on equity indices could be a beneficial trade. Ongoing geopolitical instability continues to support gold’s appeal. The tensions that arose in various regions during 2025 are still present, leading to an unpredictable global situation. For derivative traders, unexpected events could spark sudden increases in gold prices, making long volatility strategies potentially rewarding. Create your live VT Markets account and start trading now.Gold prices have risen in Malaysia, according to recent market data.
Gold prices in Malaysia rose on Tuesday, as reported by FXStreet. The price per gram hit 644.94 Malaysian Ringgits (MYR), up from 642.42 MYR on Monday. The price for one tola increased to 7,522.42 MYR, compared to 7,493.02 MYR the day before.
FXStreet determines its gold prices based on global rates and adjusts them using the USD/MYR exchange and local measurement units. Keep in mind that these prices are reference points and might differ from local rates.
Gold As A Store Of Value
Gold is known as a reliable store of value and is often seen as a safe-haven asset during tough times. It helps protect against inflation and currency decline. Central banks are the main holders of gold, building large reserves to stabilize their economies. In 2022, central banks bought 1,136 tonnes, worth about $70 billion, setting a record for yearly purchases. Gold typically rises when the US Dollar and US Treasuries weaken. Factors like geopolitical tensions and lower interest rates can also push gold prices up because of its safe-haven status. On the flip side, a strong US Dollar usually limits gold price increases. With gold trending upwards today, January 27, 2026, we are reminded of its importance as a safe-haven asset. This small price increase indicates that traders are seeking protection amid broader market uncertainty. Derivative traders should keep an eye on this, as even minor changes can hint at larger trends toward risk-averse assets.Impact Of US Federal Reserve Rate Cuts
In 2025, the U.S. Federal Reserve made several rate cuts, which has weakened the U.S. Dollar. The Dollar Index (DXY) has softened from its 2024 highs and has been around the 101 mark recently. This weaker dollar situation provides a boost for gold, making it less expensive for buyers using other currencies. Demand from central banks continues to support the gold market, a trend that has strengthened beyond the record levels seen in 2022. In 2025, central banks, especially the People’s Bank of China, added over 950 tonnes to global reserves. This ongoing buying reduces market supply and helps keep prices stable, minimizing risk for traders. Although inflation has eased, the core Consumer Price Index (CPI) in the U.S. has stayed above the 2% target for most of last year, averaging about 2.9% in the last quarter of 2025. This persistent inflation, along with ongoing geopolitical issues, makes gold attractive as both an inflation hedge and a crisis asset. Therefore, traders should consider strategies that could take advantage of sudden price spikes due to unpredictable events in the weeks ahead. Create your live VT Markets account and start trading now.Dividend Adjustment Notice – Jan 27 ,2026
Dear Client,
Please note that the dividends of the following products will be adjusted accordingly. Index dividends will be executed separately through a balance statement directly to your trading account, and the comment will be in the following format “Div & Product Name & Net Volume”.
Please refer to the table below for more details:
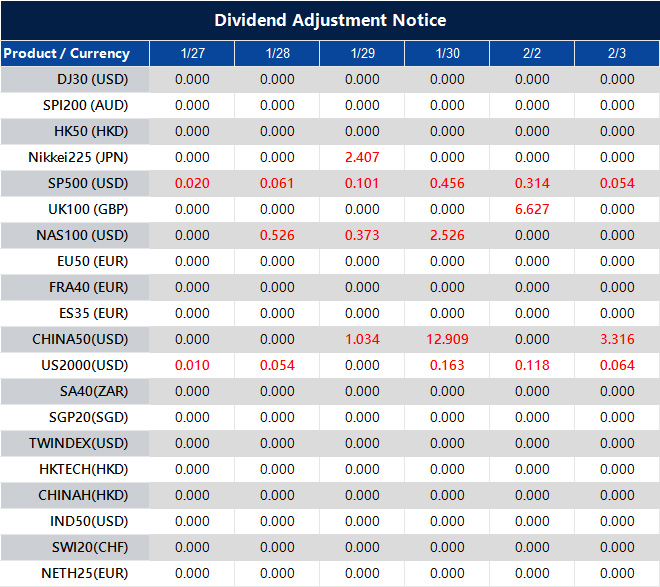
The above data is for reference only, please refer to the MT4/MT5 software for specific data.
If you’d like more information, please don’t hesitate to contact [email protected].
GBP/USD rises above 1.3650 thanks to strong UK economic indicators and an overbought RSI
**GBP/USD Outlook**
GBP/USD has risen to about 1.3685 in the early European session on Tuesday. The Pound is gaining against the US Dollar due to stronger UK Retail Sales and PMI data.
The current RSI shows the currency pair is overbought, indicating a possible pause in its upward movement. Key support is at 1.3480. Worries about the Federal Reserve’s independence and a potential US government shutdown are putting pressure on the US Dollar.
The Fed is expected to keep interest rates steady in their upcoming meeting after making three cuts by the end of 2025. If Fed officials make any hawkish remarks, it might help the US Dollar.
From a technical perspective, GBP/USD is trading above the 100-day EMA at 1.3385, keeping a bullish outlook with an RSI of 72. Immediate resistance is at the upper Bollinger Band at 1.3656, while initial support is at the 20-day middle band at 1.3480.
The Pound Sterling is the oldest currency globally and plays a crucial role in foreign exchange, representing 12% of global transactions. Its value is shaped by the Bank of England’s monetary policies and economic data like GDP and PMI. A positive trade balance also boosts the currency’s strength.
**Market Dynamics**
Last year, the Pound strengthened towards 1.37, driven by solid UK economic reports. This strength was based on the belief that the Bank of England would delay any interest rate cuts. However, an overbought RSI suggested that the rally might not last.
That optimism has diminished as the economic outlook has become murkier. UK inflation for December 2025 was at 3.1%, lower than its peak but still above the Bank of England’s 2% target. Additionally, the first estimate for Q4 2025 GDP showed only 0.1% growth, indicating stagnation in the economy due to high rates.
On the US side, concerns from late 2025 have calmed somewhat. The Federal Reserve kept interest rates steady earlier this month, with firmer commentary than expected. The latest Non-Farm Payrolls report revealed a solid addition of 215,000 jobs, indicating the US economy’s ongoing strength.
The overbought signal when GBP/USD was above 1.3650 proved to be a crucial warning. Now trading around 1.3420, we think it’s wise to sell rallies. Using any increase towards the old support level of 1.3480 to buy puts or sell call spreads might be a smart strategy in the coming weeks.
Volatility is another important factor in our positioning. Implied volatility for GBP/USD has decreased from December’s highs, with 1-month volatility around 7.2%, compared to historical averages of about 9% during uncertain times. This decline allows for cheaper option purchases, providing a defined-risk method to prepare for a potential drop below the previously mentioned 1.3385 support level.
Create your live VT Markets account and start trading now.
The US Dollar Index stays near 97.00 amid Fed uncertainty and shutdown worries.
The US Dollar Index is feeling pressure, trading close to 97.00 during the Asian session. This is largely due to worries about the independence of the Federal Reserve and a potential US government shutdown, as Congress continues to struggle with funding issues.
Impact of Fed Chair Announcement
President Trump’s upcoming announcement of a new Fed chair is also affecting the Dollar’s value. The markets are paying close attention. It’s expected that the Fed will keep interest rates steady at its January meeting after three cuts at the end of 2025. The US Dollar is the most widely traded currency in the world, accounting for over 88% of international forex transactions, with an average of $6.6 trillion traded daily in 2022. The Federal Reserve’s actions on monetary policy, like changing interest rates and implementing strategies such as Quantitative Easing, heavily influence the Dollar’s strength. Quantitative Easing, which was used during the 2008 financial crisis, usually weakens the Dollar by increasing the money supply. On the other hand, Quantitative Tightening means stopping bond purchases, which can strengthen the Dollar. Understanding these monetary policies helps explain why the Dollar’s value changes. Right now, the US Dollar is facing strong challenges, pushing the DXY down to 97.00 as the week begins. Two main factors are driving this weakness: uncertainty about the next Federal Reserve chair and the risk of a government shutdown before the January 30 deadline. This puts the Dollar at its lowest point since September of last year, 2025. Concerns about the new Fed chair are adding to the Dollar’s bearish sentiment. The leading candidate is seen as more dovish, which suggests a continuation of relaxed monetary policy like the rate cuts we saw in late 2025 when inflation dropped to a 2.9% annual rate. This situation may encourage traders to consider strategies that benefit from rising volatility, such as straddles on major currency pairs like EUR/USD.Effects of Government Shutdown Fears
While anxiety about a government shutdown is adding to negative feelings around the Dollar, we should be careful not to exaggerate its direct impact. The extended shutdown in late 2018 and early 2019 didn’t significantly affect the DXY, as global demand for safe-haven assets outweighed domestic political issues. Thus, buying short-term put options on the Dollar solely due to shutdown fears might be a risky move. The immediate focus is on Wednesday’s Fed meeting, where we expect rates to remain unchanged. We will be looking for any hawkish comments in the press conference that may signal a pause in the easing cycle, which could provide temporary support for the Dollar. Currently, the market sees less than a 10% chance of a rate change; therefore, the real action will come from the Fed’s guidance on future policy. We think the most likely trend for the Dollar is downward, especially since the DXY has dropped from its 2024 highs above 106. In this environment, call options on gold and other commodities priced in dollars may be appealing, as they usually rise when the Dollar falls. Similarly, taking bearish positions on the Dollar against currencies with central banks that have a more aggressive outlook could be a wise strategy in the weeks ahead. Create your live VT Markets account and start trading now.AUD/USD remains elevated around 0.6920 as December CPI data is expected for RBA insights
The USD is under pressure due to potential political issues, as the US government is close to a possible partial shutdown. There is also uncertainty surrounding who will lead the Federal Reserve, especially with the upcoming policy announcement.
Key Factors Driving The AUD
Several key factors affect the AUD, including RBA interest rates, Iron Ore prices, trade relationships with China, and Australia’s inflation. China plays a crucial role as Australia’s largest trading partner, so its economic health significantly impacts the AUD. Iron Ore, valued at $118 billion annually, directly affects the AUD. A trade surplus strengthens the Australian Dollar. Reflecting on 2025, the Australian dollar peaked at around 0.6940. Today, it trades at about 0.6750, showing a shift over the past year. The strong stance of the Reserve Bank of Australia (RBA) then supported the currency, but the global situation has changed. The RBA’s aggressive approach has eased with recent inflation data showing a dip. The quarterly CPI for Q4 2025 is 3.6%, down from previous highs. Although the cash rate is still high at 4.35%, the market is unsure about more hikes and is starting to think about potential cuts later this year. This is a shift from early 2025, when another rate hike seemed likely. In contrast, the US dollar is not as affected by the political uncertainty from January 2025 regarding possible government shutdowns. The focus is now on the Federal Reserve’s data-driven strategy, with US inflation steady at around 3.1%. This has kept the Fed cautious. The market is anticipating a slow and steady approach to easing from the Fed, providing stability for the greenback.Considering Strategies For AUD/USD
We should also think about the external factors affecting the Aussie dollar, which are not as favorable as they were a year ago. After a strong performance in 2025, Iron Ore prices have recently dropped to about $115 per tonne, due to concerns about China’s property sector. Recent manufacturing PMI figures from China indicate an uneven economic recovery, which affects demand for Australian exports. Given this context, we might explore strategies that take advantage of price stability or protect against potential declines in AUD/USD. Selling out-of-the-money call options can be a good strategy to collect premium, as it seems unlikely that the AUD will rally significantly for now. Additionally, buying put options can serve as a smart way to guard against any negative surprises from Australian economic data or a further slowdown in China. Create your live VT Markets account and start trading now.USD/CAD shows slight increases during Asian trading hours, trading around 1.3720 as traders await rate decisions
USD/CAD is slightly up around 1.3720 during early Asian trading. Traders are closely monitoring the Federal Reserve (Fed) and the Bank of Canada (BoC) as both are likely to keep their interest rates unchanged on Wednesday.
The BoC is expected to hold its rate at 2.25% because inflation remains stable. On the other hand, the Fed is dealing with worries about its independence and possible leadership changes, as President Trump is expected to announce a new nominee for Fed Chair soon.
Impact of US Government Shutdown
A potential partial shutdown of the US government could weaken the US Dollar against the Canadian Dollar. Chuck Schumer has opposed a funding plan that could lead to a shutdown if no resolution is found by January 30. The Canadian Dollar might also be affected by trade conditions, especially from US tariff threats on Canadian goods. Other important factors impacting the CAD include interest rates, oil prices, and the overall economic situation. The BoC’s rates play a significant role in determining CAD’s value. Generally, higher interest rates support a stronger CAD, as do rising oil prices, since Canada is a major oil exporter. Economic indicators like GDP and employment data also have a strong influence on the strength of the Canadian Dollar. The USD/CAD pair is showing some strength, and we await insights from the upcoming meetings of the Federal Reserve and the Bank of Canada. The Fed’s funds rate stands at 4.50%, while the BoC’s overnight rate is 4.25%, making the interest rate gap favor the US dollar. Traders expect both banks to maintain their current rates, but the accompanying commentary will be crucial.Canadian Dollar Support and Risks
Recent data indicates persistent inflation in the US, with the latest Consumer Price Index for December 2025 at 3.1%, slightly above expectations. This supports the Fed’s stance for prolonged higher rates, keeping the US dollar strong. Meanwhile, Canada’s recent inflation figure was a lower 2.7%, giving the BoC some flexibility. The Canadian Dollar gains support from rising crude oil prices, with WTI remaining above $85 per barrel. However, this may not be enough to counteract the effect of higher US interest rates. This situation creates a delicate balance, and upcoming economic data may lead to significant fluctuations in the coming weeks. We recall a similar period of uncertainty in 2025 when fears about the Fed’s leadership and potential US government shutdowns led to market volatility. As another budget deadline approaches in mid-February, these old concerns are becoming relevant again. Any signs of political stalemate could quickly weaken the US dollar, echoing past patterns. Given this environment marked by differing policies and political risks, making directional bets is challenging. Traders might benefit from strategies that capitalize on increasing volatility, as the Cboe Volatility Index (VIX) rises to 18. Options strategies like long straddles or strangles could effectively take advantage of sharp moves in either direction. While the severe tariff threats of previous years have eased under the current USMCA framework, minor trade disputes remain. Additionally, we know from the price shocks of 2022 and 2023 that oil prices can be volatile. A sudden geopolitical event could disrupt the energy market stability, adding another layer of risk for the Canadian dollar. Create your live VT Markets account and start trading now.PBOC sets USD/CNY reference rate at 6.9858, higher than the previous day’s rate
The People’s Bank of China (PBOC) has set the USD/CNY central rate at 6.9858 for today. This is slightly higher than yesterday’s rate of 6.9843 and notably above the Reuters estimate of 6.9548.
The PBOC’s goals are to keep prices stable, maintain a steady exchange rate, and encourage economic growth. It is a state-owned bank, with the Chinese Communist Party influencing its operations.


