Dividend Adjustment Notice – May 22 ,2025

Dear Client,

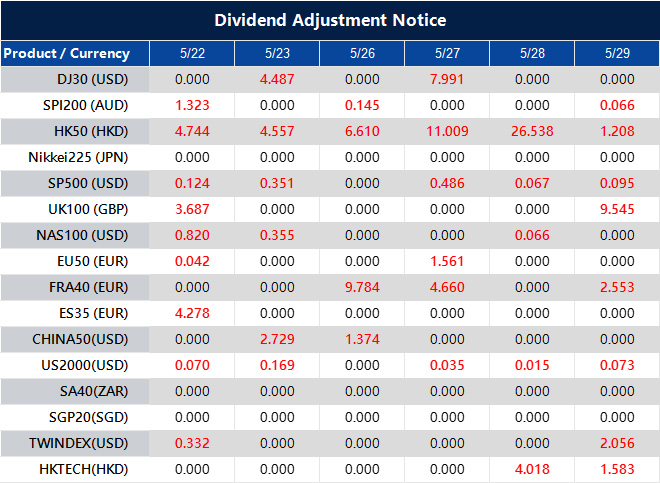
Please note that the dividends of the following products will be adjusted accordingly. Index dividends will be executed separately through a balance statement directly to your trading account, and the comment will be in the following format “Div & Product Name & Net Volume”.

Please refer to the table below for more details:

Dividend Adjustment Notice

The above data is for reference only, please refer to the MT4/MT5 software for specific data.

If you’d like more information, please don’t hesitate to contact [email protected].

Asahi Noguchi, a BoJ board member, notes Japan’s economy is steadily growing and may require policy adjustments.

The Bank of Japan (BoJ) has noted that Japan’s economy is growing steadily, with possible changes to policy rates on the horizon. The central bank is closely monitoring if inflation remains stable at around 2%, emphasizing the importance of sustainable inflation and rising wages. Recently, the economy faces external risks due to increasing pressures from international tariff policies. In March, the yield on the 10-year Japanese Government Bond was close to 1.6%. The BoJ intends to maintain its loose monetary policy because the primary cause of inflation stems from rising import costs.

Monetary Policy Overview

Japan’s current monetary policy includes Quantitative and Qualitative Easing, a strategy that began in 2013 to help boost inflation. Negative interest rates and yield control were introduced in 2016, leading to a shift in 2024 when interest rates increased. This change caused the yen to weaken, prompting policy adjustments as inflation surpassed the 2% target. The BoJ’s policy adjustments reflect concerns about the yen’s weakness and rising global energy prices. Wage increases are crucial for sustaining inflation, which influences the BoJ’s considerations regarding its previously established ultra-loose policy. The USD/JPY exchange rate was at 143.30, showing recent market trends. Policymakers in Tokyo now believe the economy is growing steadily. The focus is on whether domestic price trends, especially underlying inflation, can consistently stay around 2% without external boosts. The emphasis is on wage growth to support consumer spending and create stable inflation. Any changes to interest rates will likely be gradual and based on improved wages across various industries. External factors, including tariff changes and global political conditions, may still affect prices negatively. Japan, as a significant energy importer, is notably vulnerable here. In March, rising yields on government debt close to 1.6% indicated that markets are preparing for tighter conditions, even if policy hasn’t shifted entirely yet. This suggests that they are anticipating persistent inflation before adjusting further. Since 2013, the BoJ has injected funds into the economy through aggressive asset purchases—both quantitative and qualitative. This approach included deeply negative rates and yield curve control starting in 2016. These measures were aimed at addressing ongoing shortfalls in inflation targets. As we move into 2024, rising interest rates became necessary, especially as consumer prices exceeded the Bank’s target. This shift was driven not just by inflation but also by the yen’s significant decline against the US dollar.

Implications for Derivatives Markets

For those in the derivatives market, changes in Japan’s monetary policy have several immediate effects. Pricing options or futures related to JGBs or FX pairs like USD/JPY now requires monitoring not only policy statements but also labor data. If wage figures suggest strong consumption growth, sharp movements in the yen could signal the likelihood of higher rates. As the BoJ’s approach gradually changes, derivative trades on rate-sensitive instruments should consider various scenarios—some where inflation slows down and others where wage growth propels it. The transition won’t happen suddenly, but it is in progress. Traders need to incorporate these developments, considering how companies might respond to expected cost rises. We have observed the yen reacting strongly during past tightening cycles, even minor ones. Monitoring 10-year yields and their impact on rate differentials with the U.S. may help timing decisions for currency contracts. The forward market typically adjusts prices faster than spot traders may anticipate. Experience shows that BoJ policy moves are cautious yet impactful. Statements regarding wage conditions or inflation expectations should be viewed as directional indicators. Thus, option positions may benefit from broader implied volatility bands as the market reflects on data uncertainties. In the coming weeks, interest in inflation reports and wage negotiations, especially among Japan’s larger companies, is expected to grow. Any sign that these metrics are holding steady—even slightly—may support policy changes. When market consensus leans strongly in one direction, it could create contrarian timing opportunities in rates and currency markets. Currently, the tone is one of caution but also readiness to act. This dual perspective is where traders can find an advantage. Carefully timing rate exposure while staying responsive to wage and consumer behavior will likely yield better results than static positions. Create your live VT Markets account and start trading now.

here to set up a live account on VT Markets now
PBOC sets the USD/CNY central rate at 7.1903, lower than before

The People’s Bank of China (PBOC) has set the USD/CNY central rate at 7.1903 for the latest trading session. This is slightly lower than the previous rate of 7.1937 and also lower than the expected rate of 7.2009 predicted by Reuters. The PBOC aims to keep prices and exchange rates stable while supporting the economy. It is owned by the People’s Republic of China and overseen by the Chinese Communist Party Committee Secretary.

PBOC Monetary Policies

The PBOC uses several tools for its monetary policy, including the seven-day Reverse Repo Rate and the Medium-term Lending Facility. Changes to the Loan Prime Rate (LPR) can affect the Renminbi’s exchange rates. Private banks are allowed in China, with 19 currently in operation. The largest ones are digital lenders WeBank and MYbank, associated with Tencent and Ant Group. All provided information is for informational purposes only and should not be construed as financial advice. It’s important to do thorough research before making investment decisions. The recent adjustment in the USD/CNY central parity rate, from 7.1937 to 7.1903, though small, reflects the PBOC’s ongoing efforts to manage the Renminbi’s strength within controlled limits. The average forecast from Reuters expected 7.2009, indicating that the central bank aims to apply subtle pressure on the USD/CNY rate. This move suggests a policy preference for a stronger local currency, possibly to show domestic confidence or to limit imported inflation. The PBOC closely monitors monetary conditions, and any difference from market expectations in its daily fixing provides insight into its policy direction. Short-term traders focusing on rate differences or market momentum should pay attention to these small but intentional changes. These adjustments usually signal a trend that lasts for several trading sessions, influencing implied volatility based on the interpretation of the central bank’s intentions.

Recent Market Dynamics

It’s important to know that the PBOC has multiple tools it can use quickly, such as open market operations like reverse repos, term lending through the Medium-term Lending Facility, or changes to the Loan Prime Rate. These are practical measures employed to adjust policies without indicating long-term commitments. Recent actions, particularly around the LPR, have been either neutral or dovish, suggesting ongoing support for growth, but within limits. With strict capital controls and low consumer inflation, the PBOC might be strategically keeping the Renminbi stable to better manage external pressures and support confidence in key economic sectors. Online banks like WeBank and MYbank may not significantly impact large capital flows, but they show that funding innovation is still active. Their roles as credit providers within the fintech umbrella reflect consumer demand and liquidity distribution, especially for small and medium enterprises. Keep an eye on how authorities encourage or discourage credit use through these platforms, as it can significantly impact consumer sentiment and market expectations. In the near term, reactions from other central banks—particularly the Fed—will influence adjustments in USD/CNY positioning. The PBOC’s daily fixings suggest it wants some flexibility, which could reduce volatility in this currency pair. Options traders may need to revise delta hedges if the range remains tight; carry trades could emerge if implied yields exceed hedging costs. No one makes policy changes in isolation. Adjustments are purposeful and carefully timed. It’s essential to understand the fixings and support them with the tools available. There’s usually no ambiguity in these actions. Create your live VT Markets account and start trading now.

here to set up a live account on VT Markets now

Singapore’s GDP declined 0.6% in the first quarter, less than the predicted 1% drop.

Singapore’s Gross Domestic Product (GDP) decreased by 0.6% in the first quarter compared to the previous quarter. This result is better than the expected drop of 1%. GDP data is important because it shows how well Singapore’s economy is doing and can affect economic policies.

Understanding Economic Contraction

This contraction means economic activity has slowed down from the last quarter. However, the actual decline was not as bad as predicted. This information can impact market outlook and influence business and investment choices. It’s crucial to grasp GDP trends to understand broader economic changes. Though a 0.6% decline in Singapore’s GDP may seem worrying, it turned out to be less severe than the expected 1% drop, which is a small positive surprise. This indicates that while growth has slowed, the economy performed slightly better than feared, especially given high interest rates and weak global demand. These changes are not as drastic as those seen during a financial crisis but still show reduced growth in major sectors. At this point in the year, this performance suggests we should remain cautious, but also that the worst-case scenarios haven’t occurred yet. A quarterly decline alone doesn’t automatically mean a downturn, but consecutive drops after low activity are taken seriously by economists. GDP figures often influence market sentiment because they can indicate shifts in spending, employment, and confidence. Currently, what matters is whether this contraction is a temporary situation or the start of a trend. Policymakers watch this figure closely because it helps them adjust spending expectations. Even though the performance was slightly better than expected, a narrow margin of improvement shouldn’t be seen as a sign of strength, especially with external demand still shaky.

Market Reactions to GDP Data

For those keeping an eye on derivatives, the key takeaway is to prepare for a long period of moderate volatility rather than any sudden changes in inflation or growth. The shorter end of the yield curve usually reacts first to GDP data, and spreads began widening last week in anticipation of weaker activity. This data reduces the urgency to hedge against aggressive policy changes, but there is no new momentum to support risk-seeking trades. Borrowing costs remain high, and tight financial conditions have not fully impacted the economy, keeping downside risks in mind. In derivative pricing, what matters is not just where the data lands but how far off consensus was from reality. In this case, the slight positive surprise is unlikely to significantly change forward guidance. Hedging strategies might still favor options linked to declines in production in the second quarter. Macro positions are sensitive to open interest, and unless there’s a rebound or changes in trade volumes, risk premiums are unlikely to lessen. Lim’s team has noted that any further weakness in trade or manufacturing—whether caused by China or regional issues—could lower projections for the third quarter. Currently, the main concern is growth, more so than inflation, which is already reflected in interest rate futures. The GDP figure shouldn’t be ignored just because it didn’t meet the worst-case predictions. The 0.6% drop confirms that economic activity has significantly cooled. We are closely watching how this affects capital allocation. Yield curves, forward rates, and longer-term swaps are adjusting, but not enough to indicate a major shift. As some market players test boundaries, especially in FX and rates volatility, the bias leans toward neutral or lower growth expectations. Upcoming releases, especially export volumes and purchasing managers’ indexes, will help determine if this contraction is a one-time event or a sign of a continuing trend. Risk models are likely to revise near-term demand expectations unless there’s an improvement in trade flows soon. Until then, avoiding aggressive positioning is probably the best strategy. Create your live VT Markets account and start trading now.

here to set up a live account on VT Markets now

In March, Japan’s machinery orders rose 8.4% year-on-year, surpassing forecasts of -2.2%.

Japan’s machinery orders in March rose by 8.4% compared to last year, surpassing expectations of a -2.2% decrease. This strong growth comes despite uncertainties in the global economy. The results indicate solid demand in Japan’s machinery sector, going against earlier predictions of a decline. An ongoing increase in machinery orders may boost overall economic activity.

Currency Markets Overview

In the currency markets, the AUD/USD stays above 0.6400, influenced by possible rate cuts from the Reserve Bank of Australia and a weak US Dollar. Meanwhile, USD/JPY is near 143.50, showing mixed expectations between US and Japanese monetary policies. Gold prices are rising, getting close to $3,350 as anticipation builds around US PMI data. Bitcoin has surged to a new all-time high over $111,800 after a brief dip caused by weak US Treasury bond auction results. The forex and commodities markets are lively, influenced by changing trade tensions and policy adjustments. Keeping an eye on these factors is crucial for understanding potential market shifts. Although Japan’s machinery orders in March exceeded expectations by a large margin, rising 8.4% year-on-year compared to the forecast contraction of 2.2%, this doesn’t necessarily indicate a broad recovery in domestic business investment. Instead, it shows a strong sub-sector that could help support overall demand, especially as companies remain cautious about capital spending. We believe this level of outperformance, amidst global manufacturing and trade uncertainties, suggests steady industrial momentum in Japan that is not yet reflected in broader market indicators.

Implications for Market Participants

For investors in Japanese equities or index futures, the renewed demand for machinery could act as a buffer against potential risks if corporate spending picks up. However, the sustainability of this trend relies on stable export demand, particularly from other Asian countries. A rise in industrial production or inventory trends could strengthen the positive signal from machinery data. In the currency markets, the Australian Dollar hovers above 0.6400 against the US Dollar, influenced by two opposing factors. On one side, dovish remarks and soft domestic data suggest further rate cuts from the Reserve Bank of Australia; on the other, a weaker US Dollar has supported the pair. This zone may act as a short-term base if US economic data remains inconsistent. Traders should prepare for more significant swings around inflation or wage data releases from either country, especially as realized volatility remains low. The USD/JPY near 143.50 indicates market uncertainty about differing rate outlooks. The Federal Reserve has kept the market guessing with mixed signals regarding inflation and potential cuts, while Japanese policymakers are gradually moving away from overly loose policies. Frequent comments from Tokyo officials suggest concern over erratic yen movements. Implied volatilities for near-term USD/JPY options are high, anticipating possible government action or policy changes. Traders in this pair may want to consider accumulating positions ahead of key events for favorable risk-reward opportunities, particularly if economic data surprises. In commodities, gold is inching closer to $3,350 as interest in inflation hedging grows. Weak demand from a recent Treasury auction has slightly pressured real yields, benefiting this non-yielding asset. Upcoming US PMI data could shift sentiment again, depending on perceived growth momentum. We suggest traders adjust their expectations to respond short-term to macro data, as positioning in gold has become crowded. Even minor pullbacks could trigger stop-loss levels and prompt rapid market movements. Bitcoin’s rise past $111,800 raises questions about its sustainability. The bounce back after a recent dip—caused by a poor Treasury auction—indicates ongoing interest in digital assets when traditional ones underperform. Institutional flows seem to be returning, and if macro risk sentiment stabilizes, it could support further gains. Short-term traders should assess whether chasing momentum is wise or if more cautious entries would offer better risk-reward opportunities, especially during quarterly settlements or liquidation sessions from derivatives exchanges. Overall, we observe that asset classes are reacting to shorter macro cycles and data interpretations rather than following a definitive trend. Expectations on rates, policy approaches, and supply-side factors are reshaping market prices, favoring agility. It’s important to focus on precise position sizing, selective risk exposure, and clear trigger points that could invalidate core strategies. Create your live VT Markets account and start trading now.

here to set up a live account on VT Markets now

Gold prices rise above $3,300 amid geopolitical tensions and US debt concerns

Gold prices have increased by over 0.50%, staying above $3,300. This rise comes as traders worry about the US tax bill vote and ongoing tensions in the Middle East. Currently, XAU/USD is trading at $3,317, having bounced back from a low of $3,285. US equity markets are down, and US Treasury bond yields are on the rise. A tax-cut bill’s potential approval could add nearly $3.8 trillion to the national debt.

US Dollar Index Dip

The US Dollar Index (DXY) dropped 0.52% to 99.49 after a downgrade of US debt, which supports higher gold prices. Meanwhile, tensions in the Middle East persist, even as China and the US reduce tariffs ahead of upcoming talks. Traders are keeping an eye on Federal Reserve speeches, Flash PMIs, housing data, and Initial Jobless Claims. US Treasury yields are climbing, with the 10-year yield up by nine and a half basis points to 4.58%. Gold prices are gaining from concerns about US debt following the downgrade of the government’s credit rating. The Federal Reserve believes that current monetary policy is sufficient and is aware of the inflationary effects of rising US tariffs. Gold may test $3,350, with additional targets at $3,400 and $3,500. If prices turn bearish, they must fall below $3,300, with support at $3,204.

Federal Reserve Impact on Gold

The Federal Reserve’s interest rate decisions influence the strength of the US Dollar. The Committee meets eight times a year to evaluate economic conditions and decide on monetary policy, which may include quantitative easing or tightening. Gold’s recent price increase reflects market anxiety driven mainly by fiscal and geopolitical uncertainties. As prices recover from lows and surpass the $3,300 mark, traders are shifting toward safe-haven assets amid worries about the US’s fiscal responsibility and rising global tensions. While equities have struggled, Treasury yields are rising—particularly the 10-year yield, which is approaching 4.6%. Generally, higher yields reduce the appeal of non-yielding assets like gold. However, concerns about the US’s future debt levels, especially with the tax changes projected to add over $3.5 trillion, seem to outweigh the impact of yields. As markets digest the downgrade of US debt quality, the US Dollar Index fell below 99.5. This decline in the dollar has strengthened gold since the metal is priced in dollars. A weaker dollar increases purchasing power for foreign buyers, which boosts gold prices. Additionally, tensions in the Middle East are contributing to gold’s upward momentum. Although US-China tariffs have eased slightly to facilitate discussions, it hasn’t alleviated worries about global stability. Markets are shifting focus to various economic indicators this week, including manufacturing flash PMIs, housing market data, and new jobless claims. These will likely influence short-term sentiment regarding monetary policy and inflation trends. Rising bond yields indicate ongoing inflation concerns, despite the Federal Reserve’s claims that its current stance is adequate. From a strategy perspective, prices have held just above major support at $3,285, and the upward momentum appears strong as gold moves toward $3,350. Breaking through this level could lead to targets of $3,400 and $3,500 if macroeconomic issues don’t reverse the trend into commodities. It’s crucial to consider the Committee’s recent statement. The central bankers are maintaining steady policy, indicating that current interest rates align with their inflation goals. They have also recognized that increasing tariffs push prices higher. They might let data influence their next move; however, with inflation below target and core readings being informative, a pause might be preferable over risking greater uncertainty. Unless there are significant geopolitical changes, there’s a limited volatility window driven by macro announcements and scheduled Fed speeches. Reactions to these events, especially if they differ from the Fed’s wider messaging, could quickly shift dynamics. Those watching derivatives should stay alert for increased implied volatility, especially regarding gold and currency pairs linked to Treasury shifts. While support is around $3,204, prices above $3,300 indicate a strong bullish trend for now. A clear drop below this level could change the outlook, but currently, the upward trend holds unless data or central bank comments significantly ease current fears. Create your live VT Markets account and start trading now.

here to set up a live account on VT Markets now

US Treasury yields rise sharply after disappointing 20-year bond auction and upcoming budget vote

US Treasury yields rose sharply on Wednesday. This increase followed a weak auction for 20-year US bonds and came just before a crucial budget vote in Congress. The yield on the 10-year Treasury note jumped by 11 basis points to 4.601%. A sale of $16 billion in 20-year bonds saw weak demand, with yields climbing to 5.047%, up from 4.810% in the previous auction. US government debt yields increased after Moody’s downgraded US credit ratings, citing ongoing fiscal challenges.

Concerns About the Budget

Sources report that worries are growing about US budget deficits, with new tax law estimates potentially adding trillions to the deficit. The yield on the 20-year note reached 5.125%, its highest since November 2023. Economic policies from former President Donald Trump drove Treasury yields higher as tariffs contributed to inflation, which pressures the bond market. The House of Representatives is expected to vote on Trump’s budget soon. The Federal Reserve’s choice to keep interest rates steady impacted short-term yields, pushing the 2-year Treasury note yield up to 4.022%. Interest rates affect currencies and gold prices, while the Fed funds rate shapes market expectations and stability. Yields on US government bonds surged midweek, mainly due to weak interest in the $16 billion 20-year bond auction. Investors showed fatigue when demand was low, making markets hesitant, especially with increasing supply and worries about America’s long-term fiscal health. Yields reached 5.047%, significantly higher than in the last auction—indicating that buyers wanted more compensation for their investment. Such demand shortfalls not only cast doubt on future auctions but also affect the broader fixed income market, raising borrowing costs and shaking confidence in upcoming bond sales.

Market Responses and Future Outlook

After Moody’s downgrade, which pointed to continuing budget deficits and rising debt levels, the markets reacted quickly. The yield on the 10-year Treasury note rose sharply, reflecting changing risk perceptions. Institutions must rethink their pricing strategies, particularly with long-term yields climbing. The 20-year yield reached its highest level since last November, signaling a serious challenge to confidence in America’s fiscal direction, where each poorly received auction becomes increasingly significant. There are wider concerns about the fiscal approach being taken, especially with trillions in new obligations expected. The budget debates in Congress are no longer just routine; they’ve become critical moments for markets already grappling with heavy issuance. For traders, it’s clear that much of the pressure arises from policy decisions rather than mere economic trends. Bond pricing is now influenced not just by inflation expectations or job data but by governmental indecision. Short-term yields are also climbing, especially the 2-year yield, which has moved above 4% as market participants expect rates to remain high for the foreseeable future. With the Federal Reserve holding its benchmark interest rate steady, focus has shifted to how persistent inflation might become and if enough tightening has already occurred. The yield curve remains inverted, signaling skepticism about growth prospects and doubts regarding future inflation management. In this challenging environment, investors should consider making cautious adjustments and practicing careful risk management. It’s important to concentrate on actual yields and market volatility related to policy changes. Auction dynamics also provide key insights; observing bid-to-cover ratios, tail sizes, and indirect bidder activity can help forecast short-term yield movements, particularly for intermediate and long durations. Currency and precious metals are also under pressure from these developments, mainly due to changing monetary policy expectations. The dollar’s strength is somewhat bolstered by the Fed’s current stance that rate cuts are not on the horizon, making dollar-denominated assets more appealing. However, monitoring dollar funding costs and repo activity is essential for signs of stress. In summary, yields are sending a clear message: the balance between fiscal challenges and central bank policies is precarious. If weekly auctions continue to disappoint and deficits grow unchecked, we may see more volatility in yields. This environment presents opportunities for dislocations and potential outperformance. Active management of exposure, especially with interest-rate-sensitive assets, will be crucial in the near future. Create your live VT Markets account and start trading now.

here to set up a live account on VT Markets now

Since President Trump’s term began, WTI Crude Oil has faced resistance at $64 for several reasons.

WTI crude oil has dropped below $62.00 per barrel. The rising supply levels reported by the Energy Information Administration (EIA) are putting pressure on prices. Oil prices have struggled since Donald Trump became president. Concerns about a recession, an increase in global supply, and a weaker US Dollar have added to the challenges. Last year, prices were supported by strong demand after the pandemic and limited supply.

Impact of the Trump Administration

During Trump’s time in office, policies aimed at increasing domestic oil production and relaxing environmental regulations changed expectations for supply growth. As we move toward mid-2025, the outlook for supply has shifted. The EIA’s recent report showed a bigger-than-expected rise in crude oil inventories, hinting at weak demand. This has fueled worries about oversupply and pushed WTI prices further down, now below $62 per barrel. Geopolitical risks, like potential conflicts involving the US and Iran, also influence prices. Recent tensions in the Middle East have hinted at risk premiums, but the market is focused on supply issues. Technically, WTI attempted to break the 38.2% Fibonacci level at $64.179 but encountered resistance. The $64.00 level is crucial, while the 10-day simple moving average (SMA) at $61.68 provides support, with the next support level at $60.58. With West Texas Intermediate dropping below the $62 mark, we are seeing a significant shift. This isn’t just about expected inventory changes; it reflects deeper issues in supply chains that are not aligning with demand. It’s not just the EIA numbers; it’s about how the refiners aren’t drawing as much, and storage levels are showing that barrels aren’t moving as before. This indicates a potential slowdown in consumption, despite earlier hopes for a strong recovery after COVID-19.

Inventory and Demand Dynamics

The previous spike in demand that lifted prices late last year has faded. The temporary boost was due more to limited output than strong demand. Support disappeared quickly as domestic production rose without much regulatory pushback. Trump’s deregulatory policies allowed shale operators to boost production, restart wells, and revive export terminals. The market initially underestimated this response, but now supply growth is the main focus. Rising inventories, outpacing seasonal averages, indicate not just more supply but also a lack of demand strength. The EIA’s reports are shaping short-term market sentiment. A rise of this magnitude indicates reduced industrial use, weaker travel expectations, and hesitation from refiners. With prices already low, this accumulation undermines attempts to recover. In technical terms, the push towards the 38.2% line around $64.18 has faded. This level mattered not for mystical reasons, but because many traders were observing it. When so many bids fail to break through resistance, we lack conviction. We’re now testing a 10-day average closer to $61.68, and if that breaks, we may see another test around $60.58. Past price levels won’t prevent a downturn. There’s also ongoing pricing tension linked to political issues, particularly involving Iran, which creates uncertainty in buying decisions. Yet, in this environment, even political friction hasn’t led to lasting price increases. Any potential supply shocks are overshadowed by rising domestic output and international producers unwilling to cut their quotas significantly. For traders in derivative markets, the approach varies greatly depending on whether their strategy is technical or based on fundamentals from agencies like the EIA. Short-term contracts may continue to fall as inventories rise, especially if gasoline demand doesn’t increase with the season. If key economic data, like GDP and consumer metrics, worsen in the coming weeks, aggressively rolling positions into mid-term exposures could result in sharp price corrections. We have adjusted our outlook on near-term resistance levels accordingly. We don’t expect a reset in fundamentals unless external factors emerge. For now, the pressure is downward, especially if macroeconomic signals like currency movements or global manufacturing fail to provide relief. Create your live VT Markets account and start trading now.

here to set up a live account on VT Markets now

Canadian dollar strengthens by half a percent as the greenback weakens amidst market activity

The Canadian Dollar (CAD) rose by 0.5% during a slow trading session. Unexpectedly, Canadian New Housing Prices fell in April, suggesting improvements in housing affordability, which helped the Loonie. Rising Crude Oil prices are also supporting the Canadian Dollar. At the same time, issues with US government debt and higher Treasury yields are shaking market confidence.

USD/CAD Trade Moves

The Canadian Dollar has gained strength against the US Dollar, pushing the USD/CAD pair down to 1.33850. Technical indicators hint at a downward trend, suggesting more declines may come. The Bank of Canada influences the CAD by adjusting interest rates to maintain inflation between 1-3%. Typically, higher interest rates increase the value of the Canadian Dollar. Oil prices also affect the CAD since they are Canada’s biggest export. When Oil prices rise, the CAD usually strengthens due to increased demand for the currency. Additionally, inflation can raise currency value by leading to interest rate hikes. Data releases on Canada’s economy provide insights that can impact the CAD. Strong economic indicators can attract foreign investment and support rate hikes, strengthening the currency. On the flip side, weak data can lead to a decline in the CAD.

Upcoming Risk Events

The recent 0.5% rise in the Canadian Dollar during a quiet trading session is notable. When housing prices unexpectedly drop, like in April, it can benefit the currency. This drop hints at better affordability, stabilizing domestic demand and alleviating concerns about an overheated housing market. Although subtle, this can boost domestic confidence and support the currency. Moreover, a jump in crude oil prices has further lifted the Canadian Dollar, which is vital as oil is Canada’s top export. When oil prices rise, foreign buyers purchase CAD to buy Canadian oil, benefiting the currency. While the correlation isn’t always direct, there is a close connection. Even small oil gains can attract buyers to the CAD. Conversely, we’re witnessing some uncertainty in the US bond market. When Treasury yields rise, it often indicates expectations of rate changes or worries about fiscal health. Sharp increases in yields during uncertain times can signal risk repositioning rather than confidence, allowing other currencies to perform better. Currently, the Canadian Dollar has benefitted from this. From a technical perspective, the USD/CAD pair is trending lower and stabilizing near the 1.33850 level. Looking at charts, more decline seems possible. Momentum indicators suggest a bearish trend, and traders could watch for further decreases. Support levels around 1.33500 may be key in the coming days. Central bank policy does not operate in isolation. The Bank of Canada aims to keep inflation within a 1-3% range. If inflation remains high or rises, a rate response is needed. Higher rates naturally attract capital flows, especially from institutions looking for better returns, which can strengthen the CAD. However, too much inflation can reduce purchasing power, dampen demand, and ultimately reverse gains. Macroeconomic data also plays a crucial role. Factors such as employment reports, GDP growth, and trade balances influence expectations. Investors often anticipate currency movements ahead of policy changes. Strong data suggests continued tightening, which is supportive. Conversely, weak results can lead to declines. It’s more about how data aligns with analyst forecasts than the data itself. In practical terms, here are a few strategies to consider: 1. Keep an eye on oil inventory figures and global demand estimates, as they can create volatility in CAD pricing. 2. Be vigilant for Canadian inflation data surprises, as these can influence short-term interest rates and, thus, currency flows. 3. Monitor yield differentials between Canadian and US government debt, impacting positioning in CAD-related strategies. Finally, upcoming risk events—including central bank speeches, economic data releases, or commodity supply disruptions—could generate short bursts of movement or consolidation. Be ready for quick reversals and avoid relying solely on trends. Some market sessions still have low volume, which can exaggerate price movements beyond what the fundamentals suggest. Such imbalances may create short-term trading opportunities, but they also call for careful risk management. Create your live VT Markets account and start trading now.

here to set up a live account on VT Markets now

US dollar falls to two-week low amid rising concerns over fiscal issues and economic performance

The US Dollar has fallen to new two-week lows due to worries about the US fiscal situation and economic performance. The US Dollar Index has dropped below the significant 100.00 mark. Key economic indicators to watch include the Chicago Fed National Activity Index, Initial Jobless Claims, Existing Home Sales, and S&P Global PMIs. The EUR/USD pair climbed above 1.1300, thanks to the decline of the US Dollar.

British Pound and Inflation Influence

The GBP/USD rose to 1.3470, driven by a weaker US Dollar and increasing inflation in the UK. Upcoming data on Public Sector Net Borrowing and CBI Industrial Trends Orders will be important. USD/JPY has decreased for the seventh straight day, approaching the mid-143.00s. Japan is set to release data on Machinery Orders, Jibun Bank PMIs, and Foreign Bond Investment. AUD/USD is recovering, testing the 0.6460 area amidst market fluctuations. The S&P Global PMIs for Australia are expected soon. WTI oil fell below $62.00 due to worries over supply disruptions and unexpected inventory levels. Gold soared past $3,300 per ounce, and silver reached three-week highs, both reacting to the weakening US Dollar. Make sure to research thoroughly before making financial decisions. Trading carries risks, including the potential loss of your entire investment.

Monitoring Economic and Market Trends

The recent decline of the US Dollar has been driven by two main factors: ongoing concerns about the country’s fiscal path and fears that economic activity is slowing more than expected. With the US Dollar Index dipping below the key 100.00 level, we may see more pressure on the currency soon. Several economic indicators being released in the next few days could either worsen the current decline or offer some relief. It’s crucial to keep an eye on data such as the Chicago Fed National Activity Index and the S&P Global PMIs, as these provide insights that can help gauge market risks. Initial Jobless Claims may reveal whether the labor market is really cooling down or just stabilizing, which could affect expectations for interest rates. The euro’s rise on Monday was less about its strength and more about dollar weakness. The EUR/USD increase above 1.1300 came from a reassessment of risks associated with the US economy rather than new optimism about the eurozone. At the same time, there seems to be growing interest in European currencies due to changing interest rate differences. The British Pound is benefiting from similar trends. With GBP/USD rising to 1.3470, the increase is driven by both negative perceptions of the US economy and rising inflation in the UK, which could prompt action. Data on public finances and the CBI Industrial survey from the UK may reveal whether inflationary pressures are widespread or limited to certain sectors. Reactions to this data might lead to shifts in rate-sensitive assets. The Japanese Yen’s strength isn’t driven solely by dollar weakness. The JPY has appreciated for seven consecutive days, with the pair trading near the mid-143.00s. Upcoming machinery and foreign bond investment data will help determine if capital is moving strategically or just temporarily hedging. Market participants should watch cross-border flows for insights. The Australian Dollar has faced volatility but is now trying to stabilize. With AUD/USD approaching 0.6460, attention is on local PMIs. If service and manufacturing data shows resilience, we might see further upward movement, especially as global commodity trends fluctuate. Commodity prices have reacted directly to the US Dollar’s decline. Crude oil fell below $62.00 mainly due to concerns about supply chains and inventory data. However, gold and silver have seen more significant moves. Gold’s rise above $3,300 per ounce and silver’s multi-week growth indicate a shift back to hard assets for safety, likely due to doubts about monetary stability. It’s important to remain aware of how expectations for interest rates impact all parts of derivative markets. For instance, pricing of currency options has seen increased implied volatility, indicating that traders are not just betting on direction but also preparing for possible disruptions. Futures curves are also adjusting to reflect these developments in fixed income and energy markets. With the current trends in data surprises and asset positioning, the upcoming weeks could test market confidence. History suggests that sustained dollar weakness alongside rising commodity interest often leads to rebalancing in leveraged products. Thus, understanding liquidity conditions and the timing of exposure adjustments is as crucial as predicting market direction. Remember: protecting your assets and timing your re-entrances might be more important than catching every initial move. Create your live VT Markets account and start trading now.

here to set up a live account on VT Markets now

Back To Top
Chatbots