German retail sales fell again in February, based on figures from Destatis. Sales dropped by 0.6% month-on-month, compared with a forecast rise of 0.2%.
January sales were revised down to a 1.1% monthly fall from -0.9%. On a year-on-year basis, retail sales rose by 0.7%, below the 1% forecast and down from the previous 1.2%.
Euro Reaction After The Release
There was no immediate move in the euro after the release. At the time of reporting, EUR/USD was slightly higher at about 1.1470.
Retail sales data from Statistisches Bundesamt Deutschland track short-term changes in sales across Germany’s retail sector. The monthly percentage change is used as an indicator of consumer spending and is often monitored for possible effects on the euro.
We remember looking at German retail sales data from February 2025, which showed a surprising contraction and a downward revision for the prior month. This data pointed toward weakness in the German consumer, a trend that warrants close attention. That annualized growth of only 0.7% last year was an early warning sign for the broader Eurozone economy.
That pattern of consumer weakness appears to be continuing into this year. The latest data for February 2026, released just weeks ago, showed another monthly decline of 0.4%, defying expectations for a modest rebound. This confirms that the consumer spending issue we saw developing in 2025 has not yet been resolved and may be deepening.
Implications For Traders And The Euro
This persistent weakness, combined with the latest Eurozone manufacturing PMI which printed at a contractionary 47.8, puts pressure on the European Central Bank. While the March flash HICP inflation estimate held at 2.6%, the deteriorating growth outlook complicates the ECB’s policy path. We believe this increases the probability of the central bank signaling a more dovish stance in the coming months.
For traders, this outlook suggests considering downside protection on the Euro. Buying EUR/USD put options with an expiry in late April or May could be a prudent way to position for a potential slide. This strategy offers a defined risk while providing exposure to any negative reaction from upcoming ECB commentary or data releases.
Volatility in the currency markets may also present an opportunity. With the market uncertain about the timing of any potential ECB rate cut, options pricing may not fully reflect the risk of a sharp move. We see value in looking at short-dated volatility instruments tied to the Euro, as a surprise in either growth or inflation data could trigger a significant repricing.
Specifically, with EUR/USD currently trading around 1.0830, we are monitoring key support levels. Any break below the 1.0800 psychological level could accelerate selling pressure. Therefore, puts with strike prices around 1.0750 could offer an effective hedge against a fresh downturn in the currency pair.
Create your live VT Markets account and start trading now.
Start trading now – Click here to create your real VT Markets account
The US Dollar rose for a seventh straight day against the Canadian Dollar on Tuesday. USD/CAD held above 1.3920 after reaching a 2026 high of 1.3945 on Monday.
The US Dollar trend stayed positive even as the US Dollar Index eased. Reports that President Donald Trump may seek a swift end to the war in Iran lifted risk appetite in early Asian trading.
Trump Signals Potential Iran Exit
The Wall Street Journal reported on Tuesday that Trump told close aides he is willing to end the military campaign in Iran even if the Strait of Hormuz stays largely closed. The report said he sees reopening it as extending the war beyond five or six weeks, so he would leave that for later.
The report pushed the US Dollar lower against major peers as demand for safe assets eased. Asian markets fell moderately, while European and Wall Street futures pointed to a positive open.
Trump repeated a threat to destroy Iran’s energy plants if Tehran does not open the Strait of Hormuz. Iran rejected US peace proposals, launched more missiles at Israel, and Kuwaiti authorities reported an attack on an oil tanker anchored at Doha harbour.
On Monday, Federal Reserve Chair Jerome Powell played down expectations of an immediate rate rise and said inflation pressures are anchored for now. Treasury yields fell, adding pressure on the US Dollar.
Volatility Strategy Considerations
Given the conflicting signals, we see a high probability of sharp, unpredictable moves in the currency markets. The President’s comments on a swift end to the Iran conflict contrast sharply with the Fed’s dovish stance, creating an environment ripe for volatility. Derivative traders should consider strategies that profit from a large price swing, regardless of the direction.
We are seeing implied volatility on USD/CAD one-month options surge to levels not seen since the energy market turmoil in 2025. This indicates the market is pricing in a significant move as traders hedge against both a sudden peace deal or a major escalation in the conflict. Buying options, such as a straddle, could be an effective way to position for this uncertainty.
The situation is further complicated by oil prices, with West Texas Intermediate (WTI) crude currently holding above $95 per barrel due to the risk in the Strait of Hormuz. Normally, this would strengthen the Canadian dollar, but the overwhelming safe-haven demand for the US dollar is overriding this effect. A sudden resolution in Iran could cause both oil prices and the USD to fall simultaneously, leading to a complex reaction in USD/CAD.
The Fed’s recent communication adds another layer of risk for those holding long US dollar positions. According to the CME’s FedWatch tool, futures markets are now pricing in less than a 10% chance of an interest rate hike by June, a dramatic reversal from over 50% just last month. This dovish shift could quickly undermine the dollar’s strength if geopolitical tensions ease even slightly.
This reminds us of market reactions during the initial phases of past Middle East conflicts, where sharp risk-off rallies were often followed by equally sharp reversals on news of de-escalation. The current situation, with Trump’s rhetoric on one hand and ongoing missile attacks on the other, creates the perfect setup for a whipsaw market. We should therefore be prepared for the USD/CAD pair to violently reverse its recent gains.
Create your live VT Markets account and start trading now.
Start trading now – Click here to create your real VT Markets account
Tokyo’s March core CPI rose 1.7% year on year, below forecasts, as fuel subsidies reduced the impact of higher costs. An index excluding fresh food and fuel rose 2.3% after a 2.5% increase in February.
Higher oil prices and a weaker yen are expected to push inflation up. Markets are pricing a 70% chance of a Bank of Japan rate rise in April, with Governor Kazuo Ueda indicating that action is possible.
Growth Data And Near Term Context
February figures showed a 2.1% month-on-month fall in factory output and a 0.2% year-on-year drop in retail sales. These data are described as less relevant to current conditions.
The Q1 Tankan business survey is due next and is expected to inform the Bank of Japan ahead of its policy meeting. Rising energy costs and yen weakness may reduce household purchasing power and weigh on the recovery.
We see the market pricing a high probability of a Bank of Japan rate hike in April, driven by rising oil prices and a persistently weak yen. With USD/JPY having recently tested the 152 level, similar to the situation back in 2024, the pressure on the central bank to act is immense. Traders should consider buying puts on USD/JPY or establishing call spreads on the JPY to position for a potential strengthening of the currency.
The anticipation of this policy shift has pushed up implied volatility on yen currency pairs, making options more expensive. As of this morning, three-month implied volatility on USD/JPY is sitting near 9.5%, a significant jump from the lows we saw at the end of 2025. This suggests that while a hike is expected, the magnitude of the market’s reaction remains a key uncertainty.
Rates Positioning And Risk Assets
In the rates market, we are positioning for a steeper yield curve by selling short-term Japanese Government Bond (JGB) futures. This is a direct play on the Bank of Japan lifting its policy rate, a move that would echo the historic decision in March 2024 to end negative interest rates. Any hawkish surprise in the upcoming Tankan survey will only accelerate this repricing.
For equities, a rate hike could create headwinds for the Nikkei 225, which has been hovering near all-time highs above 40,000 points. We are hedging long equity portfolios by purchasing out-of-the-money puts on Nikkei futures. Looking back at the market’s initial wobble after the 2024 hike, we see a precedent for short-term weakness even if the long-term trend remains positive.
These pressures are not happening in a vacuum, as WTI crude oil is now firmly above $85 per barrel, directly feeding into inflation and squeezing consumer spending. The drop in February retail sales, although dated, highlights the fragility of the consumer. This combination of external cost pressures and a weak currency gives the Bank of Japan very little room to remain accommodative.
Create your live VT Markets account and start trading now.
Start trading now – Click here to create your real VT Markets account
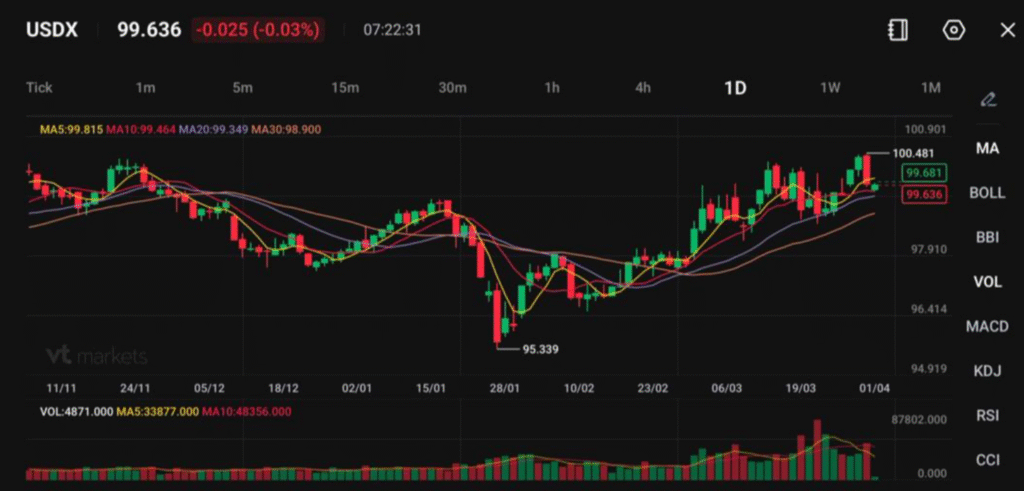
USDX trades at 99.636, down 0.025 (-0.03%), while Reuters reported the broader dollar index at 99.79, still close to recent highs.
Traders now price a 64.4% probability that the Fed stays on hold in December, up from 60.2% a day earlier.
USDJPY trades near 158.73 to 159.45, with the yen recovering from this year’s low at 160.46 as intervention fears ease and BOJ hike expectations build.
The dollar eased slightly in Asian trade, but it has not lost its broader footing. Reuters reported the USDX at 99.79, down marginally on the day after a strong prior-session gain, while your chart shows USDX at 99.636, down 0.03%.
The move reflects a market that has stopped chasing the dollar higher for now, but has not found a clear reason to abandon it either.
Ceasefire hopes are the immediate reason for the pause. Traders have become a little less aggressive about buying dollars as headlines suggest Washington may be looking for an off-ramp in the Iran war.
US Secretary of State Marco Rubio said Washington could see the ‘finish line’ in the Iran war, which is now in its fifth week, and the US will have to reexamine ties with NATO after the conflict https://t.co/zcdVcXiPwb
At the same time, mixed signals from the White House, the Pentagon, and regional allies have kept conviction low. Markets are still trading headline to headline rather than building strong directional positions.
A softer dollar here looks more like consolidation than reversal. The greenback still holds support from its safe-haven status and from the fact that the US is better insulated from oil disruption than major importers. Reuters noted that the dollar has benefited from that relative position since the conflict began in late February.
Fed Expectations Have Shifted Toward a Longer Hold
The rates market has changed the tone. Fed funds futures now imply a 64.4% probability that the Fed remains on hold in December, up from 60.2% the day before. That is a clear sign that traders are backing away from the idea of an easier policy later this year.
Federal Reserve Bank of Kansas City Jeff Schmid cautioned that the US central bank should not look through the impact on inflation of a surge in energy prices stemming from the conflict in Iran https://t.co/x1zaygEbtU
Oil has driven much of that repricing. The closure of the Strait of Hormuz pushed energy prices sharply higher, and that forced markets to revisit inflation assumptions.
A ceasefire and a sharp drop in oil could remove the inflation premium from rates quickly, but until that happens, traders are still reacting to the shock already in the system.
That backdrop keeps the dollar supported even as it pauses. Higher-for-longer Fed pricing makes it harder for the greenback to weaken much unless the data softens or oil drops decisively.
Euro Has Started to Stabilise
The euro has found a little support as the dollar stalls. Reuters reported EURUSD at $1.1565, while your chart shows 1.14696, which suggests the market has been volatile across sessions. In Reuters’ reporting, the euro has started to stabilise after the ECB opened the door to rate hikes if war-driven inflation lasts.
ECB Governing Council member Boris Vujcic said the increase in inflation expectations since the Iran war broke out isn’t a surprise https://t.co/WfYGNH8s6G
Societe Generale said a euro bounce is possible if the ECB hikes while the Fed stands aside.
That does not mean the euro has a clean path higher. Europe still faces greater energy-shock exposure than the US, so any sustained advance in EURUSD would likely require both lower oil prices and a firmer ECB stance.
Technical Analysis
US Dollar Index (USDX) is trading near 99.63, pulling back slightly after testing highs around the 100.40–100.50 region. Price action shows the dollar pausing just below resistance, with the recent rally losing some momentum as the market consolidates near the upper end of its range.
From a technical standpoint, the trend remains mildly bullish. Price is holding above the 20-day (99.34) and 30-day (98.90) moving averages, which continue to slope upward and provide underlying support. The 5-day (99.81) and 10-day (99.46) are clustered close to current levels, reflecting short-term indecision as price compresses just below resistance.
Key levels to watch:
Support: 99.30 → 98.90 → 97.90
Resistance: 100.40 → 100.70 → 101.00
The index is currently consolidating below the 100.40–100.50 zone, which has capped recent upside attempts. A sustained break above this level could trigger further gains toward 100.70 and potentially 101.00, especially if momentum builds.
On the downside, 99.30 is acting as immediate support. A break below this level could lead to a pullback toward 98.90, though such a move would likely remain corrective as long as the broader structure holds.
Overall, the USDX remains in a gradual uptrend, with current price action suggesting consolidation rather than reversal. However, with price sitting just below key resistance, traders should watch closely for either a breakout or a deeper pullback as the next directional move develops.
What Traders Should Watch Next
Friday’s US jobs report is the next big macro test. Reuters said economists expect 60,000 jobs added in March after an unexpected 92,000 loss in February. A weak print would likely revive Fed cut expectations and pressure the dollar. A firmer print would reinforce the current higher-for-longer stance.
The other driver is still oil. A clear de-escalation that reopens Hormuz and pushes crude lower would take some of the inflation premium out of rates and remove support from the dollar. Another escalation would do the opposite.
Why is the US Dollar Holding Near 100 Instead of Breaking Higher?
The dollar is still supported by safe-haven demand and a more cautious Fed outlook, but ceasefire hopes have reduced the urgency of fresh defensive buying. Reuters reported the dollar index near 99.79, while your chart shows USDX at 99.636, both still close to recent highs.
What is Keeping the Dollar Supported Right Now?
Three forces are doing most of the work: Middle East uncertainty, higher-for-longer Fed pricing, and the US economy’s relative insulation from oil shocks as a net energy exporter. Reuters said those factors have kept the greenback supported since the conflict began in late February.
Why Did the Dollar Ease if Geopolitical Risks Are Still High?
Markets started to price a possible off-ramp in the conflict after comments from US officials suggested the war could end within weeks. At the same time, Pentagon and regional headlines still pointed to escalation risk, which left traders cutting back aggressive dollar longs rather than fully reversing them.
What Do Markets Expect From the Federal Reserve Now?
Fed funds futures imply a 64.4% probability that the Fed stays on hold in December, up from 60.2% a day earlier. That shift shows traders are still leaning toward a longer hold because oil-driven inflation risk has not cleared.
Why Do Oil Prices Matter So Much for the Dollar Index?
Higher oil prices lift inflation expectations and reduce the chance of near-term Fed easing. That tends to support the dollar, especially when the US is less exposed to imported energy than Europe or Japan. Reuters said traders are still reacting to the inflation premium created by the Hormuz shock.
Start trading now – Click here to create your real VT Markets account
The Nikkei 225 rose 3.58% to 52,889.85, while the broader Topix gained 2.5% to 3,648.78.
The BOJ Tankan showed large manufacturers’ sentiment at +17 versus a +16 forecast, while large non-manufacturers came in at +36 against a +33 forecast.
WTI crude fell $1.28, or 1.24%, to $101.60, easing some pressure on Japan’s import-heavy economy.
Japanese equities bounced hard after oil prices pulled back and Wall Street delivered a strong lead. The Nikkei 225 climbed 3.58% to 52,889.85, snapping a four-session losing streak, while the Topix rose 2.5% to 3,648.78.
Japanese shares rebounded after Donald Trump signaled the US aims to end its war with Iran within the next three weeks https://t.co/auPsWk4D0x
Lower crude prices gave traders a reason to buy risk again. Japan imports most of its energy, so a drop in oil cuts pressure on company costs, household spending, and inflation expectations. Reports that Washington was willing to push for a diplomatic reopening of the Strait of Hormuz helped drive WTI down $1.28 to $101.60 per barrel.
The rebound was strong, but the market is still trading off headline risk. Oil remains high, and the Middle East conflict has not been resolved.
Tankan Data Supports the Bounce
The latest BOJ Tankan survey gave the market a second reason to rally. Large manufacturers’ sentiment rose to +17 in March from +15 in December, beating the +16 forecast. Large non-manufacturers improved to +36 from +34, ahead of the +33 forecast.
The survey showed firms were holding up better than expected even after the energy shock. Reuters also reported that large companies plan to raise capital expenditure by 3.3% in fiscal 2026, above the 3.0% median forecast.
That mix supported the rebound because it suggested the corporate sector had not rolled over. The outlook components were softer, though, so companies are still preparing for a tougher backdrop if energy prices rise again.
Global Markets Add Support
Wall Street handed Asia a strong lead. The Nasdaq rose 3.8%, the S&P 500 gained 2.9%, and the Dow added 2.5%. European markets also closed higher, with the CAC 40 up 0.6% and both the DAX and FTSE 100 up 0.5%.
The yen also moved away from the most pressured part of its recent range. Reuters reported it traded near 158.55 per dollar, firmer than the 160.46 low seen earlier this year.
The yen’s weakness has become a growing concern for Japan’s policymakers, given its impact on import prices and household costs. Here's what is causing the volatility – and what to look out for next https://t.co/N2eBTCDSfd
A steadier yen reduces some of the stress around imported inflation, even if it trims part of the export boost from a weaker currency.
Technical Analysis
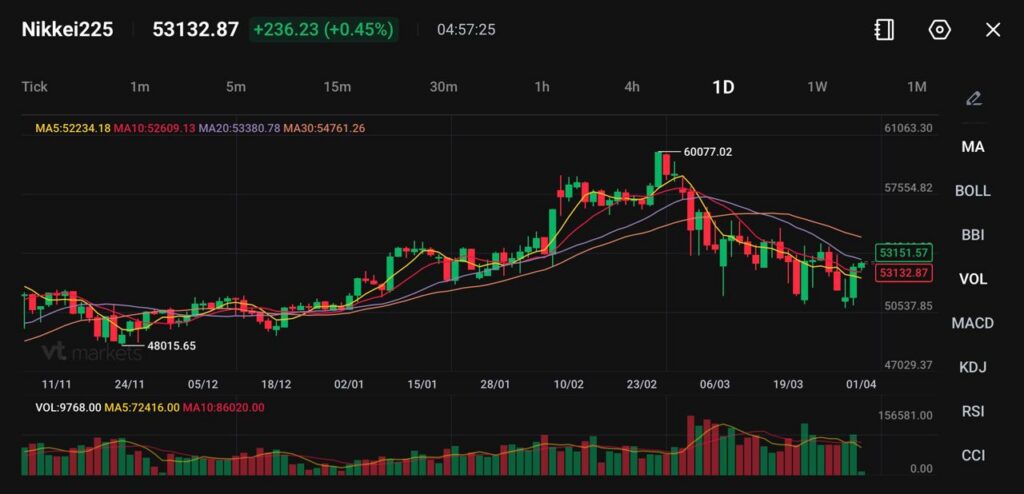
Nikkei 225 is trading near 53,130, attempting a modest rebound after a sustained pullback from the 60,077 high. Price action shows the market trying to stabilise after a series of lower highs and lower lows, though upside momentum remains limited as the index continues to trade below key resistance levels.
From a technical standpoint, the trend has shifted to neutral to bearish in the short term. Price is trading below the 10-day (52,609) and 20-day (53,380) moving averages, which are now acting as overhead resistance, while the 30-day (54,761) continues to slope downward, reinforcing the loss of upward momentum. The 5-day (52,234) is beginning to turn higher, suggesting a short-term bounce, but this remains corrective unless stronger follow-through develops.
Key levels to watch:
Support: 50,500 → 48,000 → 47,000
Resistance: 53,400 → 54,700 → 57,500
The index is currently testing the 53,300–53,400 zone, which aligns with the 20-day average and has capped recent recovery attempts. A sustained break above this area could open the way toward 54,700, where the 30-day average may present stronger resistance.
On the downside, 50,500 remains the key near-term support. A break below this level would signal renewed selling pressure and could expose a move toward 48,000.
Overall, the Nikkei 225 is in a corrective phase following its earlier rally, with price still struggling to reclaim key moving averages. Unless the index can push decisively above the 53,400 level, rallies are likely to face resistance, keeping the near-term bias tilted to the downside.
What Traders Should Watch Next
The next move depends on whether oil stays off the highs, whether the Iran conflict cools further, and whether Japanese data keeps showing resilience. Another drop in crude would support importers, banks, and domestic cyclicals. A fresh spike in energy prices would put inflation and margins back under pressure quickly.
The Nikkei 225 rose 3.58% to 52,889.85 as lower oil prices eased pressure on Japan’s import-heavy economy and stronger global equities improved risk appetite.
How Did Falling Oil Prices Help Japanese Stocks?
Japan imports most of its energy, so lower crude prices reduce cost pressure on companies, ease imported inflation, and support household spending. WTI fell $1.28, or 1.24%, to $101.60 in the move that helped lift sentiment.
What Did the Tankan Survey Show?
The BOJ Tankan showed large manufacturers’ sentiment at +17 versus a +16 forecast, while large non-manufacturers came in at +36 against a +33 forecast. Large firms also planned 3.3% capex growth for fiscal 2026, ahead of the 3.0% median forecast.
Why Did Exporters, Banks, and Chip Stocks Lead the Rally?
Exporters benefited from improved global sentiment, banks tracked the rebound in cyclical risk appetite, and chip names followed the strong move in US tech. The session also showed broad participation, which gave the rebound more strength than a narrow bounce.
Why Did Inpex Lag The Market?
Lower oil prices reduced support for energy producers, and Inpex fell 2.6% while most of the broader market rallied.
Start trading now – Click here to create your real VT Markets account
Silver (XAG/USD) pulled back from a four-day high in the mid-$73.00s reached on Tuesday. It traded just above $72.00 in early European hours, up 3.0% on the day and rising for a third session.
The near-term setup stays bearish while price remains below the 100-day Simple Moving Average (SMA) near $75. The 100-day SMA is rising but is acting as resistance, as silver moves towards the 200-day Exponential Moving Average (EMA) near $63.
Bearish Momentum Signals
Momentum signals point lower, with the MACD (12, 26, 9) below its signal line and in negative territory, and a weak histogram. The Relative Strength Index (RSI) is 41.83, below 50, indicating ongoing selling pressure rather than oversold conditions.
Support is near $69.00, with the recent low at $67.85 underneath. A break below this zone may open a move towards $63.00, where the 200-day EMA is located.
Resistance is around $75.00, where the 100-day SMA meets a prior breakdown area. A daily close above $75.00 could reduce bearish pressure and leave $80.00 as the next barrier.
The note states the technical analysis was produced with help from an AI tool.
Trading Implications And Key Risks
Given the technical pressure on silver, we should view the current rally toward the mid-$73.00s as a potential selling opportunity. The $75.00 level, where the 100-day moving average sits, represents a formidable ceiling. For derivative traders, this suggests establishing short positions or buying put options on any sign of weakness below this key resistance in the coming days.
This bearish view is supported by the broader economic environment, as the latest US inflation figures for February 2026 came in slightly above expectations at 3.4%. This data makes it less likely the Federal Reserve will rush to cut interest rates, which provides underlying support for the US dollar. A stronger dollar is typically a headwind for silver prices, reinforcing the negative technical signals.
We are also seeing sentiment turn against precious metals, as the most recent Commitment of Traders report shows managed money has been cutting its net long exposure to silver futures. In addition, major silver-backed ETFs have recorded net outflows of over 12 million ounces in the first quarter of 2026, indicating that investment demand is softening. This lack of buying interest from large players makes a sustained rally less probable.
A potential strategy is to target a move down to the initial support area around $69.00. We recall a similar technical pattern in the third quarter of 2025, where a failure at the 100-day SMA led to a quick retest of lower support levels. If the $67.85 low is breached, the primary target becomes the 200-day average near $63.00, which offers a more attractive risk-reward for bearish plays.
The main risk to this outlook is a decisive daily close above the $75.00 resistance zone. Such a move would invalidate the current bearish structure and could force a quick covering of short positions, potentially pushing prices toward the $80.00 barrier. Therefore, any short positions should have a defined stop-loss just above the $75.00 mark to manage this risk effectively.
Create your live VT Markets account and start trading now.
Start trading now – Click here to create your real VT Markets account
New Bank of Japan data indicate underlying inflation is near or above the target and the output gap is positive. With USD/JPY testing 160, the risk of a Bank of Japan rate rise before Standard Chartered’s Q3 baseline has increased.
Standard Chartered says there is still a high hurdle for the Bank of Japan to meet market expectations of two rate hikes in 2026. The bank also notes that market pricing for roughly two Bank of Japan hikes by December stayed stable in March.
Rising Volatility Risks Around Usd Jpy
The analysis points to policy remaining accommodative, using a benchmark rate of 0.75% that is below the estimated neutral rate range. It links this backdrop to bear steepening in the 2Y/10Y Japanese government bond spread since the outbreak of the war, reflecting inflation risks tied to higher fuel costs.
It contrasts this with other developed markets, where 2Y/10Y spreads have mostly bear flattened. That pattern is attributed to policy rate increases being priced back in after the recent oil price shock.
The article states it was produced with the help of an AI tool and reviewed by an editor.
With USD/JPY now testing the 160 level, the risk of a Bank of Japan (BoJ) rate hike coming sooner than our Q3 expectation has grown significantly. We are watching for a potential spike in currency volatility, especially recalling the Ministry of Finance’s interventions back in 2024 when the pair crossed similar thresholds. As of this morning, the pair is trading around 159.85, putting immense pressure on policymakers.
Potential Boj Hike Timeline
The BoJ is falling behind the curve, and recent data supports this view. The latest core inflation reading for February 2026 came in at 2.3%, remaining above the bank’s 2% target, while strong Q4 2025 GDP growth of 0.5% confirms the economy has a positive output gap. With a policy rate of just 0.75%, the current monetary stance is far too loose for these conditions.
For derivative traders, this situation signals an opportunity to position for increased price swings in the coming weeks. We believe buying short-dated USD/JPY options, like one-month straddles, is a sound strategy to capitalize on this building tension. This allows a trader to profit from a large move in either direction, whether from a surprise hike or a decisive break above 160.
The Japanese government bond market is also sending unique signals about lingering inflation risks. We see the 2-year/10-year yield spread continuing to steepen, meaning long-term borrowing costs are rising faster than short-term ones. This is different from other developed markets, where a fear of immediate hikes is causing yield curves to flatten.
Despite the drama at the 160 level, the swaps market has remained stable, pricing in roughly two rate hikes by December 2026. We remember how the BoJ moved very cautiously throughout 2025, which suggests the hurdle to meet even this pricing is high. Any action or inaction that challenges this two-hike consensus will create a significant trading opportunity.
Create your live VT Markets account and start trading now.
Start trading now – Click here to create your real VT Markets account
The Reserve Bank of Australia (RBA) said it cannot forecast the cash rate path with confidence because of uncertainty over the breadth and duration of the Middle East conflict. The minutes noted that oil price moves are a key risk to the outlook.
The RBA estimated that oil staying around $100 would push headline CPI to about 5% in Q2. This would be 0.75% higher than expected in February, and the minutes said persistently higher oil prices would lift inflation more widely over time.
Policy Outlook Under Oil Price Uncertainty
A majority of policymakers considered further policy tightening likely in the near term. A minority raised concerns about the risk of stagflation.
Separately, the text reported that about half a million young Australian workers will receive up to a 42% pay increase linked to changes in minimum wage rates. The article stated it was produced with help from an AI tool and reviewed by an editor.
We see the RBA’s stated uncertainty playing out as we head into the second quarter of 2026. Back in 2025, we saw inflation moderate, but with Brent crude now hovering near $98 a barrel, that progress is at risk. This brings the central bank’s old forecast of 5% headline CPI directly into the spotlight for the coming months.
This high degree of uncertainty suggests traders should consider buying volatility on Australian interest rate futures. The RBA is clearly split between fighting inflation and worrying about stagflation, meaning their next moves are genuinely unpredictable. This environment makes strategies that profit from a large move in either direction, rather than a specific directional bet, more appealing.
Implications For Rates Wages And Currency Markets
We cannot forget the domestic wage pressures that were flagged, which continue to be a factor. The latest data from the end of 2025 showed the Wage Price Index was still elevated at 4.2%, confirming that inflation has deep domestic roots beyond just energy costs. This gives the more hawkish members of the RBA board ammunition to argue for further tightening.
For currency traders, this puts the Australian dollar in a difficult position, creating opportunities in the options market. While higher interest rates should be supportive, the risk of a sharp economic slowdown could weigh heavily on the currency. Therefore, positioning for a wider trading range in AUD/USD seems more sensible than betting on a breakout in one direction.
Create your live VT Markets account and start trading now.
Start trading now – Click here to create your real VT Markets account
German retail sales fell again in February, based on figures from Destatis. Sales dropped by 0.6% month-on-month, compared with a forecast rise of 0.2%.
January sales were revised down to a 1.1% monthly fall from -0.9%. On a year-on-year basis, retail sales rose by 0.7%, below the 1% forecast and down from the previous 1.2%.
Euro Reaction After The Release
There was no immediate move in the euro after the release. At the time of reporting, EUR/USD was slightly higher at about 1.1470.
Retail sales data from Statistisches Bundesamt Deutschland track short-term changes in sales across Germany’s retail sector. The monthly percentage change is used as an indicator of consumer spending and is often monitored for possible effects on the euro.
We remember looking at German retail sales data from February 2025, which showed a surprising contraction and a downward revision for the prior month. This data pointed toward weakness in the German consumer, a trend that warrants close attention. That annualized growth of only 0.7% last year was an early warning sign for the broader Eurozone economy.
That pattern of consumer weakness appears to be continuing into this year. The latest data for February 2026, released just weeks ago, showed another monthly decline of 0.4%, defying expectations for a modest rebound. This confirms that the consumer spending issue we saw developing in 2025 has not yet been resolved and may be deepening.
Implications For Traders And The Euro
This persistent weakness, combined with the latest Eurozone manufacturing PMI which printed at a contractionary 47.8, puts pressure on the European Central Bank. While the March flash HICP inflation estimate held at 2.6%, the deteriorating growth outlook complicates the ECB’s policy path. We believe this increases the probability of the central bank signaling a more dovish stance in the coming months.
For traders, this outlook suggests considering downside protection on the Euro. Buying EUR/USD put options with an expiry in late April or May could be a prudent way to position for a potential slide. This strategy offers a defined risk while providing exposure to any negative reaction from upcoming ECB commentary or data releases.
Volatility in the currency markets may also present an opportunity. With the market uncertain about the timing of any potential ECB rate cut, options pricing may not fully reflect the risk of a sharp move. We see value in looking at short-dated volatility instruments tied to the Euro, as a surprise in either growth or inflation data could trigger a significant repricing.
Specifically, with EUR/USD currently trading around 1.0830, we are monitoring key support levels. Any break below the 1.0800 psychological level could accelerate selling pressure. Therefore, puts with strike prices around 1.0750 could offer an effective hedge against a fresh downturn in the currency pair.
Create your live VT Markets account and start trading now.
Start trading now – Click here to create your real VT Markets account
The US Dollar rose for a seventh straight day against the Canadian Dollar on Tuesday. USD/CAD held above 1.3920 after reaching a 2026 high of 1.3945 on Monday.
The US Dollar trend stayed positive even as the US Dollar Index eased. Reports that President Donald Trump may seek a swift end to the war in Iran lifted risk appetite in early Asian trading.
Trump Signals Potential Iran Exit
The Wall Street Journal reported on Tuesday that Trump told close aides he is willing to end the military campaign in Iran even if the Strait of Hormuz stays largely closed. The report said he sees reopening it as extending the war beyond five or six weeks, so he would leave that for later.
The report pushed the US Dollar lower against major peers as demand for safe assets eased. Asian markets fell moderately, while European and Wall Street futures pointed to a positive open.
Trump repeated a threat to destroy Iran’s energy plants if Tehran does not open the Strait of Hormuz. Iran rejected US peace proposals, launched more missiles at Israel, and Kuwaiti authorities reported an attack on an oil tanker anchored at Doha harbour.
On Monday, Federal Reserve Chair Jerome Powell played down expectations of an immediate rate rise and said inflation pressures are anchored for now. Treasury yields fell, adding pressure on the US Dollar.
Volatility Strategy Considerations
Given the conflicting signals, we see a high probability of sharp, unpredictable moves in the currency markets. The President’s comments on a swift end to the Iran conflict contrast sharply with the Fed’s dovish stance, creating an environment ripe for volatility. Derivative traders should consider strategies that profit from a large price swing, regardless of the direction.
We are seeing implied volatility on USD/CAD one-month options surge to levels not seen since the energy market turmoil in 2025. This indicates the market is pricing in a significant move as traders hedge against both a sudden peace deal or a major escalation in the conflict. Buying options, such as a straddle, could be an effective way to position for this uncertainty.
The situation is further complicated by oil prices, with West Texas Intermediate (WTI) crude currently holding above $95 per barrel due to the risk in the Strait of Hormuz. Normally, this would strengthen the Canadian dollar, but the overwhelming safe-haven demand for the US dollar is overriding this effect. A sudden resolution in Iran could cause both oil prices and the USD to fall simultaneously, leading to a complex reaction in USD/CAD.
The Fed’s recent communication adds another layer of risk for those holding long US dollar positions. According to the CME’s FedWatch tool, futures markets are now pricing in less than a 10% chance of an interest rate hike by June, a dramatic reversal from over 50% just last month. This dovish shift could quickly undermine the dollar’s strength if geopolitical tensions ease even slightly.
This reminds us of market reactions during the initial phases of past Middle East conflicts, where sharp risk-off rallies were often followed by equally sharp reversals on news of de-escalation. The current situation, with Trump’s rhetoric on one hand and ongoing missile attacks on the other, creates the perfect setup for a whipsaw market. We should therefore be prepared for the USD/CAD pair to violently reverse its recent gains.
Create your live VT Markets account and start trading now.
Start trading now – Click here to create your real VT Markets account