Sentiment Analysis In Financial Trading: What You Need to Know

Immediately after Donald Trump became the 47th President of the United States on 6 November 2024, the main indices recorded impressive gains.

The Dow Jones Industrial Average surged over 1,500 points, reaching an all-time high. The last time the Dow jumped over 1,000 points in a single day was in November 2022.

The S&P 500 rose by 2.5%, while the Nasdaq climbed 3%, with both indices hitting record highs.

The Russell 2000 Index, which tracks 2,000 small-cap companies, recorded a 5.8% increase.

Major bank stocks also strengthened, with gains of 11.5%, 8.4%, and 13% for JPMorgan, Bank of America, and Wells Fargo, respectively.

The question is: why did the US stock market exhibit bullish behaviour following the election result announcement?

The answer is simple – market sentiment.

What Is Market Sentiment?

Imagine overhearing a conversation between two of your colleagues who are active forex traders.

Colleague A says, “I’m confident the market will be bullish today.”
Colleague B disagrees, replying, “Who says so? Today is going to be a sell-off!”

This opposing sentiment between the two reflects the reality of the financial market: a collective outcome of all market participants’ views, ideas, and opinions.

This mixed emotional state is referred to as market sentiment because financial markets are driven by emotion.

When sentiment analysis is given equal attention alongside technical and fundamental analysis, traders move closer to making more accurate decisions.

Sentiment Analysis As A Means To Measure Market Sentiment

Market sentiment can be gauged using sentiment analysis. This involves assessing the emotions and opinions of market participants towards a particular asset or market.

Sentiment analysis is essential for understanding market dynamics, as it helps traders evaluate the prevailing mood of the market, whether bullish (optimistic) or bearish (pessimistic).

It uses computational techniques to determine whether information from news sources and social media forms a positive, negative, or neutral sentiment.

In trading, this analysis offers insights into market emotions and behaviours. When combined with technical and fundamental indicators, sentiment analysis can assist traders in making more precise market entry decisions.

Types Of Indicators In Sentiment Analysis

1. CBOE Volatility Index (VIX)

Also known as the ‘fear index’, the VIX measures market volatility and investor sentiment regarding future price movements.

A high VIX indicates increased fear or uncertainty in a market with bearish sentiment.
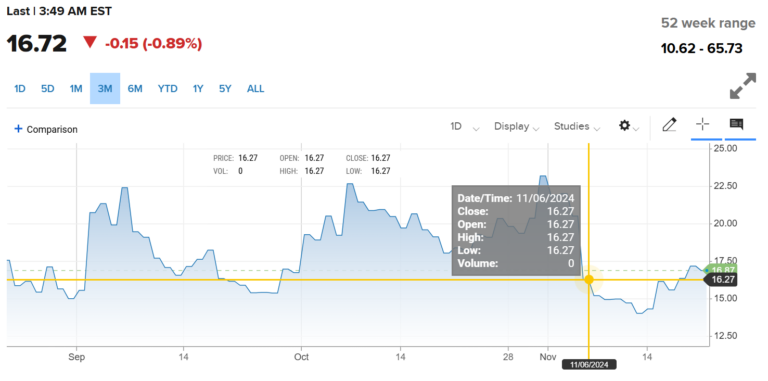
VIX from CNBC

2. Bullish Percent Index (BPI)

BPI shows the percentage of stocks in an index with bullish momentum. The higher the BPI, the stronger the bullish sentiment among investors.

3. High-Low Index

This indicator compares the number of stocks reaching 52-week highs with those hitting 52-week lows. A high ratio indicates bullish sentiment, while a low ratio signals bearish sentiment.

4. Put/Call Ratio

This indicator compares the volume of put options to call options. A high put/call ratio suggests bearish sentiment, while a low ratio indicates bullish sentiment.

5. Advance-Decline Line (ADL)

The ADL tracks the difference between the number of advancing and declining stocks. An upward trend in ADL implies bullish sentiment; a downward trend suggests bearish sentiment.

6. Social Media Sentiment Analysis

Traders can use algorithms to assess sentiment on social media platforms, like Twitter and Reddit. This analysis is useful for gauging public opinion on a particular asset.

7. News Sentiment Analysis

News headlines and articles can provide insight into traders’ views on the market. Optimistic, pessimistic, or neutral tones in the news can shift public perception.

8. Commitment of Traders (COT) Report

This report holds unique importance in the futures market, offering valuable insights into the positions held by traders.
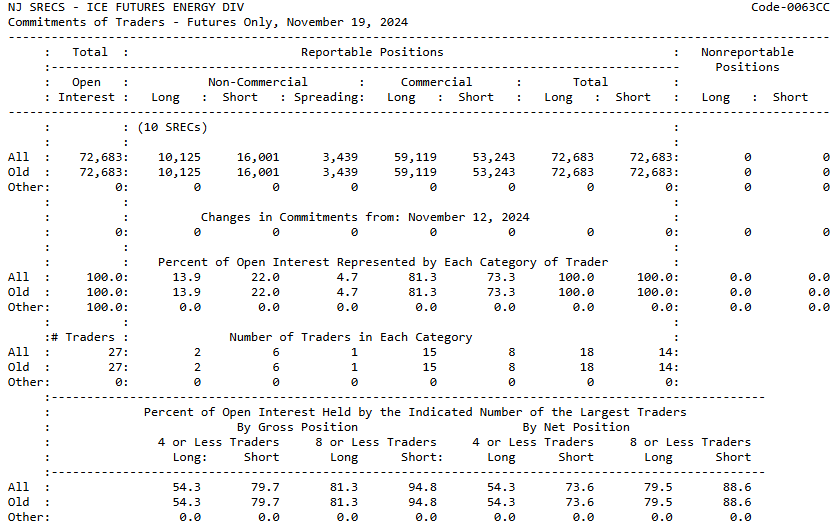
An example of a COT report from the Commodity Futures Trading Commission

It can be used to inform buy or sell decisions. There are four types of COT reports: Legacy, Supplemental, Disaggregated, and Traders in Financial Futures.

Risks Of Relying Solely On Sentiment Analysis

5 Ways To Apply Sentiment Indicators In Trading Strategies

1. Combine Sentiment Analysis With Technical And Fundamental Analysis

The best way to gain a complete market picture is by integrating sentiment indicators with technical and fundamental analysis. This combination helps validate signals and improve decision accuracy.

Divergence analysis can identify divergence between sentiment indicators and price movements. For example, if sentiment is bullish but prices are falling, this may indicate a possible reversal.

2. Monitor Extreme Market Sentiment

Use sentiment indicators to identify extreme bullish or bearish levels, which may signal market peaks or troughs. For example, a high put/call ratio might indicate strong bearish sentiment and present a buying opportunity.

3. Risk Management

Incorporate sentiment analysis as one component of risk management. For instance, if an indicator shows extreme bullish sentiment, consider reducing exposure to the market to minimise losses from a potential correction.

In volatile markets, use hedging strategies based on prevailing sentiment to protect against adverse price movements.

4. Stay Informed With Market News

News developments can influence market sentiment. Shifts in public perception can change market dynamics. Therefore, being attentive to news is key to making informed decisions.

Leverage social media sentiment analysis to assess public opinion in real time, as social media activity often reflects investor mood immediately.

5. Test And Improve Strategies

Always backtest strategies involving sentiment indicators to assess their performance in different market conditions.

Be ready to adapt strategies in response to changing market environments and evolving sentiment trends. Flexibility is key to maintaining a competitive edge in trading.

Final Words

You now understand that financial markets are driven not only by economic data and news, but also by trader emotions.

By paying attention to market sentiment, you can gain insight into market psychology, identify potential reversal points, and avoid poor decision-making.
Open a live trading account with us today.

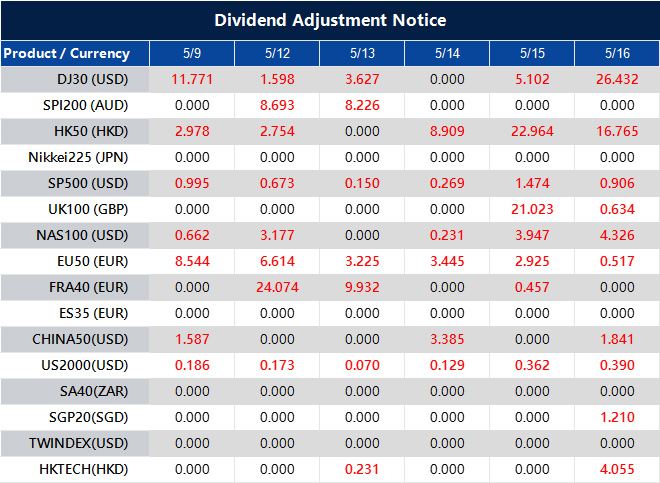
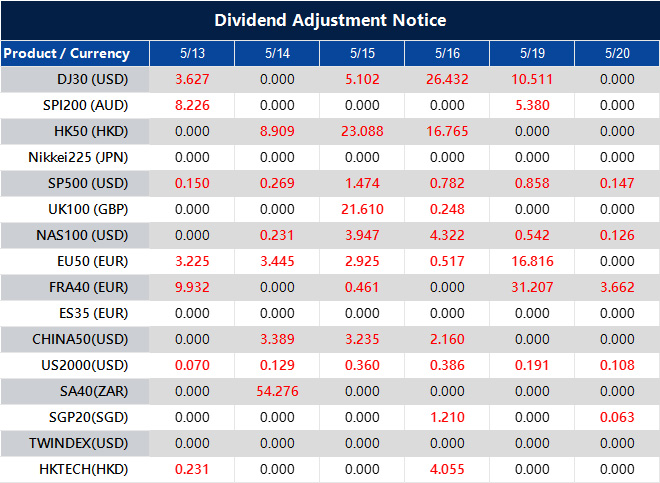
Dividend Adjustment Notice – May 13 ,2025

Dear Client,

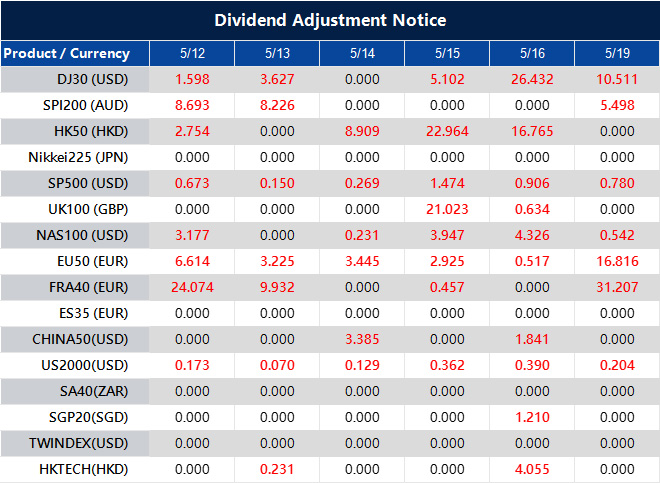
Please note that the dividends of the following products will be adjusted accordingly. Index dividends will be executed separately through a balance statement directly to your trading account, and the comment will be in the following format “Div & Product Name & Net Volume”.

Please refer to the table below for more details:

Dividend Adjustment Notice

The above data is for reference only, please refer to the MT4/MT5 software for specific data.

If you’d like more information, please don’t hesitate to contact [email protected].

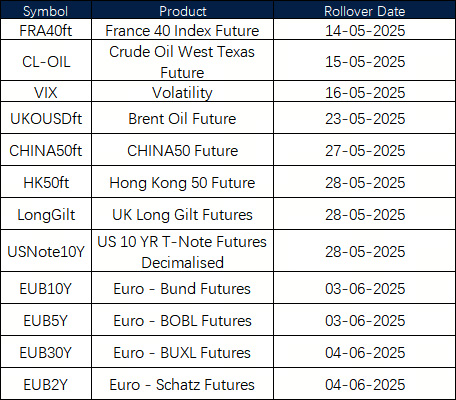
May Futures Rollover Announcement – May 13 ,2025

Dear Client,

New contracts will automatically be rolled over as follows:

May Futures Rollover Announcement

Please note:
• The rollover will be automatic, and any existing open positions will remain open.
• Positions that are open on the expiration date will be adjusted via a rollover charge or credit to reflect the price difference between the expiring and new contracts.
• To avoid CFD rollovers, clients can choose to close any open CFD positions prior to the expiration date.
• Please ensure that all take-profit and stop-loss settings are adjusted before the rollover occurs.
• All internal transfers for accounts under the same name will be prohibited during the first and last 30 minutes of the trading hours on the rollover dates.

If you’d like more information, please don’t hesitate to contact [email protected].

Week Ahead: Trade Progress And Diplomatic Dialogue Lift Market Mood

Global equity markets enter the week with a cautious sense of optimism, fuelled by diplomatic breakthroughs, promising trade developments, and easing geopolitical tensions. After an extended period of market swings and headline overload, recent strides in economic and foreign policy have ushered in a rare moment of relative calm for investors, albeit a potentially short-lived one.

The most prominent catalyst has been renewed confidence from US President Donald Trump, who urged Americans to ‘buy now’ in anticipation of what he dubbed a major economic upswing. He cited progress on a UK-US trade accord and ongoing dialogue with China, suggesting that the US economy is on the brink of a new growth phase. According to the White House, the UK deal alone is projected to unlock $6 billion in tariff revenues and generate $5 billion in fresh export flows, figures used to justify the recent market rally.

While the UK agreement has already been implemented, removing duties on strategic goods such as aluminium and steel, US-China negotiations remain ongoing. Trump referred to last week’s discussions in Switzerland as a potential ‘complete reset,’ aimed at defusing the tariff conflict and expanding US access to Chinese markets. No official breakthrough has been reached, but markets are responding positively to signs that further tariff reductions could be on the table.

Elsewhere, diplomatic progress is lending additional support. A ceasefire between India and Pakistan, though delicate, has helped lower tensions in a traditionally unstable region. Meanwhile, Russia’s renewed push for direct dialogue with Ukraine has revived hopes for movement in the long-standing Eastern European conflict. Despite some early breaches of the ceasefire, traders appear more attuned to the broader diplomatic shift than to short-term instability.

Market Movements This Week

This week’s price action is unfolding under the twin influences of geopolitical easing and central bank vigilance. From commodities and currencies to major indices, traders are sharpening their focus on structural levels and evolving macro narratives. While sentiment has improved in areas, especially amid positive trade developments, markets remain in a transitional phase, neither fully risk-embracing nor entirely defensive.

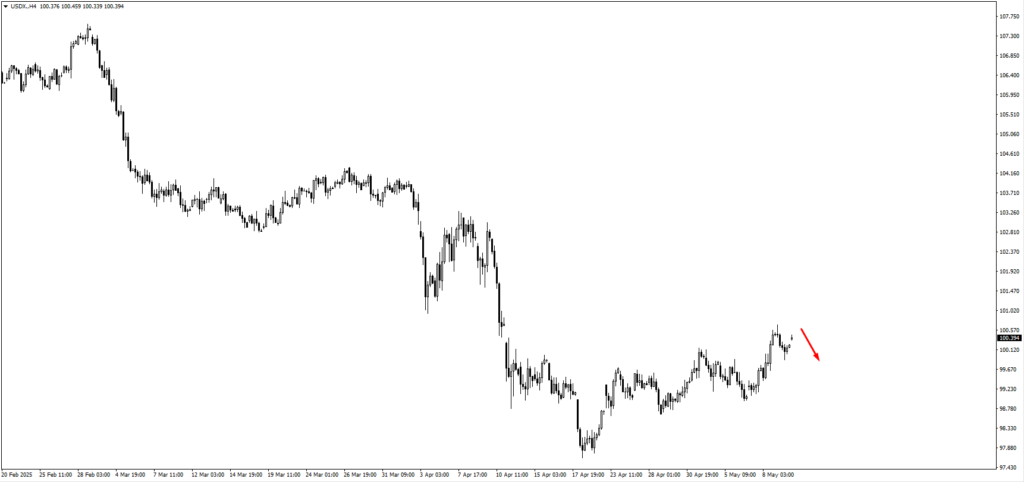
The US Dollar Index (USDX) retreated from the 100.60 resistance zone, ahead of the forthcoming US inflation data. Consumer Price Index (CPI) figures are forecast at 2.4%, with Core CPI anticipated at 2.8%. These data points could prove pivotal in determining whether the dollar’s recent bounce is losing steam. Should the index hover around its current range, a test of the 102.00 level remains possible, though emerging bearish signals could hinder further gains if inflation disappoints.

EUR/USD climbed from the 1.1200 level, signalling mild bullish momentum. A continued hold above this mark may open the path higher, though any dip toward 1.0970 will be closely watched for new long entries. The move reflects both a softer dollar and improved sentiment surrounding EU growth.

GBPUSD reversed its earlier weakness after breaking below the 1.32333 low. The pair has since recovered, though it remains in need of further bullish price action confirmation. Thursday’s UK GDP m/m, forecast at 0.0% versus 0.5% previously, could influence whether this rebound holds or fades. Traders remain cautious, especially with BOE Governor Bailey expected to offer insight on policy direction this week.

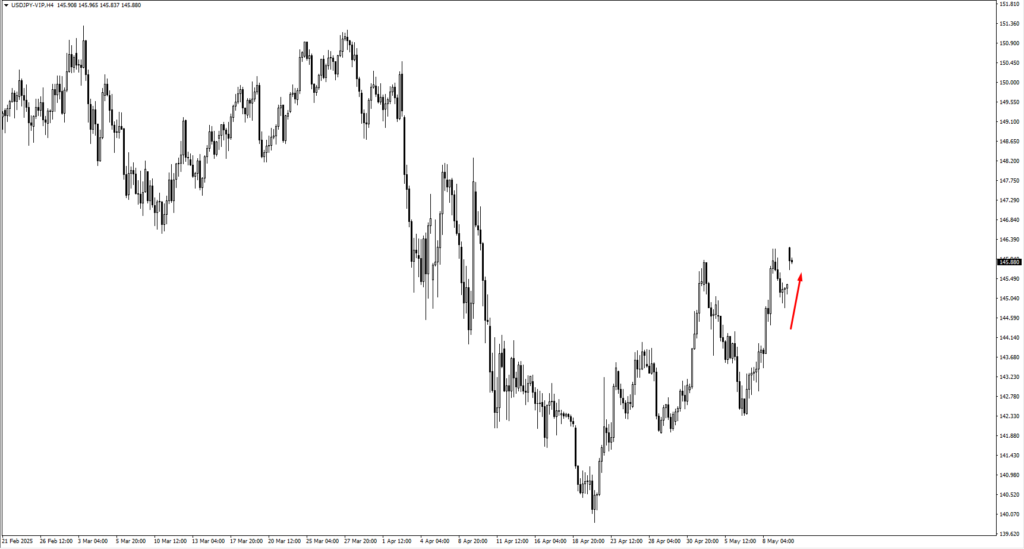
USD/JPY saw a strong upward move toward 146.60 and 147.40, with both levels under scrutiny for signs of exhaustion. With US Treasury yields steady and the Bank of Japan showing no signs of imminent tightening, further gains remain likely unless upcoming inflation figures shift dollar sentiment.

USD/CHF is pushing higher toward 0.8370. A clear break may invite a test of 0.8530, although traders are alert for potential bearish reversals, particularly if geopolitical risk re-emerges and safe-haven flows resume.

AUDUSD rebounded from 0.6380, although the uptrend lacks conviction. Should the pair decline again, traders are eyeing 0.6260 as a key level for bullish price action. The Aussie’s performance this week remains sensitive to Chinese trade headlines and general risk sentiment.

NZDUSD followed a similar trajectory, rising from the 0.5870 region. Like AUDUSD, confirmation is lacking, and a decline would bring the 0.5800 support zone into focus for potential long setups. Commodity-linked currencies may find more direction once U.S. inflation and China trade negotiations provide clearer signals.

USDCAD is trading at the 1.3945 level, and consolidation here could lead to resistance tests at 1.4055 and 1.4140. The Canadian dollar’s strength has been partially anchored by higher oil prices, though oil itself faces resistance in the near term.

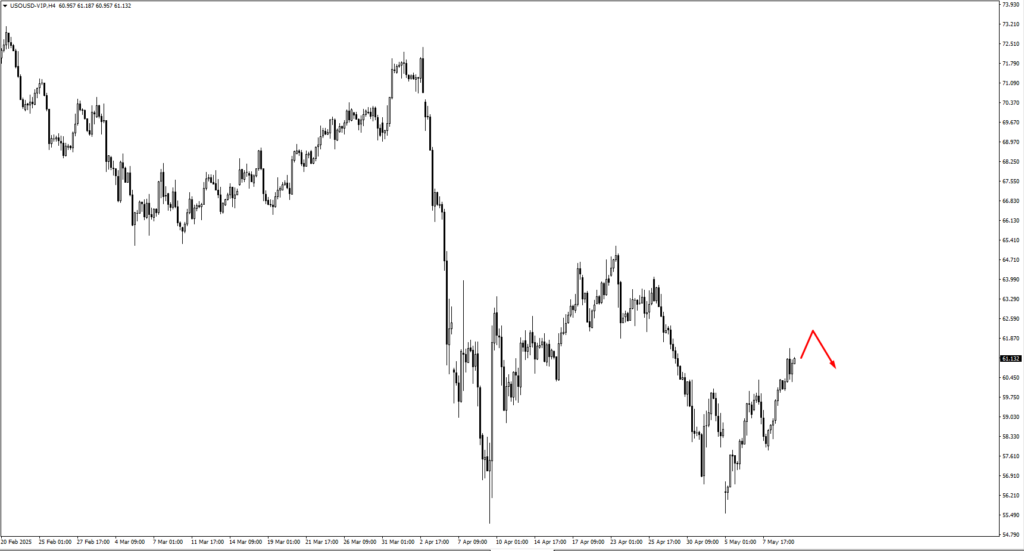
USOIL is edging higher, approaching the 62.05 resistance zone. If momentum carries it further, 63.15 will become a critical level where bearish pressure may build. With ceasefires and diplomatic overtures dampening geopolitical risk premiums, crude’s upside may soon be limited—unless supply disruptions re-enter the narrative.

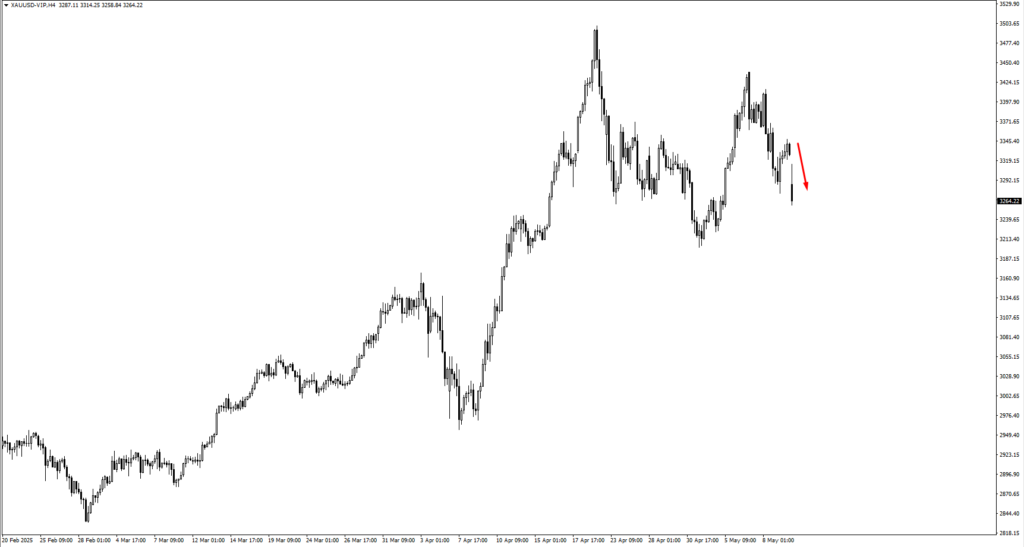
Gold continues to move lower, in line with a cooling inflation outlook. Traders are watching the 3,230 zone for possible support. If gold consolidates there, the 3,120 level becomes the next area of interest. The metal’s bearish bias may remain intact unless U.S. inflation data surprises to the upside or geopolitical risk suddenly resurges.

Silver fell from the 33.20 area and may now test the 31.657 or even 30.95 levels before bulls show renewed interest. Like gold, silver is tracking broader risk appetite and inflation trends, both of which are showing tentative softening.

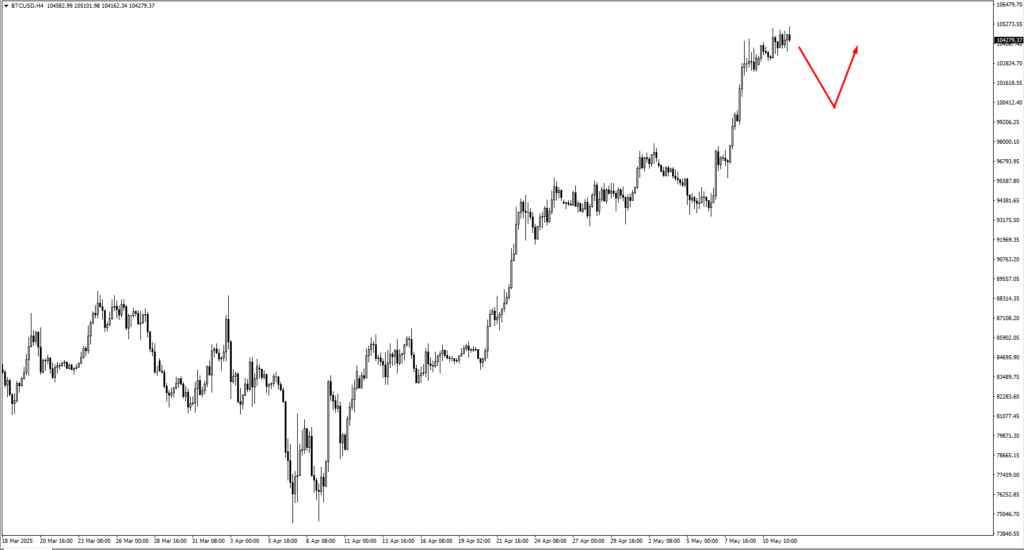
Bitcoin neared its all-time high this week, driven by renewed optimism and positive macro developments. If the rally pauses to consolidate, traders will monitor the 99,600 zone for fresh bullish patterns. Ether outpaced Bitcoin with an 18.91% rise across Friday and Saturday, having broken above 1,900. The next levels in focus for ETH are 2,340 and 2,780, depending on momentum and investor appetite.

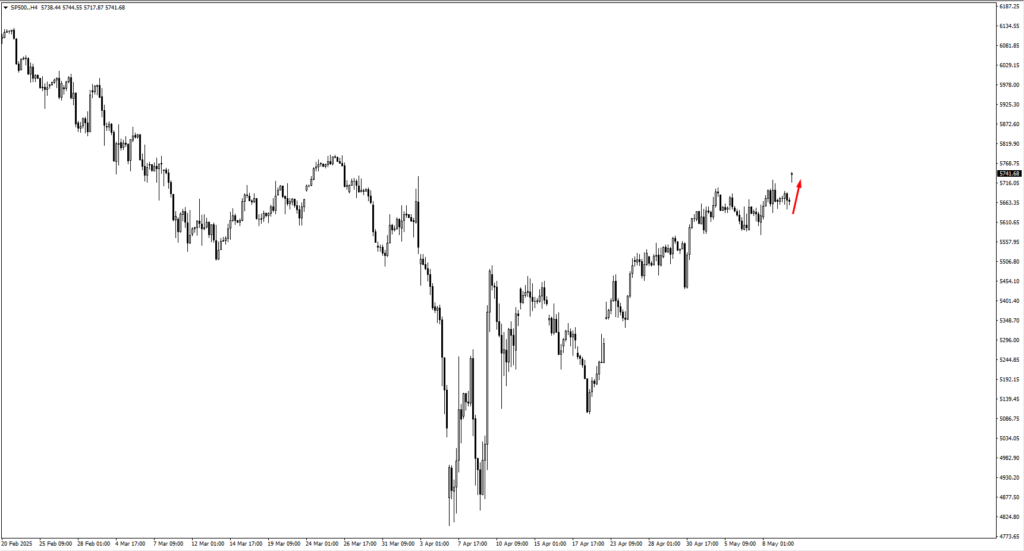
The S&P 500 continued its climb, with upcoming price action zones at 5,775 and 5,830. These levels represent potential resistance areas where the index may stall or break higher, contingent on this week’s inflation figures and Fed Chair Powell’s Thursday remarks. Nasdaq followed suit, now within range of 20,560 and 21,230, where traders will be seeking signs of fatigue or breakout.

Natural Gas made a new swing high and is now likely to consolidate. A pullback to 3.50 may offer bullish re-entry opportunities. Market participants continue to assess seasonal demand alongside broader commodity flows.

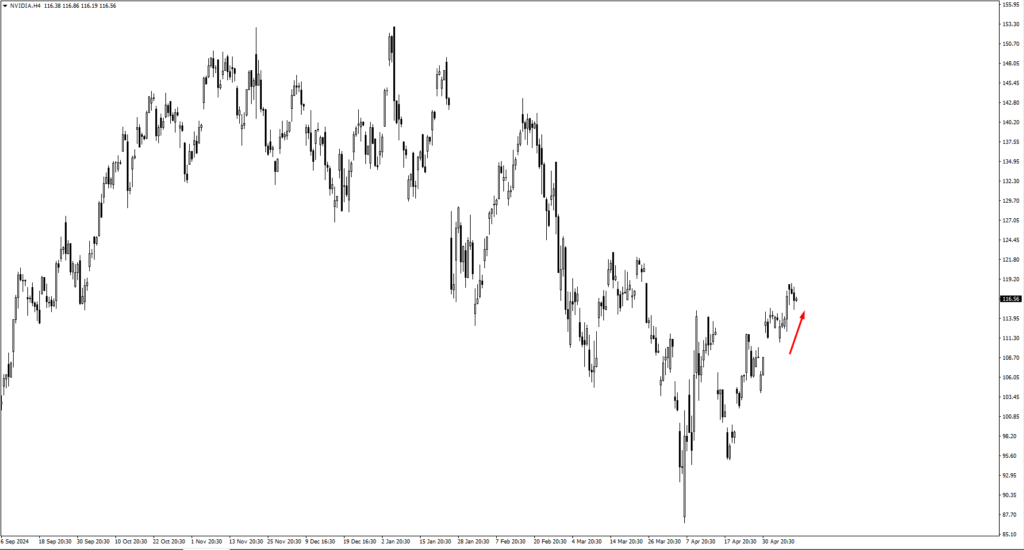
Nvidia remains on track toward the 120.40 level. With its intrinsic value estimated at $130, traders are tracking its movements closely. Amazon is similarly advancing, heading for 195.80, while Microsoft remains poised to break through 448.30 and potentially 456.03, contingent on consolidation patterns.

Across the board, price action this week reflects a market walking the line between optimism and uncertainty. With key inflation data and central bank speeches on the docket, these structural zones will guide short-term momentum, while traders wait for confirmation that calm abroad and cooling inflation at home can form the basis of a steadier risk-on trend.

Key Events This Week

On Tuesday, May 13, the focus turns sharply to inflation and monetary policy, with the US and UK releasing market-relevant updates. In the US, CPI y/y is forecast to remain unchanged at 2.4%, while Core CPI y/y, which excludes food and energy, is expected to come in lower than the previous 2.8%. Markets are watching closely for any sign that inflation is cooling faster than expected, which could reinforce hopes for a shift in Federal Reserve policy later in the year. On the same day, Bank of England Governor Andrew Bailey is scheduled to speak. With the UK economy treading water and inflation coming down, traders will be parsing Bailey’s comments for guidance on future interest rate decisions. Sterling pairs could react sharply if his tone diverges from expectations, especially with Thursday’s GDP figures looming.

On Thursday, May 15, a trio of high-impact events takes centre stage. In the UK, GDP m/m is forecast at 0.0%, down from the previous month’s 0.5%. A flat growth reading would add weight to concerns about the UK’s post-Brexit economic momentum and could weaken the pound if paired with dovish signals from Governor Bailey earlier in the week. Across the Atlantic, the US is due to release PPI m/m data, forecast to rise by 0.2% following last month’s -0.4% drop. A stronger PPI print would suggest rising production costs, possibly hinting at future consumer inflation pressure and complicating the Fed’s outlook. Later in the day, Federal Reserve Chair Jerome Powell is expected to speak. With inflation data in hand and markets already pricing in slower growth ahead, his words could sway expectations sharply. A cautious tone may support equities and weigh on the dollar, while a firmer stance could reassert the Fed’s commitment to keeping rates elevated for longer.

The week ahead offers fewer distractions from global diplomacy, but sharper scrutiny on economic direction. As traders weigh inflation data against central bank rhetoric, positioning will hinge on whether macro signals support the easing narrative—or suggest that policy tightening may still have work to do.

Create your live VT Markets account and start trading now.

Dividend Adjustment Notice – May 12 ,2025

Dear Client,

Please note that the dividends of the following products will be adjusted accordingly. Index dividends will be executed separately through a balance statement directly to your trading account, and the comment will be in the following format “Div & Product Name & Net Volume”.

Please refer to the table below for more details:

Dividend Adjustment Notice

The above data is for reference only, please refer to the MT4/MT5 software for specific data.

If you’d like more information, please don’t hesitate to contact [email protected].

Dividend Adjustment Notice – May 09 ,2025

Dear Client,

Please note that the dividends of the following products will be adjusted accordingly. Index dividends will be executed separately through a balance statement directly to your trading account, and the comment will be in the following format “Div & Product Name & Net Volume”.

Please refer to the table below for more details:

Dividend Adjustment Notice

The above data is for reference only, please refer to the MT4/MT5 software for specific data.

If you’d like more information, please don’t hesitate to contact [email protected].

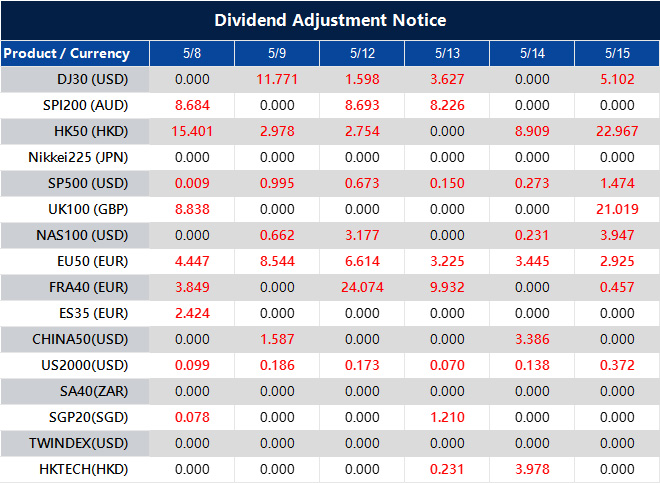
Dividend Adjustment Notice – May 08 ,2025

Dear Client,

Please note that the dividends of the following products will be adjusted accordingly. Index dividends will be executed separately through a balance statement directly to your trading account, and the comment will be in the following format “Div & Product Name & Net Volume”.

Please refer to the table below for more details:

Dividend Adjustment Notice

The above data is for reference only, please refer to the MT4/MT5 software for specific data.

If you’d like more information, please don’t hesitate to contact [email protected].

S&P 500 Rallies Amid Trade Hopes And Fed Caution

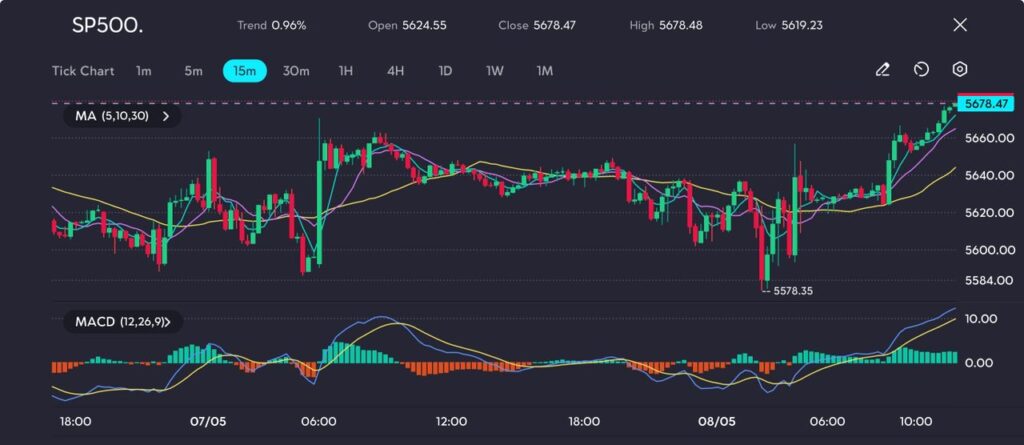
The S&P 500 advanced sharply on Thursday, buoyed by renewed trade optimism following remarks from US President Donald Trump. Posting on his Truth Social platform, Trump hinted at a significant trade deal with a ‘big’ country, widely interpreted as the United Kingdom. The announcement spurred a risk-on mood across global markets, propelling US equity futures higher and pushing the S&P 500 to an intraday high of 5678.48.

However, the optimism was tempered by Trump’s clarification that existing tariffs on Chinese imports would remain intact during initial negotiations. This added a layer of caution, as market participants remain sensitive to the risk of deteriorating US – China relations.

On the monetary policy front, the Federal Reserve kept interest rates unchanged on Wednesday, which was in line with expectations. Chair Jerome Powell struck a careful tone, acknowledging inflationary pressures and a tight labour market, but stressed there is currently no case for rate cuts. Powell also noted that while tariffs pose risks to the outlook, the Fed remains data-dependent and will not act on speculation alone.

Markets responded positively to both the trade headlines and the Fed’s steady hand. The Dow Jones Industrial Average rose 0.7%, the Nasdaq Composite gained 0.27%, and the S&P 500 closed 0.43% higher before futures extended gains into the overnight session.

Technical Analysis

The S&P 500 has staged an impressive intraday recovery, rebounding sharply from the 5578 support zone to set a new session high at 5678. The bullish drive was preceded by a brief consolidation phase and a dip toward the 5619 area, where buyers re-emerged with strength. The 5- and 10-period moving averages have realigned upward, signalling renewed bullish structure, while the MACD histogram has flipped firmly positive, with its lines showing a clean bullish crossover.

Picture: S&P 500 rebounds from 5578, surges to 5678 as bullish momentum reclaims control near resistance, as seen on the VT Markets app.

This move clears near-term resistance and suggests continuation potential, especially if momentum sustains above 5670. However, the current push is approaching psychological resistance, and overextension may trigger minor profit-taking. A retracement toward 5640 could act as a healthy retest zone before bulls attempt further upside.

Outlook: Bullish but Cautious

While the technical structure remains supportive of further gains, headline risk looms. A sustained breakout above 5700 is possible if trade optimism continues, but sentiment could reverse swiftly should the proposed UK deal lack substance or US – China trade tensions reignite. Additionally, upcoming labour market data and any signs of economic softening could inject volatility.

Create your live VT Markets account and start trading now.

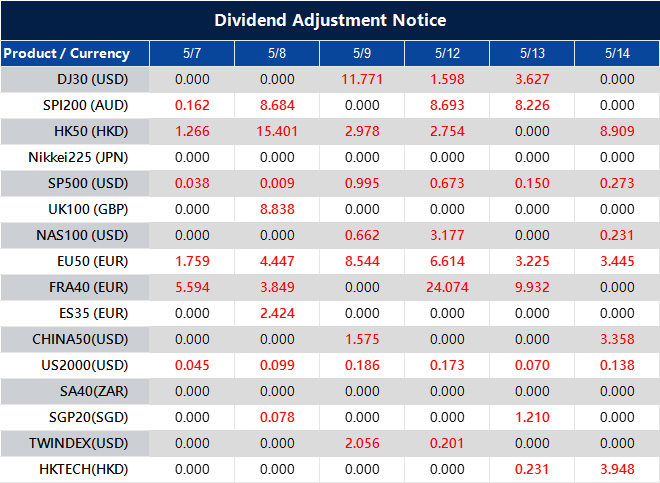
Dividend Adjustment Notice – May 07 ,2025

Dear Client,

Please note that the dividends of the following products will be adjusted accordingly. Index dividends will be executed separately through a balance statement directly to your trading account, and the comment will be in the following format “Div & Product Name & Net Volume”.

Please refer to the table below for more details:

Dividend Adjustment Notice

The above data is for reference only, please refer to the MT4/MT5 software for specific data.

If you’d like more information, please don’t hesitate to contact [email protected].

5 Times Social Media Influenced Financial Markets: From Musk to Cuban to Kardashian

Have you ever heard of a unique financial index called the Volfefe Index?

If you kept up with financial markets during Donald Trump’s presidency, you’re likely aware of his frequent tweeting and the existence of this strange yet real index.

The Volfefe Index is an analytical model created by JPMorgan to measure the impact of Donald Trump’s tweets on US interest rates.

And that’s not all…

Bank of America analysts also concluded that since 2016, the stock market tended to dip on days when Trump tweeted more than 35 times, and rebound on days when he tweeted fewer than five times!

Social Media Posts by Influential Figures Can Shift Market Direction

Social media has transformed how we connect, entertain, learn, and share information. Platforms like X, Facebook, and Reddit have opened up a borderless world to anyone with an internet connection.

But alongside the growing influence of social media in modern society, its power to reshape the financial world in an instant has increased as well, as we saw with Donald Trump and Twitter.

A tweet from a CEO, an endorsement from a celebrity, or advice from an influencer can rattle markets and shake global financial sentiment!

Here, we highlight five incidents where social media activity changed the course of financial markets:

1. Shiba Inu Cryptocurrency Rallies Following Elon Musk’s Tweet

The world’s richest entrepreneur, Elon Musk, is a vocal supporter of Dogecoin. Musk frequently shares his views on Shiba Inu-themed cryptocurrencies through his posts on X.

Recently, Musk joked on X about wanting to serve in the “Department of Government Efficiency” or its acronym, D.O.G.E.

This post racked up 81.9 million views at the time of writing, boosting Dogecoin’s value by 6%.

Another Musk tweet about Dogecoin on 1 April was anything but an April Fool’s prank:

The tweet’s impact on Dogecoin was no joke. It sent the price soaring by 30% to $0.7011 in just minutes!

2. Mark Cuban’s Scepticism On Bitcoin

If you’re familiar with the NBA, you’ll know Mark Cuban as the former owner of the Dallas Mavericks, who won the championship in 2011.

But Cuban’s NBA involvement is just one of his many ventures that paved the way for his billionaire status, including Broadcast.com, HDNet, and MicroSolutions.

So, it’s no surprise that when Cuban tweets, his 8.9 million followers take notice, and often act!

In a now-deleted tweet from early June 2017, Cuban warned that Bitcoin was in a bubble, ready to burst at any moment.

The price of Bitcoin reacted almost immediately. It dropped from $2,967.48 to $2,750.66 following Cuban’s tweet.

This was just one of many instances of Cuban voicing his scepticism toward Bitcoin. He has argued that Bitcoin will not become a valuable digital currency in the long run.

3. ‘Pump and Dump’ Schemes By Social Media Influencers

A stock fraud case in the US in 2022 stemmed from investors following the recommendations of several social media influencers who manipulated the stock market for personal gain.

The scam, masterminded by eight influencers, ran on the following modus operandi:

1. Selecting a stock to manipulate
This group identified small-cap stocks (typically worth only a few million dollars). These are easier to manipulate due to their low trading volume and lack of attention from mainstream investors.

The influencers would first buy shares in these companies at very low prices in preparation for the next step.

2. Promoting the stocks on social media
Next, the group would hype these stocks to their followers on platforms like Twitter and Discord, generating positive sentiment in the market.

What was the immediate effect of these promotions?

The stocks would surge dramatically! This is the ‘pump’ phase of the ‘pump and dump’ operation.

3. Selling off the stocks
What comes after the pump? The ‘dump’, which is selling the stocks to cash in.

And the victims?

Their unsuspecting followers were left holding rapidly devaluing shares after the influencers had sold out.

This group profited around $114 million from this scheme, which ran from January 2020 to April 2022.

As a result, in December 2022, the US Securities and Exchange Commission (SEC) announced charges against all eight influencers for their roles in this securities fraud.

4. Redditors Take On Hedge Funds

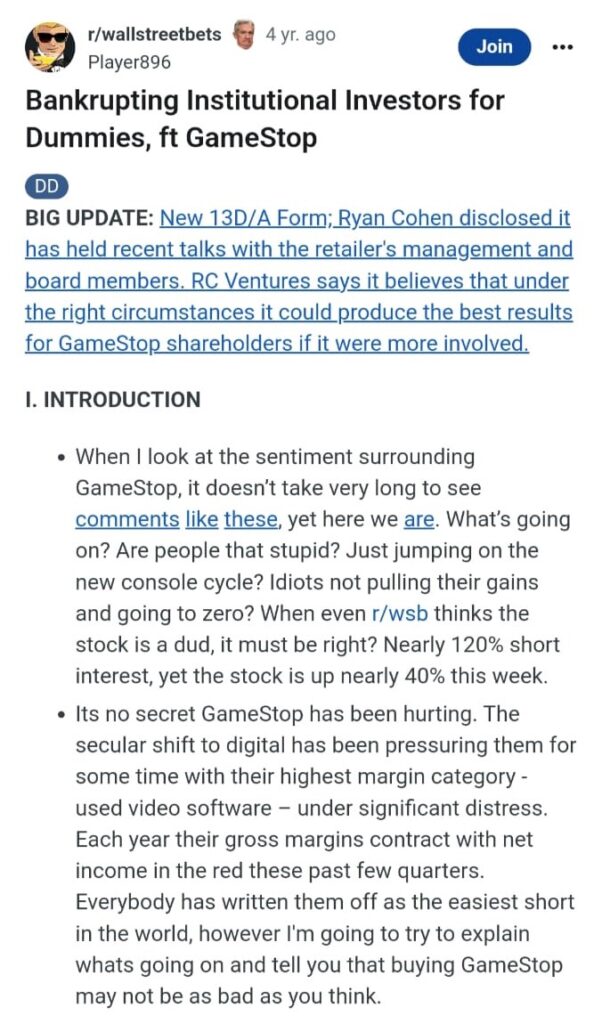
The GameStop stock drama was a fascinating episode for Reddit trolls, market watchers, analysts, and GameStop. Not so much for short sellers, who took heavy losses.

In January 2021, struggling video game retailer GameStop found itself at the centre of a Wall Street storm.

Several large hedge funds had heavily shorted GameStop shares, betting the price would continue to fall due to its weakening business model, the rise of digital gaming, and competition from online retailers.

However, a group of retail investors on the subreddit r/WallStreetBets, which often targets heavily shorted stocks, noticed the extreme short interest in GameStop.

The subreddit post that sparked the short squeeze saga of GameStop shares

These Redditors banded together and encouraged each other to buy GameStop shares, aiming to trigger a short squeeze – a rapid price increase that would force short sellers to cover their positions at much higher prices.

This operation gained momentum via posts on Reddit and other platforms like Discord and Twitter. The result? GameStop’s share price skyrocketed.

The story grabbed global headlines, with a narrative of ‘retail investors versus Wall Street’ sparking widespread interest, especially among amateur traders who joined the buying frenzy.

Caught off guard, short sellers were forced to buy back shares to close their positions, adding fuel to the rally.

The GameStop saga is a powerful example of how social media can unite retail traders to shift market trends in unexpected ways.

5. From Reality TV To Crypto Promotion

Who hasn’t heard of Kim Kardashian?

Whether or not you’re a fan of The Kardashians, Kim’s misstep in the crypto world once again brought her name to the headlines.

Remember the ‘pump and dump’ tactic we discussed earlier?

Essentially, the same thing happened here, with Kim K playing the role of the star promoter for a cryptocurrency called EthereumMax, or E-Max.

Just look at this Instagram story from Kim:

In reality, the ‘my friends’ she referred to were E-Max founders who had paid Kim $250,000 to use her name and platform to promote the cryptocurrency.

Although she used the hashtag #ad, the SEC said that disclosure wasn’t sufficient, especially since Kim failed to tell her followers she had been paid to make the post.

As a result, Kim was fined $1.26 million by the SEC and banned from promoting any cryptocurrency for three years.

In addition, she faced a lawsuit from E-Max investors. She was accused, along with the project’s founders, of promoting and selling the cryptocurrency with deceptive intent.

The lawsuit also claimed that E-Max was a classic pump-and-dump scheme, where slick marketing boosted the asset’s price before it was sold to unsuspecting investors for a quick profit.

Final Thoughts

A single social media post can change the world. Or at least the financial markets.

If you want to become a more informed trader, pay attention to high-profile individuals whose social media activity could move the markets.

Or, if you’re taking financial advice from influencers, make sure they have real experience and a solid track record in investing.

Bonus points if they’re licensed by a regulatory body like the Securities Commission of Malaysia.

Above all, ensure your fundamental and technical knowledge is strong enough to guide your trading strategy.

Ready to trade? Open a live account with VT Markets today.

Back To Top
server

Hello there 👋

How can I help you?

Chat with our team instantly

Live Chat

Start a live conversation through...

  • Telegram
    hold On hold
  • Coming Soon...

Hello there 👋

How can I help you?

telegram

Scan the QR code with your smartphone to start a chat with us, or click here.

Don’t have the Telegram App or Desktop installed? Use Web Telegram instead.

QR code