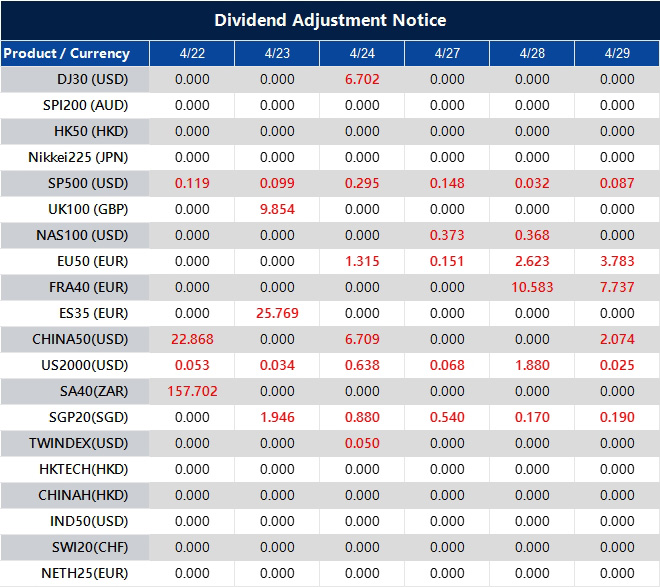
Please note that the dividends of the following products will be adjusted accordingly. Index dividends will be executed separately through a balance statement directly to your trading account, and the comment will be in the following format “Div & Product Name & Net Volume”.
Please refer to the table below for more details:
The above data is for reference only, please refer to the MT4/MT5 software for specific data.
If you’d like more information, please don’t hesitate to contact [email protected].
The UK Producer Price Index (input, month-on-month, not seasonally adjusted) rose by 4.4% in March. The market expectation was 2.8%.
The March reading was 1.6 percentage points higher than expected. This indicates faster growth in input prices than forecasts suggested.
Uk Input Ppi Details
The release refers to input costs faced by UK producers. It reports the change from the previous month on a non-seasonally adjusted basis.
The March input PPI reading of 4.4% is a significant surprise and points to persistent inflationary pressures at the factory gate. This data challenges the view that costs were moderating after the volatility we saw throughout 2025. We should position for the Bank of England to delay any planned interest rate cuts and possibly adopt a more hawkish tone.
Consequently, we see value in selling Sterling Overnight Index Average (SONIA) futures contracts for the third and fourth quarters. This position anticipates that the market will have to price out the probability of rate cuts later this year. The swap market has already reacted, now pricing less than a 50% chance of a rate cut by year-end, a sharp drop from the 80% chance priced in just last week.
The prospect of higher-for-longer UK interest rates should provide a strong tailwind for the pound. We are looking at buying call options on GBP/USD, targeting a move above the 1.2900 level. This is supported by recent data from the U.S. Commodity Futures Trading Commission, which shows speculative net-long positions on sterling have been building for three consecutive weeks.
Market Implications And Positioning
For UK equities, this development is a headwind, as higher borrowing costs could squeeze corporate margins and dampen consumer spending. We recommend considering buying put options on the FTSE 100 index as a hedge against a potential market pullback. Looking back at 2025, we saw how rate-sensitive sectors reacted negatively to similar inflation surprises, with the FTSE 250 falling over 3% in a single week on one occasion.
In the fixed-income space, we expect UK government bond (gilt) yields to continue their upward trend. Selling long-dated gilt futures is the most direct way to express this view. The 10-year gilt yield has already jumped 12 basis points to 4.38% on this news, and we see potential for it to re-test the highs from last quarter.
The UK Retail Price Index (RPI) rose by 4.1% year on year in March. This was above the expectation of 3.9%.
The March figure was 0.2 percentage points higher than forecast. It indicates annual RPI inflation remained above the predicted rate.
Implications For Bank Of England Policy
This higher-than-expected inflation figure suggests that price pressures in the UK economy are more persistent than we anticipated. The Bank of England will likely view this as a reason to delay any potential interest rate cuts that were being priced in for the summer. We should therefore adjust our rate expectations to be more hawkish for the remainder of 2026.
This data point does not stand alone, making it more significant for our strategy. Recent statistics show UK wage growth remained elevated at 5.6% in the three months to February 2026, fuelling the kind of services inflation that the Bank is most concerned about. This confirms the underlying inflationary heat is not fading as quickly as hoped.
For interest rate traders, this means we should anticipate a sell-off in UK government bonds, pushing yields higher. We are seeing the forward curve for SONIA futures reprice, with the market now indicating less than a 50% chance of a rate cut by September, down from over 80% just last month. Positions that benefit from higher short-term rates, or paying fixed on interest rate swaps, now look more attractive.
This situation feels very similar to the pattern we observed back in 2024, when sticky inflation repeatedly forced the market to push back its timeline for BoE rate cuts. In that period, sterling gained against currencies whose central banks were more dovish. History suggests a similar playbook could unfold now, where being too early on easing expectations proves to be a costly mistake.
Portfolio Positioning Considerations
In the foreign exchange markets, this supports a stronger British Pound. Higher interest rate expectations make holding sterling more attractive for international investors, a factor that has already pushed the GBP/USD exchange rate up by 0.5% to 1.2850 in overnight trading. We should consider buying call options on sterling to capitalise on potential further upside against the dollar and the euro.
For equities, this outlook presents a headwind, as higher borrowing costs can squeeze corporate profits and dampen economic activity. We should consider hedging our exposure to UK stocks, as the FTSE 100 has historically underperformed during periods of rising rate expectations. Buying put options on the FTSE 100 index could serve as a useful portfolio protection strategy in the coming weeks.
AUD/JPY rose to about 114.05 in early European trade on Wednesday, with the Australian Dollar gaining on a hawkish tone from the Reserve Bank of Australia. The Japanese Yen may strengthen if risk conditions worsen, which can weigh on the pair.
US President Donald Trump said on Tuesday he is extending the ceasefire with Iran at Pakistan’s request while waiting for a “unified proposal” from Tehran, as the US military keeps a blockade of Iranian ports. Markets are watching US-Iran peace talks, and a longer conflict could lift the safe-haven Yen.
Technical Picture On The Daily Chart
On the daily chart, the pair remains above the 20-day simple moving average and the 100-day exponential moving average. Price is near the upper Bollinger Band, and the Relative Strength Index is 68.62, just below overbought.
Resistance is near the upper Bollinger Band at 115.35. Support sits around the Bollinger middle band at 111.90, then near the 100-day EMA at 108.55 and the lower Bollinger Band at 108.45.
The Yen is shaped by Japan’s economic performance, Bank of Japan policy, yield gaps with US bonds, and market risk tone. The BoJ used ultra-loose policy from 2013 to 2024, then began a gradual unwind in 2024, which has helped narrow the bond-yield gap.
Given the Reserve Bank of Australia’s hawkish outlook, we see the Australian dollar maintaining its strength in the near term. With Australia’s most recent quarterly inflation data for Q1 2026 coming in at 3.8%, slightly above expectations, the case for holding long AUD positions remains compelling. This policy divergence with the Bank of Japan continues to be the primary driver for the AUD/JPY cross.
Options Strategy And Risk Management
For the coming weeks, we believe using call options to gain upside exposure is a sound strategy, especially with the clear bullish momentum on the daily chart. However, with the Relative Strength Index nearing overbought levels at 68.62, it is prudent to set take-profit targets around the 115.35 resistance level. Traders might also consider selling higher-strike calls to create a spread, which can offset the cost of the initial position.
The gradual policy normalization from the Bank of Japan, which began back in 2024, remains a key risk factor that could strengthen the yen unexpectedly. Therefore, we are layering in protective put options with strike prices below the initial support level of 111.90. This provides a safety net against any sudden shifts in sentiment or a surprisingly firm statement from the BoJ.
The ceasefire between the US and Iran is currently suppressing the yen’s safe-haven appeal, which is favorable for this pair. Any sign of these peace talks faltering could cause a rapid reversal as capital flows back into the yen. We are holding a small number of cheap, out-of-the-money JPY call options as a low-cost hedge against such a geopolitical event.
We remember how this pair reacted during the global growth scares in the third quarter of 2025, when it dropped sharply as investors sought the yen’s stability. While the environment is different now, the US-Japan 10-year bond yield spread has also narrowed by 10 basis points over the last month, slightly eroding the carry trade appeal that was so strong last year. This historical behavior reinforces our decision to remain hedged against downside risk.
Gold prices in Saudi Arabia rose on Wednesday, based on FXStreet data. Gold was priced at SAR 573.16 per gram, up from SAR 569.16 on Tuesday.
The price per tola increased to SAR 6,685.21 from SAR 6,638.56 a day earlier. Other listed prices were SAR 5,731.56 for 10 grams and SAR 17,827.23 per troy ounce.
How FXStreet Calculates Saudi Gold Prices
FXStreet derives Saudi gold prices by converting international prices using the USD/SAR rate and local units. The figures are updated daily at publication time and are for reference, as local prices may vary.
Central banks hold the largest gold reserves and added 1,136 tonnes worth about $70 billion in 2022, according to the World Gold Council. This was the highest annual purchase since records began, with China, India and Turkey increasing reserves.
Gold often moves opposite to the US Dollar and US Treasuries, and can also move against risk assets. Gold prices may also react to geopolitical events, recession fears, and changes in interest rates.
Gold’s recent price increase reflects a wider market shift towards caution. After the aggressive interest rate hikes we witnessed throughout 2025 to tame inflation, recent economic data from the first quarter of 2026 is pointing towards a significant slowdown. This growing fear of a recession is prompting a flight to safe-haven assets.
Interest Rates And Gold Demand
The US Federal Reserve is a key factor, having held its benchmark rate at 6.0% since December 2025. Derivative markets now indicate a 70% probability of a rate cut before the end of this year, as March inflation figures remained stubbornly high at 4.2%. As expectations for lower rates grow, non-yielding gold becomes a more attractive asset to hold.
Central bank activity continues to provide a strong floor for the gold price. We saw them add more than 950 tonnes to their reserves in 2025, the third consecutive year of historically strong buying, as they diversify away from the US dollar. This persistent demand from official sources helps absorb any temporary dips in the market.
For derivative traders, this suggests a bullish outlook for the coming weeks. Implied volatility in gold options has ticked up to its highest level this year, showing the market is anticipating larger price movements. Therefore, strategies like buying call options or setting up bull call spreads could be effective ways to capitalize on the expected upward trend.
Markets are looking 6 to 18 months ahead, pricing at the end of interest rate hikes and potential future cuts.
Large-cap tech companies are driving the rally through resilient profit margins, cost discipline, and strong pricing power.
Investors are prioritising long-term AI and digital transformation trends over short-term macroeconomic risks.
High levels of sideline cash and fear of missing out help sustain market momentum even amid negative headlines
Geopolitical tensions and inflation are increasingly treated as “background noise” unless they directly impact corporate earnings.
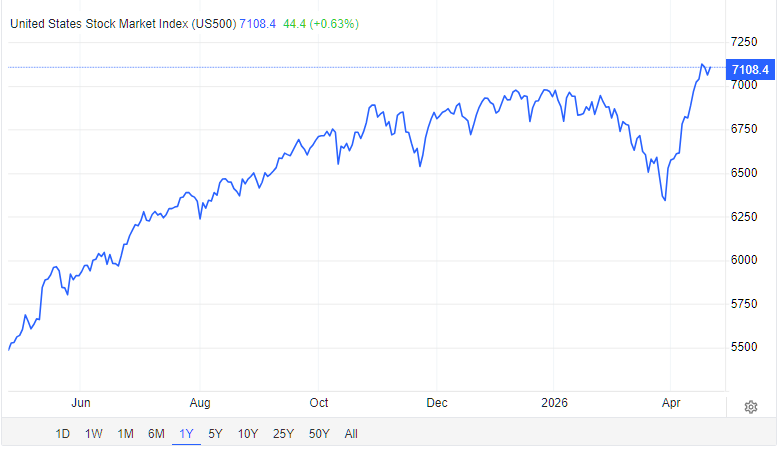
Forward-Looking Markets: 7 Factors Driving the S&P 500 to Record Highs
When you look at the US markets making new record highs in the current environment, it doesn’t really make sense. Geopolitical tensions remain, concerns over global growth and inflation remain, and central bank policy, including from the Federal Reserve, continues to create uncertainty in financial markets. Yet, despite all of this, the S&P 500 and Nasdaq have recently pushed to new record highs.
This disconnect between macroeconomic issues and equity market strength is not as irrational as it may seem. Markets are forward-looking, selective in what they price, and often driven by forces much more complex than pure headline risks. Several key factors help explain why equities continue to rally despite the current uncertainty.
1. How Forward-Looking Markets Price in the Next 18 Months
One of the most fundamental principles of financial markets is that they price for the future, not the present. While current conditions may appear fragile, investors are constantly attempting to anticipate what the world will look like in 6 to 18 months’ time.
Even amid concerns about inflation and restrictive monetary policy, there is a growing expectation that the peak of policy tightening has been reached or at least towards the end of the cycle. Markets are increasingly pricing in rate cuts or, at least a stabilisation in interest rates. These expectations when applied to future earnings supports higher equity valuations.
So, the markets are not ignoring the obvious risks, they are pricing in that the worst outcomes will be avoided.
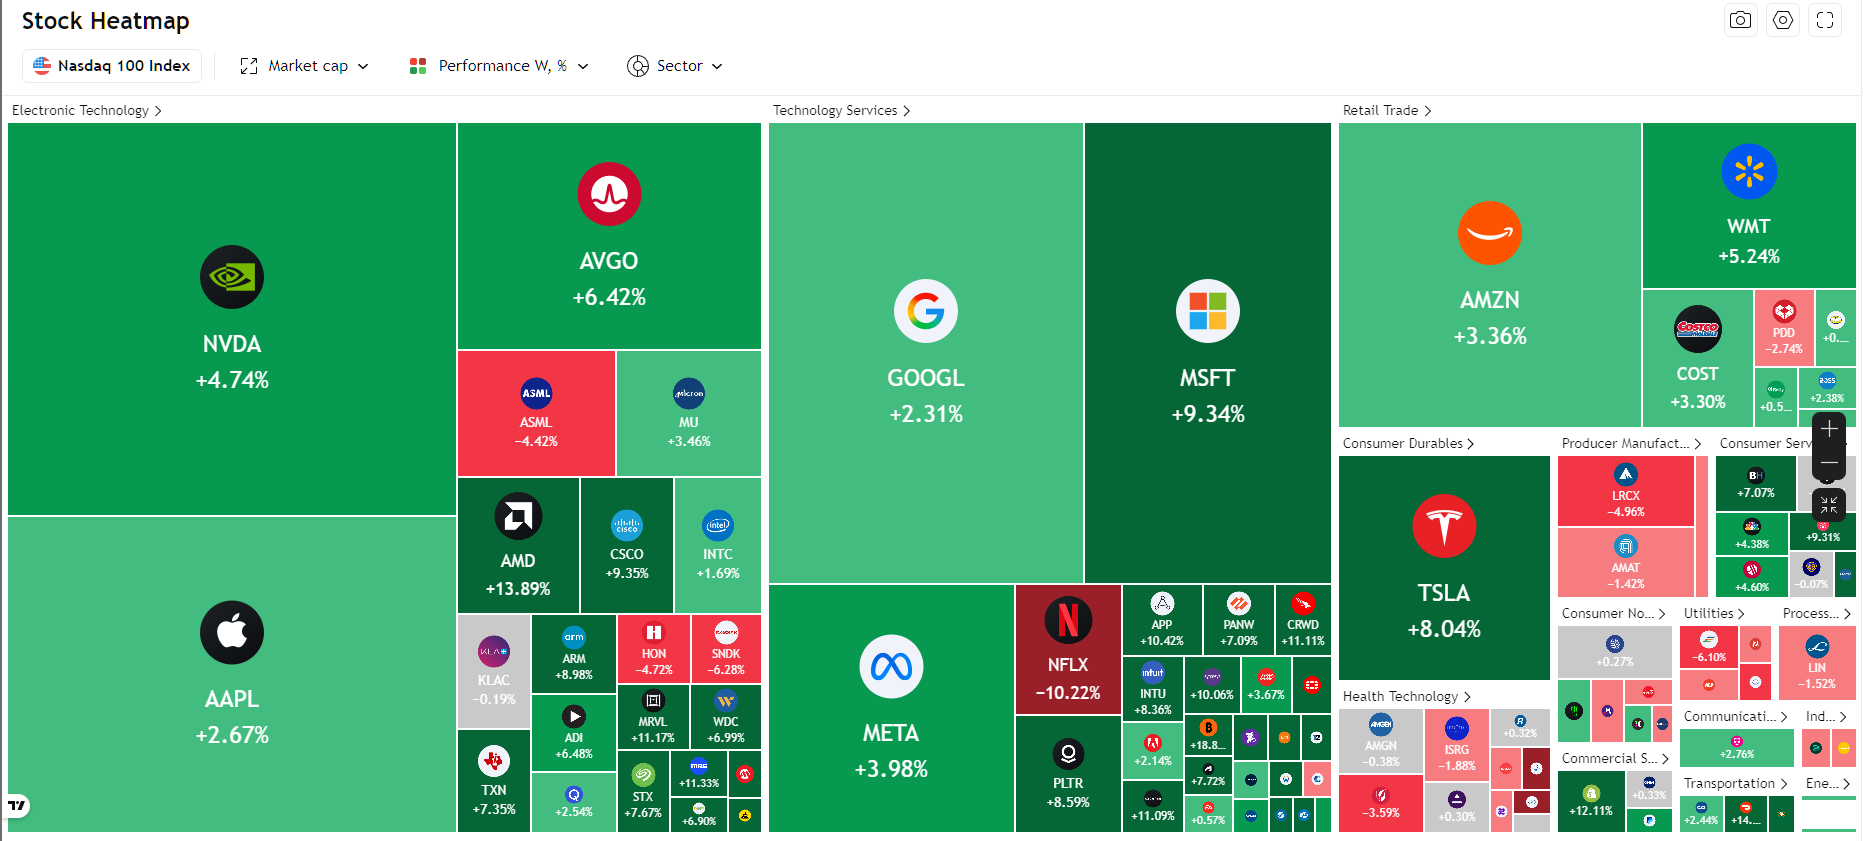
2. Earnings Resilience, Especially in Large-Cap Tech
A major driver of the rally has been the continued strength of corporate earnings, particularly among large-cap tech companies. The Nasdaq is heavily weighted toward technology and has benefited hugely from this trend.
Despite higher borrowing costs and macro uncertainty, many leading companies have demonstrated remarkable pricing power, cost discipline, and revenue growth. Margins have held up better than expected, and in some cases, improved due to efficiency gains and restructuring efforts.
This resilience matters. Equity markets can tolerate macro uncertainty as long as earnings remain strong. For most investors, the main question they are concerned about is whether companies can continue to generate profits, and so far, the evidence from the large tech companies has generally been that they can.
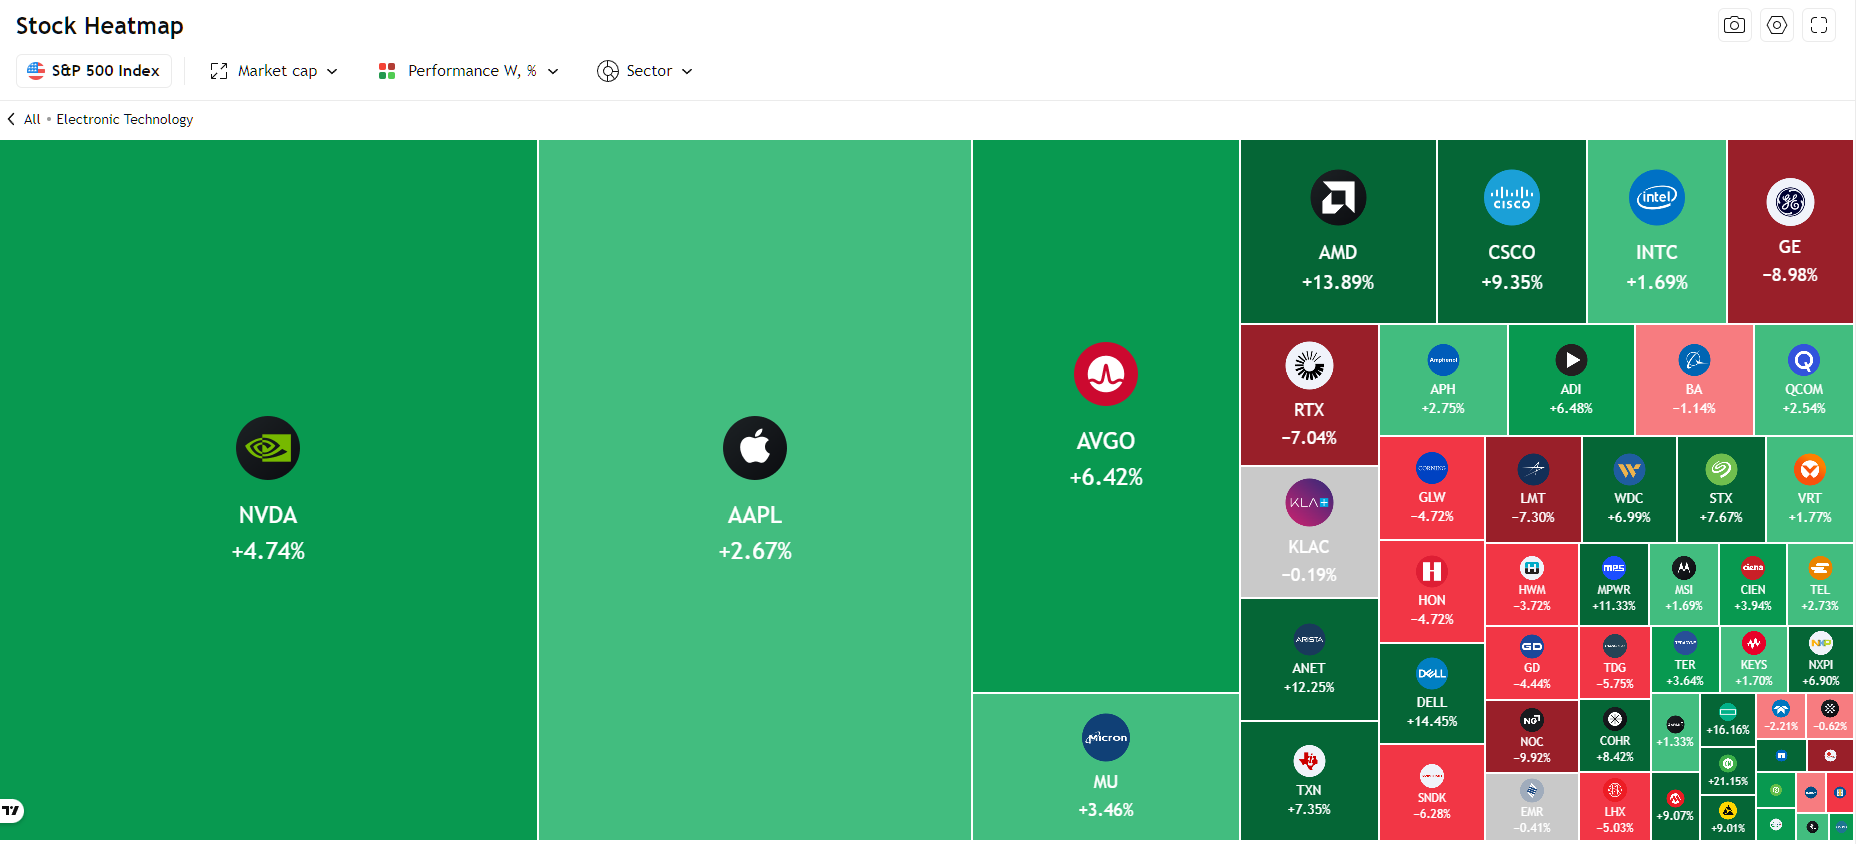
3. Structural Growth: Why AI is Driving S&P 500 Performance
Another crucial factor is the market’s focus on long-term structural trends rather than short-term concerns. The focus for the markets has been the rapid advancement of artificial intelligence and digital transformation.
Companies that are well-positioned to take advantage of these trends are seen as beneficiaries of multi-year and potentially multi-decade growth opportunities. Investors are willing to pay a premium for companies that are perceived to be resilient for the future, even if the broader economic outlook is uncertain in the near-term.
This drives capital flows into a relatively small group of high-growth names and has had an outsized impact on the performance in the Nasdaq and, increasingly, the S&P 500.
4. Liquidity Still Matters More Than Headlines
While central banks have tightened policy, global liquidity has not disappeared. Financial conditions, although more restrictive than in the ultra-loose period following the pandemic, are still supportive.
Additionally, large institutional investors continue to allocate capital to equities as part of long-term strategies. This steady demand provides a structural base for demand in the markets, even during periods of volatility.
5. The “Wall of Worry” Effect
Markets have a history of rising in the face of significant economic fears, negative news, or geopolitical tensions, a phenomenon often described as “wall of worry effect.”
When investor sentiment is risk-off, there is often significant cash sitting on the sidelines, which means negative sentiment can actually support markets.
When prices start to rise, those who are underinvested feel pressure to increase exposure, leading to incremental buying. This can help extend rallies beyond what fundamentals alone might justify.
In contrast, markets are often most vulnerable when they are full of optimism and positioning is fully stretched.
6. Inflation Is Easing—Even If Not Fully Tamed
While inflation remains a concern, it has been on a downward trajectory from peak levels. Markets are sensitive to direction and momentum, and the perception that inflation is gradually coming under control has eased some of the pressure on valuations.
Warsh told senators he would make monetary policy decisions independent of any advice or pressure from President Trump, highlighting success in keeping inflation low as the ‘plot armor’ that would insulate the central bank from criticism https://t.co/s7RimoJzQBpic.twitter.com/PoPhnUab0c
Lower inflation expectations also reduce the likelihood of further aggressive tightening by central banks. Even if policy remains restrictive, the absence of additional shocks can be enough to sustain market confidence.
Kevin Warsh, President Donald Trump’s nominee to lead the US central bank, said the Federal Reserve needed a new framework for dealing with persistent inflation, without offering more specifics https://t.co/4Bb9PAwEgN
Geopolitical tensions are clearly significant, but markets tend to react to them in a specific way. Unless such risks translate into immediate and measurable economic disruption, they are often treated as background noise.
Trump indefinitely extended a ceasefire with Iran just before its expiration, while maintaining a naval blockade of the Strait of Hormuz after planned peace talks between the two sides fell apart https://t.co/HxIF4zObci
Investors have become less sensitive to geopolitical headlines, particularly when past events have not led to sustained market downturns. This has created an environment where investors tend to look past geopolitical uncertainty unless it directly impacts earnings or financial conditions.
President Donald Trump announced he was extending a ceasefire with Iran indefinitely a day before it was set to expire, even as plans for a fresh round of talks between the two countries fell apart. https://t.co/mJqqVO6gEh
Conclusion: Rational Optimism or Fragile Confidence?
The rally in the S&P 500 and Nasdaq is not that the markets are ignoring all of the obvious risks. It reflects a more complicated view of forward-looking expectations, earnings strength, structural growth themes, and liquidity dynamics.
That said, the current environment is not without risks. Valuations in certain segments are stretched, whilst market concentration can create vulnerability if earnings in mega caps start to come under pressure. Shifts in inflation or policy expectations could quickly alter sentiment as well.
At the moment markets are choosing to focus on resilience over risk, on future potential rather than the current uncertainty. Whether this optimism proves justified will depend on how the economic and geopolitical landscape plays out.
The recent record highs suggest that investors remain willing to believe in a positive outcome.
The Big Questions
1) Why is the stock market hitting record highs despite high inflation and geopolitical tension?
Stock markets are forward-looking mechanisms that price in expectations for the next 6 to 18 months rather than current headlines. In 2026, the S&P 500 and Nasdaq are rallying because investors anticipate a stabilization of interest rates and see resilient corporate earnings that can outpace inflationary pressures.
2) Is the 2026 Nasdaq rally driven by an AI bubble?
While valuations are high, the current rally is increasingly supported by monetization and profitability rather than pure speculation. Unlike the dot-com bubble, today’s tech leaders are showing strong cash flows and efficiency gains from AI integration, leading many analysts to view this as a structural shift rather than a temporary bubble.
3) How do geopolitical risks like the Iran conflict affect the S&P 500?
Geopolitical tensions often create a “Wall of Worry.” Historically, unless a conflict causes a direct and sustained disruption to global energy supplies or corporate earnings, markets tend to discount these events as background noise. This creates a “risk-off” environment where sidelined cash eventually flows back into equities, supporting record highs.
4) What is Forward-Looking Pricing in the stock market?
Forward-looking pricing is the market’s tendency to value stocks based on future earnings potential rather than past performance. Even when the Federal Reserve maintains a restrictive policy, if investors believe rate cuts or economic stabilization are on the horizon, they will buy equities now to capture that future value.
5) Are large-cap tech stocks still a safe haven in 2026?
Large-cap tech companies are currently viewed as quality growth plays. Due to their massive cash reserves, pricing power, and low debt-to-equity ratios, they are better positioned to withstand high interest rates and economic uncertainty than smaller, more leveraged companies.
Start trading now – Click here to create your real VT Markets account
22 April, Bangkok, Thailand – Ahead of the VT Markets APAC Gala 2026: Future in Motion, the VT Markets team, along with regional partners and clients across Thailand, Vietnam, Malaysia, Indonesia, Myanmar, and Philippines dedicated their morning to the Baan Nokkamin Foundation to deliver essential supplies and community support.
Established in 1989 and officially registered and authorised by Thailand’s Ministry of Interior, the Baan Nokkamin Foundation is a dedicated organisation providing a safe haven for orphans, underprivileged children, the elderly, and those recovering from addiction. The organisation is dedicated to fostering self-reliance and emotional strength, providing the resources necessary for residents to transition into independent, successful lives.
During the visit, the VT Markets team and their regional partners spent time to organise and distribute comprehensive care packages tailored to the foundation’s immediate needs. This initiative allowed VT Markets’ key stakeholders to join the brand in a direct, hands-on contribution to the local community. The donations included:
Pantry Staples: Large quantities of rice, instant noodles, canned sardines, soy sauce, fish sauce, cooking oil, and sugar.
Daily Nutrition: Milk cartons and assorted snack packs.
School Supplies: A variety of stationery and tools to support their educational needs.
“True leadership is measured by the lives we touch,” said Dandelyn Koh, Head of Global Marketing at VT Markets. “Our visit to Baan Nokkamin, joined by our most valued IB partners and VIP clients, reminded us that while our business footprint is global, our deepest responsibility is to the local communities where we operate. Providing these essentials is a small gesture of our long-term commitment to Thailand.”
This initiative marks a significant chapter in VT Markets’ ongoing and growing Corporate Social Responsibility (CSR) efforts. As the firm continues to expand its presence across the Asia-Pacific region, it remains dedicated to scaling its social impact, ensuring that its global growth consistently translates into meaningful support for the communities it serves.
Gold prices in the Philippines rose on Wednesday, based on FXStreet data. Gold was priced at PHP 9,193.66 per gram, up from PHP 9,127.89 on Tuesday.
Gold increased to PHP 107,232.70 per tola from PHP 106,465.90 a day earlier.
Philippine Gold Rate Snapshot
The listed rates were PHP 91,936.62 for 10 grams and PHP 285,956.00 per troy ounce.
FXStreet converts international gold prices into Philippine pesos using the USD/PHP rate and local units. Prices are updated daily at the time of publication and are provided as a reference, as local market rates may vary slightly.
Central banks are the largest holders of gold. They added 1,136 tonnes worth about $70 billion to reserves in 2022, according to the World Gold Council, the highest annual total on record.
Gold often moves in the opposite direction to the US Dollar and US Treasuries, and it can also move against risk assets such as equities. Its price may react to geopolitical events, recession concerns, interest rates, and shifts in the US Dollar because gold is priced in dollars (XAU/USD).
Market Implications For Traders
The recent rise in gold prices, now over 285,000 PHP per troy ounce, shows the strong momentum we are currently witnessing. This isn’t just a local trend; it reflects a global environment where the metal is trading at historically high levels. For traders, this signifies a market with high energy but also one that could be prone to sharp reversals.
We should pay close attention to the unwavering demand from central banks, which has been a primary driver of this rally. After seeing them add over 1,037 tonnes in 2023 and another 1,000+ tonnes throughout 2025, their activity continues to provide a strong floor for prices. This sustained buying suggests any significant dips in the coming weeks will likely be viewed as buying opportunities by major institutions.
The outlook for interest rates remains a key source of volatility, which is critical for options pricing. After the rate cuts we saw through last year, the recent March 2026 US inflation report came in hotter than expected, creating uncertainty around the Federal Reserve’s next move. This indecision fuels gold’s appeal as a store of value when the future path of monetary policy is unclear.
Gold’s traditional inverse relationship with the US Dollar is also in play, though geopolitical tensions have made gold a preferred safe haven in its own right. We’ve seen this asset decouple from its typical correlations during periods of instability, acting more as a barometer of global fear. This backdrop means headline risk from international conflicts could trigger sudden upward spikes.
Given the high price and implied volatility, traders should consider strategies that define risk. Bull call spreads offer a way to capitalize on further upside with a capped maximum loss, making them suitable for this environment. For those anticipating a correction from these elevated levels or wanting to hedge, buying puts provides straightforward downside protection.
Gold prices in the United Arab Emirates rose on Wednesday, based on FXStreet data. Gold reached AED 561.43 per gram, up from AED 557.34 on Tuesday.
Per tola, gold rose to AED 6,548.30 from AED 6,500.67 a day earlier. FXStreet also lists AED 5,614.17 for 10 grams and AED 17,462.26 per troy ounce.
Uae Gold Price Conversion Method
FXStreet converts international prices into AED using the USD/AED rate and local units. Prices are updated daily at the time of publication and are for reference, as local rates may vary slightly.
Central banks are the largest holders of gold and use it to diversify reserves. They added 1,136 tonnes worth about $70 billion in 2022, the highest annual total since records began.
Gold often moves opposite to the US Dollar and US Treasuries, and can also move against risk assets such as shares. As gold pays no yield, lower interest rates can support prices, while higher rates can weigh on them.
We are seeing gold prices rise, reflecting its status as a safe-haven asset during turbulent times. This movement is a signal to watch for broader market instability. The current environment suggests traders are seeking to hedge against both inflation and potential currency weakness.
Central Bank Buying Supports Gold
The trend of central banks buying gold, which we saw surge back in 2022, is providing strong underlying support for the market. The World Gold Council’s latest figures for the first quarter of 2026 show central banks added a net 290 tonnes to reserves, the strongest first quarter on record. This sustained institutional demand, particularly from emerging economies, creates a solid price floor.
We must also consider the actions of the U.S. Federal Reserve, as gold is a non-yielding asset. After the series of rate cuts we experienced in 2025, the March 2026 inflation figure came in slightly hot at 3.1%, causing the market to question if more cuts are coming. This uncertainty over interest rates makes holding gold more attractive compared to assets whose returns could stagnate.
The inverse relationship between gold and the U.S. dollar remains a critical factor. The U.S. Dollar Index (DXY) has softened to around the 103.5 level, down from its highs last autumn in 2025. This weaker dollar makes gold cheaper for holders of other currencies, which can directly fuel demand and push prices higher.
For traders using derivatives, the combination of geopolitical tension and interest rate ambiguity points toward increased volatility in the coming weeks. This suggests strategies that benefit from price swings could be advantageous. Many will likely be positioning through call options to capture upside potential while limiting downside risk.
USD/JPY moved in a tight range in the Asian session on Wednesday, trading near 159.30. This was just below a one-week high from the previous day, and the pair stayed within a range seen over the past month.
The yen remained weak amid concerns about energy supplies linked to disrupted shipping through the Strait of Hormuz. On Tuesday, US President Donald Trump said the US Navy blockade of Iranian ports would continue, and Iran’s military said it would not reopen the waterway while the blockade remains.
Bank Of Japan Policy Expectations
Expectations that the Bank of Japan will keep rates unchanged at its April meeting also weighed on the yen. Reuters reported on Tuesday, citing sources, that the BoJ may signal it could raise borrowing costs as soon as June due to rising inflation pressures, while fears of market intervention limited further yen declines.
The US dollar was held back by optimism after Trump announced an indefinite extension of the ceasefire with Iran, shortly before it was due to expire. A modest fall in crude oil prices eased inflation concerns, and lower expectations of a US Federal Reserve rate rise added pressure to the dollar, helping cap USD/JPY.
We recall this time last year, in 2025, when USD/JPY was stuck moving sideways around the 159.30 mark. The market was trapped between the possibility of Bank of Japan action and a hesitant US Federal Reserve. Now in April 2026, the pair has broken significantly higher, currently trading near 162.50 as the policy differences between the two central banks have widened.
The hints we saw in 2025 of the Bank of Japan eventually raising rates did lead to the end of their negative interest rate policy, but little else has followed. With Japan’s core inflation remaining persistent at 2.8% through February 2026, the single small rate hike has not been enough to support the yen. This continued cautious stance from the BoJ remains the primary reason for yen weakness.
The geopolitical landscape has also shifted from the specific US-Iran tensions of 2025, though global energy security remains a background concern for Japan. More importantly, the Federal Reserve has maintained its higher-for-longer interest rate stance, a sharp contrast to the dovish sentiment that was developing last year. The current interest rate differential between the US and Japan sits near 5%, providing a powerful incentive to favor the dollar.
Derivative Trading Strategy Adjustments
Given this shift from a narrow range to a clear uptrend, strategies for derivative traders must adapt. Last year, selling options to collect premium in the stagnant market was a popular trade, but that is now a high-risk approach. We see increased value in buying options, such as long call spreads, to profit from continued upside while defining risk.
However, the threat of direct intervention from Japanese authorities to strengthen the yen, which was a concern in 2025, is now extremely high. To manage this risk of a sudden, sharp drop, traders should consider buying out-of-the-money put options. This acts as a form of insurance, allowing one to stay in a bullish trade while protecting against a severe reversal caused by government action.