Tech Giants Propel Stock Market Surge as Investors Eye Thanksgiving Closure and Fed Minutes

The stock market rallied as tech giants Microsoft and Nvidia drove significant gains, marking record highs amidst former OpenAI chief Sam Altman’s move to lead a new AI research team at Microsoft and Nvidia’s imminent earnings report. With the Dow Jones, S&P 500, and Nasdaq Composite all climbing, investors remained optimistic despite holiday closures. Lower-than-expected U.S. inflation data lessened concerns about rate hikes, reinforcing asset values but keeping a watchful eye on fiscal spending. Meanwhile, currency markets saw the U.S. dollar decline as risk-on sentiment grew, fueled by market anticipation of a potential Fed rate cut based on softer CPI data. Major currencies like the Euro and Sterling gained against the dollar, signaling changing market perceptions over traditional indicators like yield spreads. Ahead, crucial economic events and jobless claims data hold sway over market sentiments and currency movements.

Stock Market Updates

The stock market surged at the start of the week, with tech giants like Microsoft and Nvidia leading the charge. Microsoft saw a 2% rise, hitting a new high, following the announcement of former OpenAI chief Sam Altman joining to spearhead a new AI research team. Simultaneously, chipmaker Nvidia climbed 2.3%, reaching an all-time high just before its earnings report. This drove the Dow Jones Industrial Average up by 203.76 points, marking a 0.58% increase to close at 35,151.04. The S&P 500 also saw gains of 0.74%, finishing at 4,547.38, and the Nasdaq Composite surged 1.13% to close at 14,284.53, both marking their fifth straight day of growth.

The tech and communication services sectors notably drove these gains, witnessing increases of 1.5% and 1%, respectively. With Thanksgiving approaching, markets prepared for closure on Thursday and a shortened trading day on Friday. Despite historical choppiness around this holiday, November has consistently proven to be the S&P 500’s most successful month. Additionally, investors were buoyed by recent lower-than-anticipated U.S. inflation data, easing concerns about persistently high prices and suggesting the possibility of the Federal Reserve halting interest rate hikes. This trend further supported asset values, particularly with the concurrent drop in Treasury yields. However, market watchers remain vigilant about potential fiscal spending and deficit concerns, which could trigger upward pressure on yields. Wall Street is eagerly awaiting the release of the latest Fed minutes scheduled for Tuesday.

Data by Bloomberg

On Monday, the market saw a positive trend across most sectors, with a general increase of 0.74%. The standout performers were Information Technology and Communication Services, surging by 1.50% and 1.05%, respectively. Real Estate also demonstrated strength with a 0.79% rise, followed closely by Health Care and Consumer Discretionary, both gaining 0.52%. However, sectors like Utilities and Consumer Staples experienced slight declines of -0.31% and -0.01% respectively, while Energy and Materials showed marginal increases of 0.12% and 0.15%. Overall, the market exhibited broad positivity, particularly in the tech and communication sectors, driving the day’s gains.

Currency Market Updates

The recent fluctuations in the currency market, particularly concerning the US dollar, have been influenced by various economic indicators and shifting market sentiments. The dollar index experienced a notable decline, dropping by 0.49% and breaching key levels, primarily due to increased risk appetite following heightened expectations of a Federal Reserve rate cut. This shift was triggered by softer-than-expected US CPI data, causing the dollar’s safe-haven status to wane as risk-on flows took precedence in determining its value.

Despite certain supportive comments regarding disinflation from Richmond Fed President Thomas Barkin and the adjustment in yield spreads favoring the dollar, the currency continued its downward trajectory post-soft CPI release. The market’s anticipation of more disinflationary US data adds weight to the likelihood of an earlier Fed rate cut, potentially moving from June-July expectations to a more imminent cut in May. This shift aims to mitigate the risk of a severe economic downturn and further diminishes the dollar’s safe-haven appeal, influenced significantly by market perceptions rather than traditional indicators like yield spreads.

Looking ahead, market attention is directed toward crucial economic events such as Tuesday’s US existing home sales and the release of Fed meeting minutes. However, the pivotal moment arrives with Wednesday’s jobless claims data, as an above-forecast figure could intensify the substantial sell-off of USD/JPY, possibly pushing it below crucial support levels. This recent market sentiment has seen other major currencies like the Euro and Sterling make gains against the dollar, influenced not just by traditional yield spreads but more prominently by the selling pressure on the dollar as equities rallied.

Picks of the Day Analysis
EUR/USD (4 Hours)

EUR/USD Surges Amid Dollar’s Slide: Fed Minutes Awaited Amidst Economic Data

The EUR/USD soared to a three-month high around 1.0950 as the US Dollar continued its downward trajectory, driven by market expectations of the Fed’s halted interest rate hikes and Wall Street’s buoyant stock prices. The US Dollar Index (DXY) hit a low of 103.45, seeking stability amidst its decline. Anticipation builds for the Fed’s meeting minutes while key US data on the Chicago Fed National Index and Existing Home Sales are on the horizon. Meanwhile, Europe gears up for the release of crucial preliminary November PMIs. Despite the risk-on sentiment favoring the EUR/USD, the US economy’s stronger performance against the Eurozone remains a fundamental support for the Dollar’s outlook.

Chart EURUSD by TradingView

In technical analysis, the EUR/USD is showing a strong upward trend on Monday, nearing the upper band of the Bollinger Bands. It’s currently trading just below this level, indicating the possibility of further upward movement. The Relative Strength Index (RSI) at 77 confirms a consistent bullish trend in the market.

Resistance: 1.1004, 1.1042

Support: 1.0937, 1.0885

XAU/USD (4 Hours)

XAU/USD  Recovers from Dip Amid Dollar Vulnerability and Fed Expectations

Spot Gold faced a dip to $1,965 before bouncing back during the Asian session, indicating ongoing upside potential against a weakened US Dollar and decreasing Treasury yields. Despite the Greenback’s monthly lows and a subdued bond market, both Gold and Silver are not responding to the buoyant market sentiment. With anticipation building around the Federal Reserve’s meeting minutes release, the prevailing belief that the Fed might have concluded its rate hikes is impacting the Dollar’s short-term prospects, sustaining the upside potential for Gold.

Chart XAUUSD by TradingView

In technical terms, the analysis shows that XAU/USD is on an upward trajectory this Monday, targeting the upper band of the Bollinger Bands. The gold price is presently just under this band, suggesting a possible minor increase to reach the upper band. With the Relative Strength Index (RSI) at 62, it signals a continuing slight bullish trend for the XAU/USD pair.

Resistance: $1,992, $2,008

Support: $1,973, $1,955

Economic Data
CurrencyDataTime (GMT + 8)Forecast
CADConsumer Price Index21:300.1%

Gold Rush in California: A Historical Odyssey and Investment Insight 

In the annals of history, 1848 stands out as a beacon of change and opportunity, a year when the American narrative took an unforeseen twist. 

Gold Rush in California, 1849
Source: Click Americana

The spark that ignited this transformative journey was not a political decree or a technological breakthrough, but a glint of gold discovered by James W. Marshall at Sutter’s Mill in California. 

This historical nugget, quite literally, set the stage for a phenomenon that would not only define California’s destiny but also provide a treasure trove of lessons for today’s traders navigating the intricate landscape of investments. 

The allure of gold, beyond its shimmering aesthetic, served as the catalyst for the California Gold Rush. As news of Marshall’s discovery spread like wildfire, it triggered an unprecedented rush of fortune-seekers, prospectors, and dreamers from every corner of the globe. 

The resulting frenzy of activity not only carved a new identity for California but laid the groundwork for understanding the ebb and flow of markets, a valuable insight that resonates even in the digital age of contemporary investments. 

Historical Context: Unveiling the Golden Landscape 

Picture the quiet waters of the American River near Sutter’s Mill in 1848, where a momentous discovery forever altered the course of history. James W. Marshall, a carpenter and sawmill operator, stumbled upon a glittering substance – approximately 280 ounces of gold. 

James William Marshall
source: Wikipedia

This singular event, this spark of gold, became the catalyst for a feverish quest for wealth, marking the inception of the legendary California Gold Rush

As news of Marshall’s discovery spread, a wave of hopeful prospectors descended upon California, their eyes gleaming with the promise of unimaginable riches. By 1850, the population of California surged from around 14,000 to over 92,000

The once quiet landscapes transformed into bustling epicentres of ambition, giving birth to a myriad of boomtowns. From the bustling streets of San Francisco to the remote corners of the Sierra Nevada, these makeshift settlements emerged, fuelled by the collective dream of striking it rich. 

The influx of fortune-seekers wasn’t confined to a particular demographic. People from all walks of life, hailing from various corners of the globe, embarked on the arduous journey to California. This surge of diversity created a unique mosaic of communities – by 1852, the population included individuals from China, Mexico, Europe, and across the United States. 

Map of the gold mining region of California and routes for travelling there, 1849
Source: Digital Public Library of America

The Gold Rush was not merely a quest for gold; it was a melting pot of cultures, dreams, and ambitions that shaped the sociocultural landscape of the region. 

The impact of the Gold Rush on the local economy was nothing short of seismic. California, once a sparsely populated territory, witnessed an unprecedented surge in population and economic activity. 

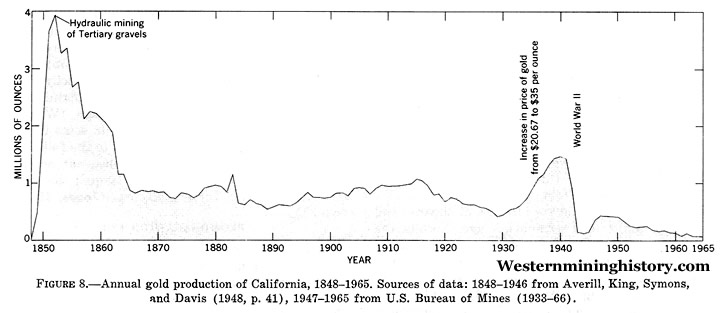
The rapid societal transformation was palpable – by 1853, California’s mineral production exceeded $58 million, a staggering sum in the 19th century. The pursuit of gold spurred innovation, entrepreneurship, and a sense of possibility that laid the groundwork for the birth of modern California. 

The Gold Rush wasn’t just about striking it rich; it was a catalyst for change, propelling California into a new era. The once-sleepy region became a dynamic hub of activity – by the mid-1850s, San Francisco’s population exploded from a mere 1,000 to over 50,000 residents

View of San Francisco 1850, painting by George Henry Burgess, 1878
Source: Wikimedia Commons

This exponential growth set the stage for economic development, infrastructure growth, and the establishment of enduring cities. The impact of those early seekers of fortune, both in terms of gold and societal transformation, is etched into the very fabric of California, underscoring the profound role of the Gold Rush as a transformative force that shaped the course of the state’s history. 

Global Impact of the California Gold Rush: A Ripple Across Continents 

The allure of California’s gold was not confined within the state’s borders; it radiated globally, beckoning fortune-seekers from every corner of the world. As the news of the gold discovery at Sutter’s Mill echoed through international channels, it became a beacon of hope, triggering an unprecedented surge in global interest and participation. 

Influence on International Trade 

The surge in gold production in California had profound implications for international trade. By 1850, California was producing roughly 750,000 pounds of gold annually, accounting for nearly 40% of the world’s gold output. 

Gold production in California, 1852
Source: Western Mining History

This surge in supply rippled through global markets, influencing commodity prices and trade dynamics. The sudden influx of precious metal acted as a force that reshaped the dynamics of international trade, making gold a key player in the economic chessboard of the 19th century. 

Alteration of Currency Systems 

The impact of California’s gold extended beyond physical goods and commodities; it fundamentally altered currency systems across the globe. The sheer volume of gold pouring out of California prompted nations to reconsider their monetary policies. 

In 1851, Australia, another gold-rich region, adopted the gold standard, and by the end of the decade, the majority of the world’s major economies followed suit. The California Gold Rush, therefore, played a pivotal role in shaping the modern monetary landscape, solidifying gold as a standard for currency valuation. 

Migration Patterns and Demographic Shifts 

The Gold Rush wasn’t merely a localised phenomenon; it triggered migration patterns and demographic shifts felt in distant corners of the world. 

The surge in population and economic activity in California drew people from China, Europe, South America, and beyond. By 1852, the population of California included individuals from over 25 different nations, creating a melting pot of cultures that would leave a lasting impact on the state’s identity. 

This unprecedented migration wave became a precursor to the globalized world we know today, emphasising the interconnected nature of the 19th-century economy. 

California gold production summary
Source: Western Mining History

Indelible Mark on the 19th-Century Economy 

The Gold Rush was more than a regional event; it left an indelible mark on the interconnected nature of the 19th-century economy. 

The sudden influx of gold from California had far-reaching consequences, influencing trade routes, currency values, and demographic patterns worldwide. As gold flowed from the California hills, it wove a golden thread through the fabric of the global economy, leaving a legacy that would endure for decades to come. 

The interconnectedness unveiled during the Gold Rush era serves as a timeless reminder of how events in one corner of the world can send reverberations across continents, shaping the course of history on a truly global scale. 

Parallels to Modern Investing: Navigating the Currents of Gold 

Embarking on a journey through the annals of history, gold emerges as a steadfast custodian of wealth. Since time immemorial, civilisations have revered gold for its intrinsic value, rarity, and enduring lustre. The parallels between the Gold Rush era and modern investing reveal that the allure of gold as a historical store of value remains unwavering. 

In the 19th century, as prospectors sifted through California’s riverbeds in pursuit of the precious metal, they were driven by an innate belief in gold’s ability to preserve wealth. 

Fast forward to the present day, and gold maintains its status as a haven in times of economic uncertainty. The enduring appeal of gold lies not only in its physical beauty but also in its historical role as a reliable store of value, a timeless trait that transcends centuries. 

California gold nugget 1849
Source: National Museum of American History

The speculative fervour that characterised the Gold Rush era finds an intriguing reflection in contemporary investment trends. Just as fortune-seekers flocked to California with dreams of striking it rich, modern investors exhibit a similar appetite for speculative assets. 

Cryptocurrencies, for instance, embody the spirit of risk and reward akin to the speculative nature witnessed during the Gold Rush. The parallel between the exuberance of the Gold Rush and today’s investment landscape underscores the enduring human inclination for high-reward opportunities. 

Gold, silver, and other precious metals have weathered the tides of time, serving as a hedge against economic uncertainties. During the Gold Rush, as financial markets experienced turbulence, gold provided a stable anchor for those navigating the unpredictable currents. 

Fast forward to the present, and the same principle holds true. Investors turn to precious metals as a safeguard during periods of economic instability, reinforcing the notion that the lessons learned from the Gold Rush era are still relevant in today’s complex financial landscape. 

Gold depository of Bank of England
Source: BBC

The enduring appeal of gold as a historical store of value, coupled with the parallels between speculative fervour then and now, suggests that the lessons derived from the Gold Rush extend beyond the pages of history. 

As traders navigate the currents of modern investing, the wisdom gleaned from the rush for gold in the 19th century remains a guiding light, emphasising the timeless nature of precious metals in the intricate dance of economic uncertainties. 

In conclusion, the California Gold Rush encapsulates more than a bygone era of feverish prospecting. Summarising key takeaways, traders are encouraged to adopt a responsible and informed approach to investing. The timeless lessons derived from the Gold Rush era – adaptability, diligence, and a keen awareness of the global economic landscape – serve as beacons for today’s investors navigating the ever-changing seas of the financial market. As we trace the footsteps of those who sought fortune in the golden hills of California, we find that the lessons of the past continue to resonate in the challenges and opportunities of the present. 

If the allure of gold and the echoes of the Gold Rush have sparked your interest in investing, consider navigating the currents with VT Markets. Providing a comprehensive platform for traders, VT Markets offers the tools and resources needed to venture into the world of precious metals. As you embark on your investment journey, VT Markets stands as a reliable companion, furnishing a secure and user-friendly environment for exploring the timeless opportunities presented by gold. Visit the VT Markets platform and set sail on your path to gold investment today. 

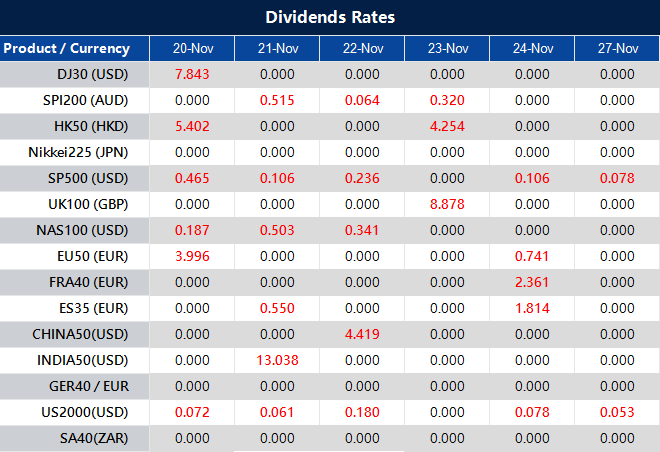
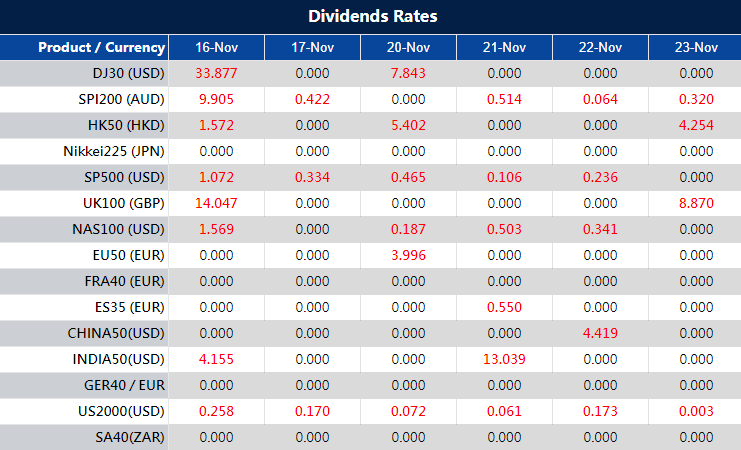
Dividend Adjustment Notice – November 20, 2023

Dear Client,

Please note that the dividends of the following products will be adjusted accordingly. Index dividends will be executed separately through a balance statement directly to your trading account, and the comment will be in the following format “Div & Product Name & Net Volume ”.

Please refer to the table below for more details:

The above data is for reference only, please refer to the MT4/MT5 software for specific data.

If you’d like more information, please don’t hesitate to contact [email protected].

Week Ahead: FOMC Meeting Minutes and Flash Services PMI Reports from the US, UK, and Germany

Various events look set to impact the markets this week. In addition to minutes from the Fed’s November meeting, market movements will likely also be shaped by the release of updated flash services and manufacturing PMI figures. 

Traders should maintain caution and closely monitor the following developments for a successful trading week:

Canada’s Consumer Price Index (21 November 2023) 

The consumer price index for Canada decreased by 0.1% in September 2023 compared to the previous month.

Analysts anticipate a 0.1% increase in the figures for October, which are set to be released on 21 November.

FOMC Meeting Minutes (22 November 2023) 

The Fed kept the target range for the federal funds rate at 5.25–5.5% for a second consecutive time in November, reflecting policymakers’ dual focus on returning inflation to 2% while avoiding excessive monetary tightening.

At a press conference, Fed chair Powell stated that rate cuts have not been discussed and that the focus remains on potential hikes by the central bank.

US Durable Goods Orders (22 November 2023)

New orders for manufactured durable goods in the United States surged by 4.6% month-over-month in September 2023, rebounding from a 0.1% contraction in August.

Analysts anticipate a 3.2% decrease in the figures for October, which are set to be released on 21 November.

Flash Manufacturing PMI for Germany and the UK (23 November 2023)

Germany’s manufacturing PMI increased from 39.6 to 40.8 between September and October 2023. Meanwhile, the UK’s manufacturing PMI increased from 44.3 to 44.8 during the same period.

New PMI figures will be released on 23 November. Analysts’ predicted manufacturing PMIs are 41.2 for Germany and 45 for the UK.

Flash Services PMI for Germany and the UK (23 November 2023)

Germany’s services PMI declined from 50.3 to 48.2 between September and October 2023. Meanwhile, the UK’s services PMI increased from 49.3 to 49.5 during the same period. 

New PMI figures will be released on 23 November. Analysts’ predicted services PMIs are 48.5 for Germany and 49.5 for the UK.

Flash Services and Manufacturing PMI for the US (24 November 2023)

The US’ flash manufacturing PMI was 50 in October 2023, marking a slight increase from 49.8 in September. In the same period, the US’ flash services PMI rose from 50.1 to 50.6.

Analysts predict that the US’ manufacturing PMI for November 2023 will decrease to 49.8 while the US’ services PMI will also fall to 50.3.

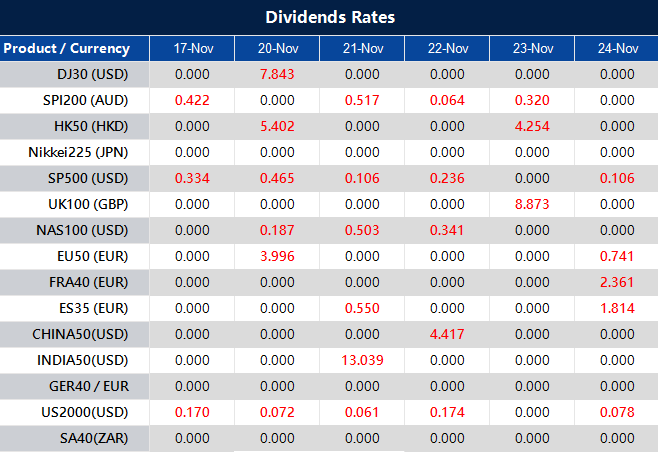
Dividend Adjustment Notice – November 17, 2023

Dear Client,

Please note that the dividends of the following products will be adjusted accordingly. Index dividends will be executed separately through a balance statement directly to your trading account, and the comment will be in the following format “Div & Product Name & Net Volume ”.

Please refer to the table below for more details:

The above data is for reference only, please refer to the MT4/MT5 software for specific data.

If you’d like more information, please don’t hesitate to contact [email protected].

Dow Slips as Cisco and Walmart Drive Declines, November’s Positive Trajectory Pauses | Currency Trends and Commodity Movement

Thursday’s stock market saw the Dow Jones slipping by 0.13%, ending its winning streak, while the S&P 500 and Nasdaq showed marginal gains. Declines in Cisco and Walmart heavily influenced the Dow’s dip, accompanied by a pullback in Chevron due to a 5% fall in U.S. crude oil prices. Despite this pause, November’s overall trajectory remained positive, buoyed by encouraging inflation reports earlier in the week. The currency market witnessed the USD index decline amid speculation about Fed rate cuts, impacting pairs like EUR/USD and USD/JPY. Fluctuations were observed in GBP/USD, while commodities like gold surged amidst falling yields, contrasting Bitcoin’s 4.2% decline.

Stock Market Updates

In Thursday’s stock market session, the Dow Jones Industrial Average concluded lower, halting its recent four-day winning streak, slipping by 0.13% to close at 34,945.47. Similarly, while the S&P 500 marginally increased by 0.12%, closing at 4,508.24, the Nasdaq Composite showed a slight uptick of 0.07%, ending at 14,113.67. This pullback was influenced by significant declines in specific stocks: Cisco Systems plummeted nearly 10% following a disappointing outlook for the current quarter and full fiscal year, while Walmart saw an 8% decline after issuing a below-expectation forecast, making them the primary detractors in the Dow. Chevron also experienced a dip of 1.6% as U.S. crude oil prices observed a 5% fall.

Despite this pause in the November rally, the overall trajectory for the month has been positive, with the three major indexes showing approximately 2% gains each. The market was buoyed earlier in the week by encouraging inflation reports: October witnessed a substantial 0.5% decline in the producer price index, the most significant drop since April 2020, while the consumer price index remained stable, reinforcing investor hopes that the Federal Reserve might be content with the moderating inflation trend. As a result, the S&P 500 surged over 7%, the Dow ascended by 5.7%, and the Nasdaq soared by 9.8%, indicating substantial growth across these indices for the month.

Data by Bloomberg

On Thursday, most sectors saw positive gains, with Communication Services leading with an increase of 0.94%, closely followed by Information Technology at 0.68%. Utilities and Health Care also showed moderate growth at 0.45% and 0.38%, respectively. However, Energy experienced a notable decline of 2.11%, while both the Consumer Staples and Consumer Discretionary sectors saw significant decreases of 1.20% and 0.91%, respectively. Real Estate had minimal growth at 0.03%, while Industrials slightly dipped by 0.06%. Financials and Materials showcased modest gains of 0.32% and 0.24%, respectively, painting a mixed picture across various sectors on the trading day.

Currency Market Updates

The USD index experienced a slight decline during the trading session following higher-than-expected weekly U.S. jobless claims, which prompted a downward movement in U.S. Treasury yields. This weakening trend in the dollar persists due to ongoing speculation among traders regarding the anticipated timing and magnitude of rate cuts by the U.S. Federal Reserve. As a result, the EUR/USD pair saw a marginal increase of 0.1% to reach 1.0857, buoyed by the decrease in USD yields, albeit stalling near 1.09 amidst anticipation of potential Fed rate adjustments. Conversely, USD/JPY retreated from its earlier high at 151.30 to 150.47 due to the narrowing U.S.-Japan yield spreads, showcasing cautiousness among USD bulls regarding potential intervention by the Ministry of Finance near the 152 mark.

GBP/USD experienced fluctuations, sliding from its post-claims highs at 1.2455 to 1.2420, unable to sustain above the 200-day moving average at 1.2442. Despite this, the cable remained supported by its daily cloud top and upper 30-day Bolli, while the falling Fed rate expectations favored GBP bulls in contrast to the Bank of England’s slower anticipated rate adjustments. Additionally, AUD and CAD witnessed declines owing to decreasing commodity prices and a dimmer outlook on global growth. Meanwhile, amidst falling yields, gold surged by 1.3% to $1,985, silver rose by 1.9% to $23.9, while Bitcoin faced a 4.2% decline to $36.3k, encountering selling pressure after peaking around $38k.

Picks of the Day Analysis
EUR/USD (4 Hours)

EUR/USD Retracement Amidst Fed Sentiment

The Federal Reserve’s apparent conclusion on interest rate hikes following subdued inflation data triggered a Dollar retreat. However, the USD showcased resilience post-data release, backed by a rebound in US yields. While the negative Dollar sentiment prevails, the USD’s strength is evident against a backdrop of comparatively robust US economic performance. This correction in EUR/USD is viewed as a temporary adjustment in light of ongoing market expectations regarding the Fed’s stance on rates. The coming US economic data could further impact the pair’s movement.

Chart EURUSD by TradingView

Technical analysis shows a flat movement in the EUR/USD on Thursday as it moves near the middle band of the Bollinger Bands. Presently, the pair is trading between the middle and upper bands, hinting at a potential slight decline towards the middle band. Additionally, the Relative Strength Index (RSI) stands at 64, indicating a sustained bullish bias.

Resistance: 1.0890, 1.0935

Support: 1.0835, 1.0772

XAU/USD (4 Hours)

XAU/USD  Surges Amidst Weaker Dollar and Economic Reports

Spot Gold, represented by XAU/USD, surged as it broke above the $1,975 resistance level, reaching its highest point in over a week. The rally was fueled by a weaker US Dollar and declining Treasury yields. Despite reports showing a rise in weekly Jobless Claims and a contraction in Industrial Production, Gold soared over $20, propelled by technical factors and the growing sentiment that the Federal Reserve is halting interest rate hikes. With the focus now on the bond market’s volatility and overall risk sentiment, the looming question is the potential height of XAU/USD’s weekly close, as upcoming US data is unlikely to significantly alter the current trajectory.

Chart XAUUSD by TradingView

Technical analysis indicates that XAU/USD moving higher on Thursday, aiming for the upper band of the Bollinger Bands. Currently, the gold price hovers slightly below this band, hinting at a potential slightly higher movement to push the upper band. The Relative Strength Index (RSI) is currently at 65, indicating that the XAU/USD pair is still exhibiting a slight bullish bias.

Resistance: $1,992, $2,008

Support: $1,973, $1,955

Economic Data
CurrencyDataTime (GMT + 8)Forecast
GBPRetail Sales15:000.5%

New Products Launch – November 17, 2023

Dear Client,

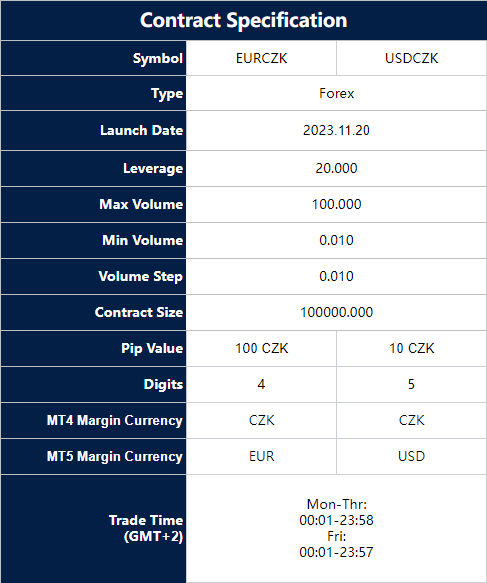
To provide you with more diverse trading options, VT Markets will launch 2 new products on 20th Nov 2023.

You can now trade the world’s popular products on MetaTrader 4 and 5 with the following specifications:

The above data is for reference only, please refer to the MT4 and MT5 platforms for the updated data.

If you’d like more information, please don’t hesitate to contact [email protected].

Notification of Server Upgrade – November 16, 2023

Dear Client,

As part of our commitment to provide the most reliable service to our clients, there will be server maintenance this weekend.

Maintenance Hours :
18th of November 2023 (Saturday) 00:00 – 06:00 (GMT+2)

Please note that the following aspects might be affected during the maintenance:

1. The price quote and trading management will be temporarily disabled during the maintenance. You will not be able to open new positions, close open positions, or make any adjustments to the trades.

2. There might be a gap between the original price and the price after maintenance. The gaps between Pending Orders, Stop Loss and Take Profit will be filled at the market price once the maintenance is completed.

3. Please refer to MT4/MT5 for the latest update on the completion and market opening time. Our services will be back online once the maintenance is completed.

4. Please note after the Phase 2 maintenance finished, the system time will change from (GMT+3) to (GMT+2)

Thank you for your patience and understanding about this important initiative.

If you’d like more information, please don’t hesitate to contact [email protected]

Dividend Adjustment Notice – November 16, 2023

Dear Client,

Please note that the dividends of the following products will be adjusted accordingly. Index dividends will be executed separately through a balance statement directly to your trading account, and the comment will be in the following format “Div & Product Name & Net Volume ”.

Please refer to the table below for more details:

The above data is for reference only, please refer to the MT4/MT5 software for specific data.

If you’d like more information, please don’t hesitate to contact [email protected].

Market Update: Stocks Extend Gains on Positive Inflation Data, Dollar Rebounds Amid Economic Swings

After positive inflation data, stock markets continued their climb, marked by modest gains in the S&P 500, Nasdaq Composite, and Dow Jones Industrial Average. However, despite a notable drop in the producer price index, retail sales declined, painting a mixed economic picture. Corporate highlights included Target’s 18% surge on strong Q3 results and V.F. Corp’s 14% rise post-JPMorgan’s upgrade. Currency markets saw the US dollar rebound after strong retail sales, influencing US Treasury yields and readjusting rate-cut forecasts. EUR/USD faced resistance, while USD/JPY surged and GBP/USD declined amidst varied economic data. Commodity-linked currencies like CAD and AUD held steady amid global growth expectations and the dollar’s resurgence despite falling oil prices.

Stock Market Updates

Wednesday saw stocks maintaining their upward momentum after favorable inflation data. The S&P 500 inched up by 0.16%, reaching 4,502.88 at closing, and the Nasdaq Composite recorded a slight 0.07% rise, closing the day at 14,103.84. The Dow Jones Industrial Average climbed by 0.47%, gaining 163.51 points to close at 34,991.21. The 10-year U.S. Treasury yield rose by 9 basis points, reaching 4.537%, rebounding after slipping below 4.5% previously.

October’s producer price index, a measure of wholesale prices, experienced its most significant drop since April 2020, decreasing by 0.5%. However, retail sales also declined, presenting a mixed picture of economic data. These movements followed a strong prior session triggered by the consumer price index remaining flat for October, contrary to expectations of a slight increase.

In the corporate world, Target’s stocks surged almost 18% after surpassing third-quarter expectations, while V.F. Corp’s shares rose 14% post an upgrade from JPMorgan. Meanwhile, the focus shifted to Washington as lawmakers aimed to avert a government shutdown. The House of Representatives passed a bill for a “laddered” continuing resolution, moving it to the Senate for a vote to avoid a potential federal shutdown by week’s end.

Data by Bloomberg

On Wednesday, the market showed a mix of positive and negative movements across sectors. Sectors like Consumer Staples (+0.70%), Communication Services (+0.60%), and Financials (+0.57%) saw gains, while Information Technology (-0.08%), Utilities (-0.33%), and Energy (-0.34%) experienced slight declines. Overall, the market displayed a balanced but somewhat subdued performance with some sectors in the positive territory and others marginally down.

Currency Market Updates

Recent currency market fluctuations, especially regarding the US dollar, reflect a responsive pattern to economic data and evolving rate forecasts. Following Tuesday’s post-CPI decline, the US dollar index saw a rebound fueled by stronger-than-expected US retail sales. This upward momentum in sales contributed to a rise in US Treasury yields, which helped alleviate the intensified selling pressure on the US currency. As a result, the extreme dovish predictions for Federal Reserve rate cuts in the second quarter of 2024 and beyond were tempered, with the market recalibrating its year-end rate-cut estimates.

The EUR/USD pair encountered a 0.3% drop to 1.0848 amidst the surge in US Treasury yields, unable to breach the resistance level of around 1.0882 for the second consecutive session. In contrast, USD/JPY surged past the 151 mark, targeting the 2022 high at 151.94, buoyed by favorable US-Japan rate spreads and the absence of pronounced dovishness from the Fed or hawkishness from the BoJ. Conversely, GBP/USD faced downward pressure, initially triggered by lower-than-expected UK CPI figures and further exacerbated by the robust performance of US retail sales. Additionally, commodity-linked currencies like CAD and AUD maintained modest gains despite a decline in oil prices, leveraging the rise in global growth expectations prompted by falling rates and the US dollar’s resurgence.

Picks of the Day Analysis
EUR/USD (4 Hours)

EUR/USD Retracement Amidst Fed Sentiment: Analyzing Dollar Dynamics

The EUR/USD pair experienced a corrective dip from its recent highs near 1.0900 to around 1.0830. Nevertheless, the prevailing bias suggests an upward trajectory, driven by declining confidence in the US Dollar. The Federal Reserve’s apparent conclusion on interest rate hikes following subdued inflation data triggered a Dollar retreat. However, the USD showcased resilience post-data release, backed by a rebound in US yields. While the negative Dollar sentiment prevails, the USD’s strength is evident against a backdrop of comparatively robust US economic performance. This correction in EUR/USD is viewed as a temporary adjustment in light of ongoing market expectations regarding the Fed’s stance on rates. The coming US economic data could further impact the pair’s movement.

Chart EURUSD by TradingView

Technical analysis shows a slight downward movement in the EUR/USD on Wednesday as it eased from the upper band of the Bollinger Bands. Presently, the pair is trading between the middle and upper bands, hinting at a potential slight decline towards the middle band. Additionally, the Relative Strength Index (RSI) stands at 71, indicating a sustained bullish bias.

Resistance: 1.0890, 1.0935

Support: 1.0835, 1.0772

XAU/USD (4 Hours)

XAU/USD Edges Lower Amid Dollar Rebound: Short-Term Upside Bias Persists

Spot Gold, represented by XAU/USD, encountered a retreat after hitting a weekly peak at $1,975, struggling to maintain ground above $1,970. This pullback was influenced by a US Dollar correction and a resurgence in US yields. Despite this, the immediate trajectory for Gold seems inclined toward further upward movement. Recent economic data, including the Producer Price Index (PPI), decline and softer Retail Sales, suggests a cooling of inflationary pressures, reinforcing the Dollar’s dip on Tuesday. Factors such as ongoing risk appetite, sturdy US bonds, and the Dollar’s vulnerability may continue to bolster Gold’s prospects. However, upcoming US releases like the Jobless Claims report and Industrial Production could potentially sway market sentiments, impacting Gold’s trajectory amid changing yield dynamics.

Chart XAUUSD by TradingView

Technical analysis indicates that XAU/USD remained stable on Wednesday, aiming for the middle band of the Bollinger Bands. Currently, the gold price hovers slightly above this band, hinting at a potential minor decline towards this level. The Relative Strength Index (RSI) is currently at 52, indicating that the XAU/USD pair is still exhibiting a neutral bias.

Resistance: $1,970, $1,992

Support: $1,955, $1,933

Economic Data
CurrencyDataTime (GMT + 8)Forecast
USDUnemployment Claims21:30221K
Back To Top
server

Hello there 👋

How can I help you?

Chat with our team instantly

Live Chat

Start a live conversation through...

  • Telegram
    hold On hold
  • Coming Soon...

Hello there 👋

How can I help you?

telegram

Scan the QR code with your smartphone to start a chat with us, or click here.

Don’t have the Telegram App or Desktop installed? Use Web Telegram instead.

QR code