In November, South Africa’s private sector credit rose to 7.79%, up from 7.26%
Private sector credit in South Africa rose to 7.79% in November from 7.26% earlier. This increase indicates that economic activities in the country are ongoing.
In the forex market, the EUR/USD pair is struggling to stay above 1.1750 as we close out 2025. The US Dollar remains popular, putting pressure on this currency pair.
EUR/JPY remains stable around 183.80 as bullish momentum is expected with resistance above 185.00.
European Central Bank Policy Update
In December, the European Central Bank (ECB) decided to keep interest rates the same. They hinted that this would continue for now. As of now, there is a less than 10% chance of a 25 basis point rate cut in February 2026. Looking at the charts, the EUR/JPY (Euro-Japanese Yen) shows an upward trend, upheld by the 100-day EMA at 177.80. The currency is trading close to the upper Bollinger Band, with a positive Relative Strength Index (RSI) at 61.05, indicating that it’s not in overbought territory. Key factors influencing the Japanese Yen include the Bank of Japan’s (BoJ) policy, bond yield differences, and overall market sentiment. The BoJ’s very loose monetary policy has caused the Yen to weaken, but recent changes may offer some support. The Yen often gains value during market turmoil, acting as a safe haven. Currently, the EUR/JPY pair is stable around 183.80, and we expect it to maintain positive momentum as we enter the new year. Watch for resistance at 185.25; if it breaks above this level in early January, we could see further gains for the currency pair.Options Trading Strategies
The Bank of Japan’s slow exit from its loose policy is the key factor holding back the Yen’s strength. For November 2025, core inflation in Japan dipped to 2.5%. While this is above the BoJ’s 2% target, it indicates a cautious approach, disappointing those who expected a more aggressive tightening. In contrast, the ECB seems happy to keep rates steady for now. Recent estimates for December 2025 showed Eurozone inflation at 2.9%, giving the ECB little reason to consider rate cuts soon. This difference in policy between the cautious BoJ and the steady ECB is driving the upward trend for the Euro. For those trading derivatives, buying call options with a strike price above 185.25 might be a smart move to take advantage of a potential breakout soon. Alternatively, selling out-of-the-money put options could earn premium income by betting that support at 182.95 will hold. The low trading volume during the holidays may cause some ups and downs, but the overall bullish trend seems strong. It’s important to keep the big picture in mind. The BoJ only ended its negative interest rate policy in March 2024. The market views the current tightening as historically slow, which has been a key reason for Yen weakness over the past year. This long-term view supports the idea that any price pullbacks could be good buying opportunities. Create your live VT Markets account and start trading now.GBP/USD remains around 1.3460, testing 1.3450 support after dropping below the nine-day EMA
GBP/USD has not changed for two days, trading around 1.3460 during Wednesday’s Asian session. The daily chart shows a decrease in bullish sentiment as the pair slips below the lower line of its upward channel.
The nine-day Exponential Moving Average (EMA) is above the 50-day EMA, suggesting a still bullish outlook. The pair hovers just below the short-term average but stays well above the medium-term average, indicating ongoing support for the trend. The 14-day Relative Strength Index (RSI) is at 61.0, showing a positive stance without signs of overbuying.
Rebounding Above Nine-Day EMA
If GBP/USD rebounds above the nine-day EMA of 1.3462, it could aim for the three-month high of 1.3534 set on December 24. A close above 1.3534 may allow the pair to reach the upper boundary of the ascending channel near 1.3690. If it falls below the short-term average and the channel, the 50-day EMA at 1.3351 would be the first significant support level, which could diminish upward momentum. A further drop might push GBP/USD toward the eight-month low of 1.3010. Recent data shows the British Pound is weakest against the US Dollar today, reflecting various percentage changes among major currencies. Akhtar Faruqui, a Forex Analyst, is recognized for his detailed market insights from New Delhi.Critical Point Around 1.3460
The GBP/USD pair sits at a crucial point around 1.3460, having dipped just below its recent upward channel. While moving averages support the underlying trend, this pullback signals caution. Traders should prepare for potential movements in either direction as 2026 begins. Those anticipating a rebound might consider buying call options with a strike price above the three-month high of 1.3534. The positive RSI reading of 61.0 indicates potential for upward movement without the market being overbought. This bullish perspective is backed by the latest UK inflation data from November 2025, showing a persistent 3.8%, which kept the Bank of England’s stance hawkish in its last meeting. Conversely, the current weakness could escalate, especially since the pound was the weakest performer against the dollar today. A drop below the 50-day EMA at 1.3351 would send a strong bearish signal; traders could use put options to benefit from a possible decline towards the 1.30 level. This serves as a reminder of the steep drops in 2022, highlighting how quickly sentiment on the pound can change. This fundamental divergence is crucial, as the latest US core PCE inflation reading fell to 3.0%, leading many to believe that the Federal Reserve might cut rates by mid-2026. In this uncertain environment, using options spreads is a smart way to manage risk while positioning for either an upward break due to persistent UK inflation or a downward move if US economic strength prevails. Employment and inflation reports from both countries in the coming weeks will likely trigger the next significant market movement. Create your live VT Markets account and start trading now.Xi Jinping will implement proactive macroeconomic policies to boost economic growth and quality.
Chinese President Xi Jinping is dedicated to enacting more active macroeconomic policies. His goal is to enhance the economy, leading to effective quality improvements and reasonable growth.
Currently, the AUD/USD pair is trading at approximately 0.6690, showing a slight decrease of 0.04% for the day.
Factors Affecting The Australian Dollar
The Australian Dollar (AUD) is influenced by various elements, such as interest rates set by the Reserve Bank of Australia (RBA), iron ore prices, and the state of the Chinese economy. Market sentiment also plays a role, with a risk-on environment benefiting the AUD. The RBA influences the AUD by setting interest rates to keep inflation between 2-3%. Higher interest rates bolster the AUD, while the RBA utilizes quantitative easing and tightening to shape credit conditions. As Australia’s largest trading partner, China significantly affects the value of the AUD. When China’s economy does well, demand for the AUD tends to rise. Iron ore, Australia’s top export, directly impacts the AUD as well. When iron ore prices rise, the AUD benefits from increased demand, improving the trade balance. The Trade Balance, which measures the gap between export earnings and import payments, also affects the AUD. A positive Trade Balance strengthens the AUD, while a negative one has the opposite effect.Chinese Economic Stimulus And Its Effects
China’s indication of increasing economic stimulus is an important update as we enter the new year. This suggests a likely rise in demand for Australian raw materials, potentially boosting the Australian dollar in the weeks ahead. We can already see a response in iron ore prices, which are vital for Australia’s economy. Futures prices have risen to around $125 per tonne this week, recovering from earlier lows in the fourth quarter of 2025. Historically, as observed during the ups and downs of 2023 and 2024, a rise in iron ore demand has strongly supported the AUD. This call for stimulus is expected, given recent data from China. Industrial production in November 2025 increased by only 4.1%, falling short of analysts’ expectations. The new policy measures are aimed at addressing this economic weakness. With the AUD/USD currently around 0.6690, we should consider positioning ourselves for a possible increase in the first quarter of 2026. In this environment, call options on the AUD/USD may be a smart strategy to capitalize on potential gains. We are looking for a breakout above the 0.6750 level, which has capped the pair for most of the last quarter. However, we need to keep a close eye on the Reserve Bank of Australia’s next steps. The RBA maintained its cash rate at 3.85% in December 2025, citing ongoing concerns about domestic inflation. Any indication of a future rate cut could limit the AUD’s upward potential, creating tension between Chinese demand and Australian monetary policy. Create your live VT Markets account and start trading now.During late Asian trading, USD/JPY nears 156.60 as the US dollar strengthens
The USD/JPY exchange rate has climbed to about 156.60, thanks to a stronger US Dollar. This increase follows the US Dollar Index reaching its highest weekly level near 98.30, after the release of dovish FOMC minutes that suggest a return to a neutral policy stance.
Federal Reserve officials are thinking about easing monetary policy further, even after a recent rate cut of 75 basis points, bringing rates down to between 3.50% and 3.75% by 2025. The CME FedWatch tool predicts an additional 50 basis points cut in 2026.
Influences on the Japanese Yen
The Japanese Yen is under selling pressure due to uncertainty around the Bank of Japan’s (BoJ) short-term policy, even as the government provides fiscal support for economic growth. BoJ officials expect more interest rate cuts as they notice changes in how companies set wages. Factors affecting the Yen include the BoJ’s monetary policy, the difference in bond yields between the US and Japan, and overall market sentiment. Recent shifts in Japan’s policies and international rate cuts are impacting the Yen’s value. During times of market stress, the Yen often has safe-haven appeal, making it a choice for investors seeking stability. As we approach the end of 2025, the US dollar is gaining strength against the Yen, driving the USD/JPY pair upwards towards 156.60. The US Dollar Index also shows a weekly high, indicating that the dollar is broadly strong as we enter the new year. This trend is likely to continue in the near future. The Federal Reserve’s latest minutes suggest they are leaning toward further rate cuts in 2026 to support the job market, particularly after US job growth slowed to 155,000 in November, and unemployment rose to 4.1%. Although these dovish signals are present, the dollar continues to rise because the market has mostly already priced in the Fed’s rate cuts. In 2025, we have already seen the Fed reduce rates by a total of 75 basis points.Policy Differences and Trading Strategy
Meanwhile, the Bank of Japan is indicating a gradual shift away from its ultra-loose monetary policy, but traders remain doubtful about any immediate changes. Japan’s economy is still weak, with the latest Tokyo Core CPI data for December 2025 at a low 1.5%, well below the central bank’s target. This makes it challenging for the BoJ to raise interest rates significantly. This difference in policies creates a notable interest rate gap, which is a major driver. The yield on a 10-year US Treasury bond is around 3.8%, while the equivalent Japanese government bond is below 1%. This significant difference makes it attractive to hold US dollars and sell Japanese yen, a strategy known as carry trade. For derivative traders, this suggests that the path of least resistance for USD/JPY is still upward. Buying call options with strike prices around 158.00 or 159.00 for the upcoming weeks allows us to gain from the continued weakness of the yen while limiting our potential losses. This strategy helps us stay aligned with the trend, especially as the pair may retest the highs near 160 from 2024. Given the limited trading activity during the holiday season, we should look for any potential dips to set our positions. A small pullback towards the 155.00 level could be an excellent entry point for long-dated futures or bullish options trades. The key is to utilize derivatives to keep our risk defined, as the Fed’s dovish outlook could lead to a sharp reversal if US economic data weakens more than expected in early 2026. Create your live VT Markets account and start trading now.Dividend Adjustment Notice – Dec 31 ,2025
Dear Client,
Please note that the dividends of the following products will be adjusted accordingly. Index dividends will be executed separately through a balance statement directly to your trading account, and the comment will be in the following format “Div & Product Name & Net Volume”.
Please refer to the table below for more details:
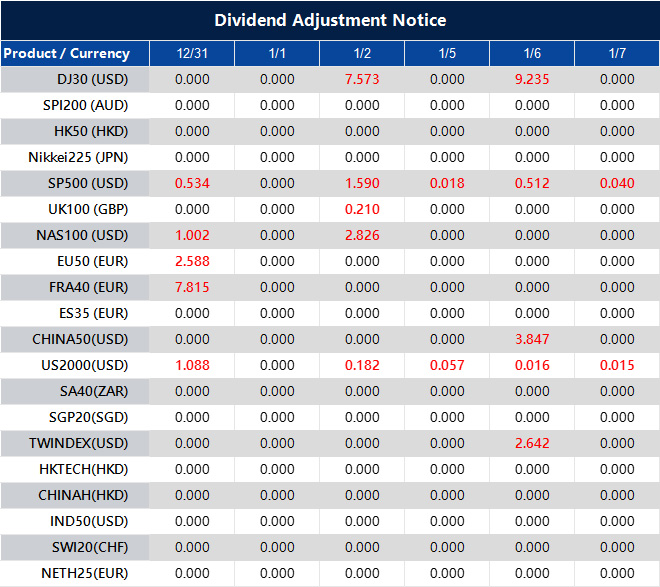
The above data is for reference only, please refer to the MT4/MT5 software for specific data.
If you’d like more information, please don’t hesitate to contact [email protected].
Gold prices in Saudi Arabia decline, according to recent data.
Gold prices in Saudi Arabia fell on Wednesday. A gram of gold is now priced at 522.26 SAR, down from 523.51 SAR the day before. The price for a tola also dropped to 6,091.71 SAR from 6,106.14 SAR.
Gold is available in different measurements: 10 grams costs 5,222.94 SAR, and a troy ounce is valued at 16,244.48 SAR. FXStreet updates gold prices daily, adjusting international rates to local currency and units.
Reasons for Gold Investment
People invest in gold because it has historically been a reliable store of value and a means of exchange. It is viewed as a safe-haven asset and helps protect against inflation and currency loss. Central banks hold the most gold, diversifying their reserves to strengthen their economies. In 2022, they made significant purchases, with emerging economies like China, India, and Turkey increasing their reserves. Gold usually moves in the opposite direction of the US Dollar and US Treasuries. When these decrease in value, gold prices often rise, making it a preferred choice during unstable times. Factors like geopolitical instability, recession fears, and interest rates also affect gold prices, particularly the US Dollar’s performance. Today’s slight dip in gold prices is less significant compared to the broader economic trends. Gold generally performs well when interest rates are expected to drop. The market believes the Federal Reserve might start lowering rates in early 2026, making holding gold less costly for traders. This suggests that traders may want to consider long positions using futures contracts or call options.Impact of Currency and Economic Trends on Gold Prices
It’s important to note gold’s inverse relationship with the US Dollar. The Dollar Index (DXY) has recently weakened, dropping below the 101 mark in late 2025. This trend typically benefits commodities priced in dollars. Ongoing geopolitical instability throughout 2025 has further confirmed gold’s status as a safe-haven asset, enhancing its demand. Purchases by central banks have created a solid support for gold prices, protecting traders from potential losses. According to World Gold Council data, central banks purchased over 800 tonnes of gold in the first three quarters of 2025, matching the record-breaking activity of 2022. This constant demand from major institutions makes aggressive short positions risky in the current climate. Although inflation has decreased from its peak, the November 2025 CPI at 3.1% shows it remains significantly above the Fed’s 2% target. This keeps gold’s role as an inflation hedge relevant. Ongoing inflation, paired with slowing growth reflected in the Q3 2025 GDP data, creates a favorable environment for gold. Traders might consider using options on gold ETFs to prepare for volatility around key economic data releases early next year. Create your live VT Markets account and start trading now.Gold prices in the Philippines remain stable, showing little change according to recent data.
Gold prices in the Philippines are steady. According to FXStreet, the price is 8,232.77 Philippine Pesos (PHP) per gram on Wednesday, up slightly from 8,231.06 PHP on Tuesday. The price per tola is also stable at PHP 96,023.92, compared to PHP 96,005.45 the day before.
FXStreet calculates local gold prices by using global rates adjusted for the USD/PHP exchange rate. These local prices are updated daily based on market conditions, but actual rates may differ slightly.
Gold’s Historic Role as a Store of Value
Gold has always been viewed as a safe place to keep value, especially during economic trouble. Central banks, including those in China, India, and Turkey, are the main buyers, with 1,136 tonnes purchased in 2022, valued at around $70 billion. Gold prices tend to move in the opposite direction of the US Dollar and US Treasuries. When the Dollar weakens or interest rates go down, gold prices usually rise. Similarly, fears of geopolitical issues or recessions can increase gold’s attractiveness. However, a strong Dollar often puts a cap on gold price increases. The current stable gold price, about 8,232 PHP per gram, is crucial for positioning ahead of the new year. This period may signal a buildup before potential volatility. Historically, a quiet year-end can lead to significant market movements as new investments come in January. It’s important to note that major central banks are suggesting potential interest rate cuts by 2026, a notable shift from the aggressive hikes seen in 2023. Lower interest rates typically make bonds less attractive, boosting interest in non-yielding assets like gold. This change hints that traders should expect upward pressure on gold prices.US Dollar Influence and Central Bank Demand
This view is supported by the ongoing weakening of the US Dollar, which negatively affects gold prices. Lower US interest rates usually decrease the Dollar’s strength, making gold cheaper for holders of other currencies and increasing its demand. Monitoring the Dollar Index (DXY) for breaks in key support levels could help confirm bullish gold trades. Additionally, strong demand from central banks acts as a solid support for prices. After record purchases of over 1,000 tonnes in both 2022 and 2023, reports indicate that emerging market central banks are still diversifying their reserves. This ongoing institutional buying helps limit price drops and supports a long-term upward trend. For derivative traders, the current low volatility makes long-dated call options an appealing strategy. This approach allows traders to take advantage of potential price rises in the first quarter of 2026 while keeping risk limited to the premium paid. Buyers might consider out-of-the-money calls or bull call spreads to profit from expected price increases. Create your live VT Markets account and start trading now.Gold prices have risen in the United Arab Emirates, based on recent data.
Understanding Gold Prices
On Wednesday, gold prices in the United Arab Emirates went up. The price per gram rose to 513.17 AED from 512.64 AED the day before. The price per tola increased to 5,985.55 AED, up from 5,979.38 AED. FXStreet adjusts international gold prices to AED and updates them daily based on real market rates. Local conditions can cause slight price variations. Gold has always been seen as a valuable asset and a reliable form of exchange. It’s considered a safe-haven investment during tough economic times. Many people view gold as protection against inflation and a weakening currency. Central banks are big buyers of gold, using it to diversify their reserves and support economic stability. In 2022, central banks added 1,136 tonnes of gold, valued at around $70 billion, to their reserves. Gold prices usually move in the opposite direction of the US Dollar and US Treasuries. They tend to rise when riskier investments decline. Factors like geopolitical instability and low interest rates often push gold prices higher, while a strong US Dollar generally keeps prices down.Current Market Strategies
Gold’s price often rises when the dollar weakens. Currently, at 513.17 AED per gram, we see this typical pattern. The US Dollar Index (DXY) has weakened in the latter half of 2025, currently around 97.5, following the Federal Reserve’s rate cuts earlier this year. This situation suggests that taking long positions in gold futures or buying call options could be a good strategy for the upcoming months. The demand for gold remains strong due to ongoing geopolitical uncertainties and institutional interest. Central banks are continuing their robust buying habits from 2022, with the World Gold Council reporting over 850 tonnes bought by the end of Q3 2025. This strong demand indicates that selling out-of-the-money put options might be a smart way to earn premiums while setting a lower entry point. Also, gold has low correlation with stock markets, especially as the S&P 500 approaches new highs near 5,500. With implied volatility in gold options relatively low compared to early 2024, buying long-dated call spreads can be a cost-effective strategy. It allows for potential gains if equity markets stumble in early 2026, while also managing risk in a market that seems increasingly unstable. This scenario is similar to what happened after the Federal Reserve changed its policy in late 2018, which led to a major gold rally in 2019. The combination of lower interest rates, a weaker dollar, and high market uncertainty created a favorable environment for gold. Given today’s similar conditions, maintaining a bullish position seems wise as we approach the new year. Create your live VT Markets account and start trading now.Indian rupee opens steady at 90.20 against the US dollar with low global volume
The USD/INR currency pair opened at 90.20 on the last trading day of 2025, showing minimal movement due to low trading volumes. Throughout the year, Foreign Institutional Investors (FIIs) sold off Rs. 30,752.24 crore in equities for nine months, largely because of ongoing trade tensions between the US and India.
In 2025, US-India trade relations deteriorated as the US imposed a 50% tariff on Indian imports, including a 25% tax on oil from Russia. Meanwhile, the US Dollar gained slight traction in Asian markets, supported by Federal Reserve officials advocating for more interest rate cuts to bolster the US job market.


