Fed raise the interest rate by 25bps as expected

The Dow closed flat Wednesday, as investors weighed up the Federal Reverse’s widely expected quarter-point rate hike and Fed Chairman Jerome Powell’s lack of pushback on the recent rally in stocks and easing financial conditions. 

The Dow Jones Industrial Average was up 0.02%, or 6 points, the S&P 500 rose 1.1%, and the Nasdaq Composite rose 2%.

On the economic front, data continued to show the labor market running hot. Weekly job openings and the December private jobs report came in better than expected, threatening to boost wage pressures and inflation.

Monetary policy decisions from other major central banks and US Nonfarm Payrolls will be crucial for clear directions.

The energy was the only sector in the red, falling more than 2% as oil prices fell after U.S. weekly crude stockpiles increased more than expected and OPEC and its allies stuck with their output policy unchanged. Final return rate at -1.89%.

Main Pairs Movement

DXY holds lower grounds near 100.90 as traders lick their wounds near the lowest levels since April 2022 during Thursday’s Asian session. At the time of writing, the DXY price at 102.205, dropped around 0.9% on the daily chart.

EUR/USD bulls cheer the Federal Reserve’s acceptance of easing price pressure, as well as Chairman Jerome Powell’s readiness for rate cuts if needed, by rising the most since November 2022 to poke the highest levels in 10 months, making rounds to 1.1000.

GBP/USD rallied overnight on US Dollar weakness following the Federal Reserve event. The pair burst through 1.2350 resistance. GBP/USD now depends on the Bank of England and US jobs data on Friday. At the time of writing, the price at 1.23822.

Gold price makes rounds to the highest levels since late April 2022, close to $1,955 during the mid-Asian session on Thursday. At the time of writing, the price trades at 1955.06.

Technical Analysis

EURUSD (4-Hour Chart)

The EUR/USD pair advanced higher on Wednesday, preserving upside momentum, and hit fresh highs above the 1.0910 mark after the release of US economic data. The pair is now trading at 1.0919, posting a 0.54% gain on a daily basis. EUR/USD stays in the positive territory amid a weaker US Dollar across the board, as the greenback lost its strength and stayed on the back foot following the disappointing Manufacturing PMI data. Meanwhile, the ADP employment report showed US private sector added 106K jobs in January, which is below the market expectation for an increase of 178K and also the lowest reading since January 2021. Investors are now waiting for the US Federal Reserve to announce its policy decisions following the first meeting of the year, as the central bank is expected to slow the pace of tightening further and deliver a 25 bps rate hike. In the Eurozone, the European Central Bank is also expected to raise interest rates by 50 basis points on Thursday as policymakers recently commented that more significant rate hikes are on the table.

For the technical aspect, RSI indicator 64 figures as of writing, suggesting that the risk skews to the upside as the RSI is rising sharply towards 70. As for the Bollinger Bands, the price moves out of the upper band, therefore a strong upside trend continuation can be expected. In conclusion, we think the market will be bullish as the pair is now testing the 1.0918 resistance level. Technical indicators also crossed their midlines into positive territory, which reflects bull signals.

Resistance:  1.0918, 1.0943, 1.1003

Support: 1.0830, 1.0780, 1.0722

GBPUSD (4-Hour Chart)

GBP/USD maintains nonvolatile ahead of the FOMC decision. The pair trimmed early gains and holds above 1.2300 on cautious market sentiment. The Fed is widely expected to raise interest rates by 25 bps amid signs of easing inflationary pressures. The bets were cemented by the US wage growth data released on Tuesday, which showed that labor costs increased less than expected in the fourth quarter. On the other hand, traders also focus on BoE Interest Rate Decision on Thursday. The BoE is estimated to raise rates by 50bps, leaving the Bank Rate at 4%. This and Fed Interest Rate Decision will provide some meaningful impetus to GBP/USD.

For the technical aspect, RSI indicator 36  figures as of writing, falling below mid-line on a continued downside correction. As for the Bollinger Bands, they are edging lower between the downward moving average and lower band, signaling that the bearish trend is more favored. A downtrend could persist. In conclusion, we think the market is in modest bearish mode as both indicators show some bearish potential. The pair is currently trading in a narrow range. A firm break out of the range is needed to confirm the follow-through trend. For the uptrend scenario, the price needs a firm break above resistance at 1.2426 to show bullish impetus. For the downtrend scenario, if the price drop below the support at 1.2292, it may trigger some technical selling and drag the GBP/USD pair further toward the next support at 1.2188.

Resistance: 1.2426, 1.2493, 1.2593

Support: 1.2292, 1.2188, 1.2000

XAUUSD (4-Hour Chart)

Gold rises to $1,940 area after Fed Interest Rate Decision. Following the Fed’s decision to raise interest rates by 25 bps, the benchmark 10-year US Treasury bond yield drops 3.25% to below 3.4%, helping the Gold price push higher. Meanwhile, the US dollar index declines 0.85% to 101.221, which also favors the dollar-denominated gold. At the time of writing, the Gold price is trading at $1,940.07, posting a 0.65% gain on a daily basis.

For the technical aspect, the RSI indicator is 60 figures as of writing, advancing to a bullish region from mid-line on bullish price action. As for the Bollinger Bands, the price surged to the upper band from the moving average, showing strong bullish momentum. In conclusion, we think the market is in bullish mode. A continued rise could be expected. For the uptrend scenario, the pair is testing resistance at $1,947. A firm break above the level could trigger some follow-through buying and push gold higher toward the next resistance at $1,957. For the downtrend scenario, the current support is at $1,920. If the Gold price closes below $1,920 on the 4H chart. It may trigger some technical selling and drag the pair toward critical support at $1,900.

Resistance: 1947, 1957, 1963

Support: 1920, 1900, 1873

Economic Data

CurrencyDataTime (GMT + 8)Forecast
GBPBoE Interest Rate Decision (Jan)20:004.00%
GBPBoE MPC Meeting Minutes20:00 
EURDeposit Facility Rate (Feb)21:152.50%
EURECB Marginal Lending Facility21:15 
EURECB Monetary Policy Statement21:15 
EURECB Interest Rate Decision (Feb)21:153.00%
USDInitial Jobless Claims21:30200K
EURECB Press Conference21:45 
GBPBoE Gov Bailey Speaks22:15 
EURECB President Lagarde Speaks23:15 

US Stocks rise as market focus on Fed decision

The Dow climbed Tuesday, to end the month in the green as investors digested a slew of mostly better-than-expected results just as focus shifts to the Federal Reserve decision due Wednesday.

The Dow Jones Industrial Average gained 1.1%, or 368 points, ending the month with a gain of about 2%. The Nasdaq Composite closed 1.7% higher. The S&P 500 rose 1.4% notching its best January since 2019.

US Treasury bond yields are downtrend slightly by 0.013% to  3.516%.

The Employment Cost Index (ECI) report released on Tuesday had an unusual impact across financial markets, with the US Dollar weakening after the numbers. Analysts at Well Fargo point out that the figures are one more in the list of inflation readings over which the Federal Reserve is breathing a little easier. They point out that while the report further supports inflation moving back toward the 2% target, labor cost growth remains too strong to be consistent with it staying there for the long haul.

Main Pairs Movement

DXY gauges the greenback vs. a bundle of its main rivals comes all over the way down to the 102.30 region after climbing to as high as the 102.60 area earlier on Tuesday. At the time of writing, the DXY exchanges hand at 102.089, dropping around 0.15% on the daily chart.

The EUR/USD pair is showing signs of a loss in the upside momentum after reaching near the immediate resistance of 1.0870 in the early Tokyo session. The shared currency pair has already displayed a responsive buying action after dropping to near the round-level support at 1.0800.

GBP/USD fails to cheer the US Dollar weakness much as Cable’s recovery from the weekly low fades around 1.2320 during early Wednesday. In doing so, the quote seems to justify the downbeat catalysts at home, mainly relating to inflation and housing markets.

XAUUSD stopped consecutive three days down trend, rebound around 0.26%, and closed at 1928 marks.

The yellow metal managed to cheer the broad US Dollar weakness, backed by the United States data and firmer equities.

Technical Analysis

EURUSD (4-Hour Chart)

The EUR/USD pair edged lower on Tuesday, coming under pressure but then rebounded slightly towards the 1.0850 area amid recovering market sentiment. The pair is now trading at 1.0854, posting a 0.06% gain on a daily basis. EUR/USD stays in the positive territory amid renewed US Dollar weakness, as the greenback lost its strength following the release of US labor costs data for the fourth quarter and allowed the EUR/USD pair to pull away from session lows. The US Employment Cost Index rises by 1% in Q4, which came in below the market expectation of 1% and points to more evidence of a slowdown in inflation. Therefore, the greenback tumbled after the report and lend support to the EUR/USD pair. In the Eurozone, the better-than-anticipated Euro-Zone Gross Domestic Product (GDP) failed to push the Euro higher as German Retail Sales plunged by 5.3% MoM in December, which is much worse than expected.

For the technical aspect, RSI indicator 49 figures as of writing, suggesting that the risk skews to the upside as the RSI is rising sharply towards the mid-line. As for the Bollinger Bands, the price regained upside momentum and rebounded toward the moving average, therefore a continuation of the upside trend can be expected. In conclusion, we think the market will be bullish as the pair is heading to test the 1.0868 resistance level. Bulls could take control of the pair if it breaks above the aforementioned resistance.

Resistance:  1.0868, 1.0918, 1.0942

Support: 1.0830, 1.0780, 1.0722

GBPUSD (4-Hour Chart)

GBP/USD continued to trade lower towards 1.2300 early Tuesday as the US dollar index maintained its strength amid risk-off sentiment. The pair is now trading at 1.2328, posting a 0.19% loss on a daily basis. GBP/USD could suffer additional losses in the near term if buyers fail to hold 1.2300. On Wednesday, the Fed would be the first to release the interest rate, expected to increase by 25bps, while the BoE is estimated to raise rates by 50bps, leaving the Bank Rate at 4%. Most analysts expect this would be the last increase by the BoE, which could exert some pressure on GBP/USD as rates in the US are expected to peak at 5%.

For the technical aspect, RSI indicator 41  figures as of writing, falling below mid-line as GBP/USD witnessed some short selling. As for the Bollinger Bands, the moving average started to move down, signaling that the current trend started to change modestly. A downtrend could persist. In conclusion, we think the market is in modest bearish mode as both indicators show some bearish potential. For the uptrend scenario, the price needs a firm break above resistance at 1.2426 to show bullish impetus. For the downtrend scenario, if the price drop below the support at 1.2292, it may trigger some technical selling and drag the GBP/USD pair further toward the next support at 1.2188.

Resistance: 1.2426, 1.2493, 1.2593

Support: 1.2292, 1.2188, 1.2000

XAUUSD (4-Hour Chart)

The gold price was volatile on Tuesday. Earlier, the Gold price tumbled to $1,900.94, slightly above the round-figure mark of $1,900, as the US dollar index strengthened. However, traders turned their back on the US dollar later in the US trading session, and the Gold price managed to recover its lost territory back to the $1930 level. At the time of writing, the Gold price is trading at $1,929.94, posting a 0.36% gain on a daily basis. On the other hand, The Fed will announce its policy decision at the end of a two-day meeting on Wednesday and is expected to raise interest rates by 25 bps. Apart from this, traders will focus on the Bank of England (BoE) meeting and the European Central Bank (ECB) decision, both scheduled on Thursday. Any hawkish signals from major central banks will more likely be negative for Gold prices.

For the technical aspect, RSI indicator 53 figures as of writing, surging from oversell region as prices recover strongly from $1900. As for the Bollinger Bands, the price surged from the lower band and currently holds around the moving average. In conclusion, we think the market is in a modest bearish mode. Though both indicators show no strong bearish signal, the price has made a lower low on correction and the fundamental outlook seems weighing on the gold price as well. For the downtrend scenario, the current support is at the $1900 round-figure mark. If the price closes below critical support at $1900, bulls may surrender and trigger some follow-through selling.  For the uptrend scenario, the pair should establish itself above the current support at $1900. To regather bullish strength, it should also recover the lost territory from the multi-month high around the $1,949 zone, which has become a strong barrier in the near term for bulls.

Resistance: 1947, 1957, 1963

Support: 1900, 1873

Economic Data

CurrencyDataTime (GMT + 8)Forecast
CNYCaixin Manufacturing PMI (Jan)09:4549.5
EURGerman Manufacturing PMI (Jan)16:5547
GBPManufacturing PMI (Jan)17:3046.7
EURCPI (YoY) (Jan)18:009.00%
USDADP Nonfarm Employment Change (Jan)21:15178K
USDISM Manufacturing PMI (Jan)23:0048
USDJOLTs Job Openings (Dec)23:0010.250M
USDCrude Oil Inventories23:300.376M

Market awaits FOMC meeting and US Non-Farm data release

The Nasdaq 100, tumbled almost 2%. The S&P 500 and the Dow Jones slashed 1.30% and 0.77% of their value as traders prepared for the US Federal Reserve Open Market Committee (FOMC) decision on Wednesday. Hence, a busy US economic calendar was one of the main reasons for the US Dollar to appreciate against most G8 currencies.

Reflection of the aforementioned is US Treasury bond yields, precisely the US 10-year benchmark note rate, finished Monday with gains of three and a half basis points. Up at 3.542%, underpinned the greenback.

Tech stocks pulled the major indexes lower ahead of the Fed’s announcement. The central bank is expected to raise interest rates another quarter of a percentage point on Wednesday, and investors are hoping to get a hint of where the Fed is headed this year.

The Federal Reserve kicks off its two-day meeting on Tuesday, but with the prospect of a downshift to a 25-basis-point rate hike almost priced in for Wednesday, investors are expecting Fed chairman Jerome Powell to signal more hikes ahead and push back against expectations that the Fed could cut rates later this year. (Reference from Investing. com)

Main Pairs Movement

DXY a measure of the greenback’s value against a basket of six currencies continues to recover and prints gains for three straight days, finishing Monday’s session with gains of 0.31% amidst risk aversion. At the time of writing, the DXY exchanges hand at 102.242.

EUR/USD seesaws around 1.0850 as bears take a breather after breaking important support. With this, the major currency pair confirms its place on the seller’s radar even if it probes the three-day downtrend with its latest inaction. During Monday’s trading course, the closed price dropped 0.16% on the daily chart.

GBPUSD dropped around 0.3% throughout Monday’s trading, price closed at $1.2350. Cable holds lower grounds after a two-day downtrend, making rounds to 1.2350 during early Tuesday morning in Asia.

XAUUSD’s price lost 0.23% throughout Monday’s trading. The yellow metal has drifted lower for a third day and is testing structure as we head towards key events this week. The bull could emerge ahead of the Feds.

Technical Analysis

EURUSD (4-Hour Chart)

The EUR/USD pair edged higher on Monday, failing to preserve its upside momentum, and retreated towards the 1.0870 mark as the upbeat sentiment data from the Eurozone helps the Euro stay resilient against its rivals. The pair is now trading at 1.0870, posting a 0.04% gain daily. EUR/USD stays in the positive territory despite a stronger US Dollar across the board, as investors are preparing for the US Federal Reserve Open Market Committee (FOMC) meeting that will begin on Tuesday. The markets have been pricing in a greater chance of a 25 basis points (bps) rate hike amid signs of easing inflationary pressures in the US, which might weigh on the greenback and lend support to the EUR/USD pair. In the Eurozone, the Euro area Economic Sentiment Indicator improves at a stronger pace to 99.9 in January, which acted as a tailwind for the shared currency Euro. Meanwhile, the hopes of stronger rate hikes from the ECB remain amid receding hawkish bias from the Fed.

For the technical aspect, RSI indicator 47 figures as of writing, suggesting that the pair could witness heavy bearish momentum as the RSI is falling sharply below the mid-line. As for the Bollinger Bands, the price declined sharply and dropped below the moving average, therefore the downside traction should persist. In conclusion, we think the market will be bearish as the pair is heading to test the 1.0858 support level. On the upside, the pair could gain bullish momentum once above the 1.0919 resistance.

Resistance:  1.0919, 1.1032

Support: 1.0858, 1.0807, 1.0779

GBPUSD (4-Hour Chart)

GBP/USD struggles to hold above 1.2400. In the second half of Monday, the pair witnessed some bearish traction and fell below 1.224. The market sentiment ahead of key events this week seems to support the US dollar index and therefore exert pressure on its rivals. The pair is now trading at 1.2368, posting a 0.22% loss daily. Meanwhile, the US dollar index holds above 102 level, now at 102.18, and the benchmark 10-year US Treasury bond yield rises 1% to above 3.5%, making it difficult for GBP/USD to gain upside traction.

For the technical aspect, RSI indicator 47  figures as of writing, failing to provide a directional clue as the RSI indicator maintains around mid-line without significant movement. As for the Bollinger Bands, the price is moving up and down around the horizontal moving average, signaling that the pair is lack main traction. In conclusion, we think the market is in consolidation mode until there is a decisive breakthrough to trigger follow-through buying or selling. For the uptrend scenario, the price needs a firm break above resistance at 1.2426 to show bullish impetus. For the downtrend scenario, if the price drop below the support at 1.2341, it may trigger some technical selling and drag the GBP/USD pair further toward the next support at 1.2292.

Resistance: 1.2426, 1.2493, 1.2593

Support: 1.2341, 1.2292, 1.2188

XAUUSD (4-Hour Chart)

The gold price has lost its upside traction and fell toward $1,920 after having advanced above $1,930 in the European trading session. The market sentiment ahead of key events this week seems to support the US dollar index. Meanwhile, the benchmark 10-year US Treasury bond yield rose 1% to above 3.5%, making it difficult for Gold prices to gain upside traction. At the time of writing, the Gold price is trading at $1,923, posting a 0.23% loss daily.

For the technical aspect, RSI indicator 44 figures as of writing, close to mid-line, failing to provide a directional clue as the RSI indicator keeps moving up and down around mid-line for a while. As for the Bollinger Bands, the price keeps edging below the horizontal moving average, signaling that the pair is turning weak from the latest uptrend. In conclusion, we think the market is in modest bearish mode since both indicators show the uncertainty of traction. Besides, we can see the price keeps edging lower and testing support at $1922. For the downtrend scenario, a convincing break below the support at $1922 may trigger some technical selling and drag the Gold price back toward the $1,900 round-figure mark. For the uptrend scenario, the pair should establish itself above the current support at $1922 first. To regather bullish strength, it should also recover the lost territory from the multi-month high around the $1,949 zone, which has become a strong barrier in the near term for bulls.

Resistance: 1947, 1957, 1963

Support: 1922, 1900, 1873

Economic Data

CurrencyDataTime (GMT + 8)Forecast
CNYManufacturing PMI (Jan)09:3049.8
EURGerman Unemployment Change (Jan)16:555K
EURGerman CPI (YoY) (Jan)21:009.2%
CADGDP (MoM) (Nov)21:300.1%
USDCB Consumer Confidence (Jan)23:00109.0

Slower Inflation pressure, softer Fed?

U.S. equities enjoyed another rally on Friday to close the week on a positive note. The Dow Jones Industrial Average climbed 0.08% to close at 33978.08. The S&P 500 gained 0.25% to close at 4070.56. The tech-heavy Nasdaq Composite rose 0.95%  to close at 11621.71. On Friday, Fed’s favorite U.S. inflation gauge, the U.S. PCE price index figure was released coming in at 0.3%, in line with broad market expectations.

Signs of slowing inflationary pressure have once again convinced market participants to bet on a softer Fed FOMC move this week. Markets are now broadly pricing in a more than 80% chance of a 25 basis point interest rate hike at the upcoming FOMC interest rate decision.

The benchmark U.S. 10-year treasury yield edged higher throughout Friday and was last seen trading at 3.509%. The policy-sensitive 2-year treasury yield sits at 4.213%, as of writing.

Mainland China will resume trading after a week-long Lunar New Year break. Market participants around the globe are now looking at China to extend the January rally into February. Over this Lunar New Year break, consumer spending has outpaced the comparable period in 2019, providing a whiff of optimism for the week ahead.

Earnings season continues with Alphabet Inc headlining today’s earnings. Alphabet Inc. will report earnings after the market closes. Wallstreet analysts are predicting an EPS of 1.21.

Main Pairs Movement

The Dollar index, which tracks the U.S. Greenback against a basket of major foreign currencies, gained 0.1% throughout last Friday’s trading. The Dollar moved higher despite the U.S. PCE index showing inflation rising at the slowest rate since October 2021; furthermore, the Core PCE, which excludes the volatile food and energy prices, increased 0.3%, month over month, also in line with market expectations.

EURUSD retreated 0.21% throughout last Friday’s trading. The Euro fared worse against the Dollar as the Greenback gained attraction amid weaker consumer spending and softening price pressure.

GBPUSD lost 0.15% throughout last Friday’s trading. The cable could not hold on to gains from earlier last week and ended the week 0.07% lower as the Dollar regains traction.

XAUUSD lost 0.08% throughout last Friday’s trading. The yellow metal continued to lose ground after a 0.88% decline on the 26th. The haven asset now faces a critical support level at around the $1928 per ounce price region.

Technical Analysis

EURUSD (4-Hour Chart)

EUR/USD slid toward 1.086 on Friday. The US Dollar gathers support from the mostly upbeat US macro data released, which, in turn, exerts pressure on its rivals. On the other hand, expectations for a more hawkish European Central Bank (ECB) seem to provide some support to EUR/USD. The market focus is now shifting to the key central bank event risks next week. The Fed will announce its policy decision on Wednesday. This will be followed by the ECB Interest Rate Decision on Thursday, which will play a key role in determining the next traction for EUR/USD.

For the technical aspect, RSI indicator 46 figures as of writing, sliding to below the mid-line, signaling that the market is losing its upside traction. A downward correction could persist. As for the Bolling  Bands, the price is now moving below the moving average. The upward momentum seems weak as the moving average keeps horizontal in the near term. In conclusion, we think EUR/USD is in correction mode since the price is edging lower toward the support at 1.0861. Besides, both the RSI indicator and Bolling  Bands signal that the pair is under pressure. For the uptrend scenario, the pair is testing support at 1.0861. The bulls must defend this level first to retain control. For the downtrend scenario, if the price drop below the support at 1.0861, it may trigger some technical selling and drag the EUR/USD pair further toward the next support at 1.0710.

Resistance:  1.0918, 1.1032, 1.1131

Support: 1.0861, 1.0780, 1.0710

GBPUSD (4-Hour Chart)

The GBP/USD pair continues with its struggle to find acceptance above the 1.2400 mark and comes under some selling pressure on the last day of the week and is set to finish Friday with losses of at least 0.20% Though the inflation of the United States continues to wane but remains twice elevated of Fed’s target, the continue grows of this pair, close at 1.2406 at the end of Thursday then dropped toward 1.2370,  break the support at 1.2341. The US Federal Reserve (Fed) preferred gauge for inflation, the Core Personal Consumption Expenditure (PCE) for December, climbed 4.4% YoY, lower than November’s 4.7%, cementing the Fed’s cause of lower the size of subsequent interest rate increases, throughout the remainder of the year. Headline inflation rose by 5% YoY, well above the Fed’s target of 2%.

For the technical aspect, RSI indicator 56  figures as of writing, above mid-line, but signaling no strong upward momentum. As for the Bollinger Bands, the price holds around the horizontal moving average, indicating that the pair is under consolidation. In conclusion, we think the market is in consolidation mode until there is a decisive breakthrough to trigger follow-through buying or selling. For the uptrend scenario, the price needs a firm break above resistance at 1.2426 to show bullish impetus. For the downtrend scenario, if the price drop below the support at 1.2341, it may trigger some technical selling and drag the GBP/USD pair further toward the next support at 1.2292.

Resistance: 1.2426, 1.2493, 1.2593

Support: 1.2341, 1.2292, 1.2188

XAUUSD (4-Hour Chart)

Gold price struggles to gain upside traction on Friday. The US Dollar gathers support from the mostly upbeat US macro data released, which, in turn, exerts pressure on the dollar-denominated gold. Meanwhile, The benchmark 10-year US Treasury bond yield rise to above 3.5% ahead of the weekend, not allowing Gold to gain traction. At the time of writing, the gold price is trading at 1929.51, trying to defend the 1930 area. As for the economic calendar, the market focus is shifting to the key central bank event risks next week. The Fed will announce its policy decision on Wednesday. This will be followed by the ECB Interest Rate Decision on Thursday, which will play a key role in determining the next traction for Gold price.

For the technical aspect, RSI indicator 49 figures as of writing, close to mid-line, signaling the uncertainty of direction and the lack of main traction as the RSI indicator keeps moving up and down around mid-line for a while. As for the Bollinger Bands, the price is now moving below the moving average. The traction seems weak as the moving average keeps horizontal in the near term. In conclusion, we think the market is in modest bearish mode since both indicators show the uncertainty of traction and the price keeps edging lower. For the downtrend scenario, if the price drop below the support at $1922, it may trigger some technical selling and drag the Gold price further toward the next support at $1898.

Resistance: 1947, 1957, 1963

Support: 1922, 1898, 1873

Economic Data

CurrencyDataTime (GMT + 8)Forecast
EURGerman GDP (QoQ) (Q4)17:00 

Week ahead: All eyes on US jobs data, BoE and ECB rate statements

The US jobs data and rate statements from the Bank of England (BoE) and the European Central Bank (ECB) are currently the focus of attention for many market participants. These announcements have the potential to significantly impact global financial markets, as they provide insights into the health of the respective economies and monetary policy decisions. 

With traders, investors, and economists eagerly awaiting these updates, the release of these data points is sure to cause market volatility.

Here are the key events for the week ahead:

Canada Gross Domestic Product m/m (31 January)

Canada’s economy grew 0.1% in October 2022, surpassing the earlier estimate of no growth. This marks a slowdown from the previous month’s 0.2% growth.

Experts predict no change in Canada’s economy in December 2022, forecasting 0% growth from November.

US ADP Non-Farm Employment Change (1 February)

The US private sector added 235,000 jobs in December 2022, surpassing November’s figure of 182,000. However, January is predicted to see a decline with only an additional 131,000 new jobs.

US ISM Manufacturing PMI (1 February)

The US ISM Manufacturing PMI declined to 48.4 in December 2022, marking the second consecutive month of contraction. This shift in spending from goods to services caused the decline. 

For January, analysts predict a PMI of 48.

FOMC Meeting and Rate Decision (1 February)

During the final Federal Open Market Committee (FOMC) meeting in December 2022, the US Fed increased the fed funds rate by 50bps to 4.25%-4.5%. Analysts predict a similar increase of 50bps this month.

BoE Monetary Policy Report (2 February)

At its December 2022 meeting, the BoE raised interest rates by 50bps to 3.5% with a 6-3 vote. This decision was made to control inflation and counteract concerns of an impending recession. Analysts anticipate the BoE will make another 50bps increase in this meeting.

ECB Monetary Policy Statement (2 February)

The ECB plans to raise interest rates by 50bps in February and March, with additional increases to follow. Analysts predict another 50bps increase this month.

US Non-Farm Employment Change (3 February)

In December 2022, the US economy experienced job growth of 223,000, the lowest since December 2020. The unemployment rate decreased to 3.5%. 

For January, analysts anticipate job growth of 175,000 and a slightly higher unemployment rate of 3.6%.

US ISM Services PMI (3 February)

In December 2022, the US ISM Services PMI dropped from 56.5 in November to 49.6. Analysts expect the PMI to remain in the 49-50 range this month.

US GDP expanded faster than expected

U.S. equities marched higher over the course of Thursday’s trading. The Dow Jones Industrial Average rose 0.61% to close at 33949.41. The S&P 500 climbed 1.1% to close at 4060.43. The tech-heavy Nasdaq Composite gained 1.76% to close at 11512.41. Market participants turned a blind eye to the mixed U.S. GDP report, which showed that, despite aggressive rate hikes from the Fed, the U.S. GDP expanded at a faster-than-estimated pace into the end of 2022. Consumer spending, accounting for 68% of GDP, increased 2.1%, down slightly from 2.3% in the previous period but still positive. Weekly jobless claims fell by 6000, down to 186000 for the lowest reading since April 2022.

U.S. Treasury yields ticked higher amid a strong rally across equity markets. The benchmark U.S. 10-year treasury yield edged above 3.5% and was last seen trading at 3.503%. The policy-sensitive 2-year treasury yield currently sits at 4.187%.

Intel failed to deliver on earnings for the fourth quarter of 2022; furthermore, the chip maker gave one of the gloomiest quarterly forecasts in its history. The company is predicting a surprise loss in the current period and a sales miss by billions of dollars. Intel Corp. reported an EPS of 0.1, missing Wall Street estimates by more than 50%. Q4 revenue came in at 14.04 Billion, 3.1% lower than general consensus. Intel shares traded nearly 10% lower in after-hours trading.

Main Pairs Movement

The Dollar index, which tracks the U.S. Greenback against a basket of major foreign currencies, advanced 0.17% over the course of yesterday’s trading. The Dollar was buoyed by surging demand for U.S. treasuries ahead of Friday’s U.S. PCE data release. Markets are now pricing in a 25 basis point increase by the Fed at the next FOMC meeting.

EURUSD lost 0.22% over the course of Thursday’s trading. The Euro fared worse against the Dollar as market participants bid up the Greenback. The strong U.S. job report also acted as a tailwind for the Dollar.

GBPUSD edged 0.07% higher over the course of yesterday’s trading. Cable continued to advance after a 0.51% gain on Wednesday. U.K. PMI, which was released on the 24th, indicated a drop in prices.

XAUUSD dropped 0.88% over the course of Thursday’s trading. The Dollar denominated Gold fared worse against the Dollar as market participants demanded U.S. treasuries and bidding up the Greenback.

Technical Analysis

EURUSD (4-Hour Chart)

The EUR/USD pair declined lower on Thursday, remaining under pressure and declined below 1.0900 level after the release of the United States Gross Domestic Product (GDP) data. The pair is now trading at 1.0866, posting a 0.34% loss on a daily basis. EUR/USD stays in the negative territory amid renewed US Dollar strength, as the greenback is volatile on Thursday following US economic reports and ahead of next week’s FOMC meeting. The US GDP report showed that the US economy expanded at an annualized rate of 2.9% in the fourth quarter, which came in slightly better than the market expectation for an expansion of 2.6% and strengthened the US Dollar that hit fresh daily highs across the board. In the Eurozone, the inflationary pressures are softening in Eurozone as supply chain bottlenecks are easing. But European Central Bank policymakers are still not satisfied with the scale of the interest rate and are reiterating more interest rate hikes ahead.

For technical aspect, RSI indicator 46 figures as of writing, suggesting that the pair could witnessed heavy bearish momentum as the RSI is falling sharply below the mid-line. As for the Bollinger Bands, the price declined sharply and dropped below the moving average, therefore the downside traction should persist. In conclusion, we think market will be bearish as the pair is now testing the 1.0861 support level. On the downside, the intraday sellers should seek entry below the aforementioned support level.

Resistance:  1.0918, 1.1032, 1.1131

Support: 1.0861, 1.0780, 1.0710

GBPUSD (4-Hour Chart)

The GBP/USD pair declined lower on Thursday, coming under bearish pressure and refreshed its daily low around 1.2350 mark after the release of the release of US economic data. At the time of writing, the cable stays in negative territory with a 0.18% loss for the day. The strong US growth data bolstered the US Dollar during the US trading session and acted as a headwind for the GBP/USD pair. At the same time, Durable Good Orders for December rose 5.6% MoM and Initial Jobless Claims for the week ending January 21 fell to 186K. Therefore, the odds for a smaller interest rate hike by the Federal Reserve are soaring and investors will look for clues about the future path from next week’s FOMC meeting. For the British pound, the dismal retail sales reported in the United Kingdom weighed heavily on the nation’s currency, as the data slumped over the last month at the fastest rate since April 2022.

For technical aspect, RSI indicator 52 figures as of writing, suggesting the bearish bias for the pair as the RSI is retreating from positive levels. As for the Bollinger Bands, the price preserved its downside momentum and dropped towards the moving average, therefore a continuation of the downside trend can be expected. In conclusion, we think market will be bearish as long as the 1.2426 resistance line holds. On the downside, a clear break of the 1.2341 hurdle becomes necessary for the GBP/USD sellers.

Resistance: 1.2426, 1.2493, 1.2593

Support: 1.2341, 1.2292, 1.2188

XAUUSD (4-Hour Chart)

Following the release of the Gross Domestic Product (GDP) preliminary reading in the United States on Thursday, the pair XAU/USD dropped sharply and retreated from a nine-month high above $1949 mark amid upbeat US economic data. XAU/USD is trading at 1926.44 at the time of writing, losing 1.03% on a daily basis. The US Dollar Index (DXY) is staging a comeback after being battered throughout the week and exerted bearish pressure to the dollar-denominated gold. Meanwhile, the recent release of downbeat US Retail Sales and PMI data has revived concerns over the health of the US economy, boosting expectations of smaller rate hikes from the US Federal Reserve in the upcoming policy meetings. As for now, the focus will shift to the US Core PCE Price Index due on Friday, which will play a key role in influencing the Fed’s rate-hike path.

For technical aspect, RSI indicator 46 figures as of writing, suggesting that the downside is more favored as the RSI stays below the mid-line. As for the Bollinger Bands, the price witnessed fresh selling and retreated towards the lower band, therefore the downside trend should persist. In conclusion, we think market will be bearish as the pair is heading to test the $1,922 support level. On the downside, if sellers extend their control below the abovementioned key support, an downside move toward the $1,898 level cannot be ruled out.

Resistance: 1947, 1957, 1963

Support: 1922, 1898, 1873

Economic Data

CurrencyDataTime (GMT + 8)Forecast
EURECB President Lagarde Speaks18:30 
USDCore PCE Price Index (MoM) (Dec)21:300.3%
USDPending Home Sales (MoM) (Dec)23:00-0.9%

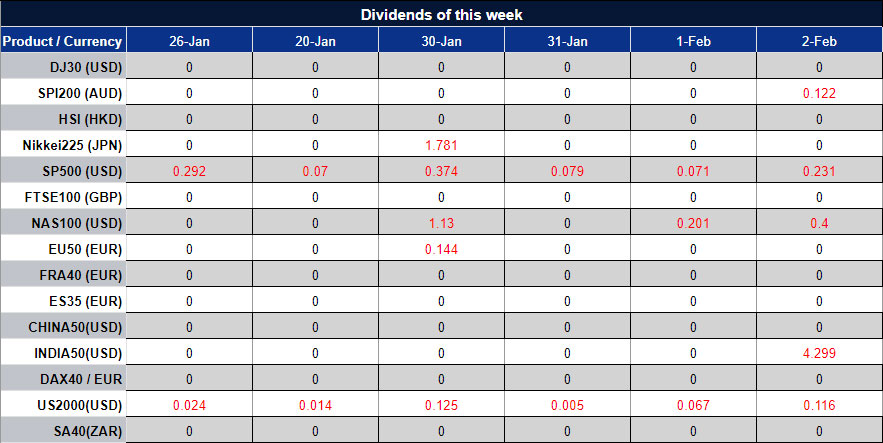
Weekly Dividend Adjustment Notice – January 26, 2023

Dear Client,

Warmly reminds you that the component stocks in the stock index spot generate dividends. When dividends are distributed, VT Markets will make dividends and deductions for the clients who hold the trading products after the close of the day before the ex-dividend date.

Indices dividends will not be paid/charged as an inclusion along with the swap component. It will be executed separately through a balance statement directly to your trading account, the comment for which will be in the following format “Div & Product Name & Net Volume ”.

Please note the specific adjustments as follows:

The above data is for reference only, please refer to the MT4/MT5 software for specific data.

If you’d like more information, please don’t hesitate to contact [email protected]

Market awaited US GDP and Jobless Claims data

U.S. equities closed mostly mixed throughout Wednesday’s trading. The Dow Jones Industrial Average gained 0.03% to close at 33743.84. The S&P 500 lost 0.02% to close at 4016.22. The tech-heavy Nasdaq Composite lost 0.18% to close at 11313.36. U.S. equities experienced a sharp drop at the beginning of Wednesday’s trading as Microsoft issued weaker guidance than expected; however, equities were able to strongly bounce back as market participants assessed corporate earnings and recessionary fears.

The benchmark 10-year treasury yield retreated slightly and was last seen trading at 3.451%. The short-term 2-year treasury yield gained slightly and was last seen trading at 4.133%.

EV maker Tesla reported earnings after the bell. The tech giant reported a beat on both earnings and revenues. Tesla reported revenue of $24.32 billion for the quarter, beating estimates of $24.16 billion. Despite cutting retail prices on its cars worldwide, Tesla has found abundant cash flow from its services business and continued government subsidies.

Main Pairs Movement

The Dollar index, which tracks the U.S. Greenback against a basket of major foreign currencies, dropped 0.27% throughout yesterday’s trading. The Dollar remains subdues ahead of the GDP and initial jobless claims figures, both scheduled to be released before the bell on Thursday. Market participants will also be tuning in on the U.S. PCE price index, scheduled for release on the 27th.

EURUSD continued to rise throughout Wednesday’s trading. The Euro advanced 0.27% against the Dollar. The Euro-Dollar pair has now entered its 6th straight winning session and now faces an immediate psychological resistance level of 1.1.

GBPUSD gained 0.51% throughout yesterday’s trading. The British Pound recovered most of its losses from Monday and Tuesday after the Dollar failed to attract bidding.

XAUUSD advanced 0.47% throughout Wednesday’s trading. Market participants’ concerns over growth and recession have opened the floodgates to the recent rally of Gold. The short-term interest rate expectation has allowed the Dollar to weaken and Gold to climb.

Technical Analysis

EURUSD (4-Hour Chart)

EUR/USD edged lower on Wednesday as cautious market sentiment helps the US dollar index hold its ground. At the time of writing, EUR/USD stays marginally below 1.0900, trading at 1.0867.  The US dollar index holds around 102. The IFO index from Germany on Wednesday showed that business sentiment improved modestly in January but failed to help the pair. The IFO index rose to 90.2, up from 88.6 in December, aligning with the forecast of 90.2. For more price action, eye on the release of the United States Gross Domestic Product (GDP) data and the Initial Jobless Claims on Thursday, which will directly influence the financial market.

For the technical aspect, RSI indicator 51 figures as of writing. The RSI indicator maintains neutral in the near term, signaling that the market is lack main traction. As for the Bolling  Bands, the price holds above the upward-moving average. The upward momentum seems weak as the pair trades in a narrow range in the near term. In conclusion, we think EUR/USD is in consolidation mode based on the technical analysis. The price is lack main traction. Market participants now await a key event on Thursday, which will act as a price catalyst, pushing the financial market. For the uptrend scenario, the pair need a breakthrough above the current resistance at 1.0912 to confirm the further uptrend. For the downtrend scenario, if the price drop below the support at 1.0780, it may lose its upward momentum and head to test the next support at 1.0710.

Resistance:  1.0912, 1.1048, 1.1131

Support: 1.0780, 1.0710, 1.0582

GBPUSD (4-Hour Chart)

GBP/USD trades in a narrow range around 1.2300 on Wednesday. In the absence of major macroeconomic data releases, the cautious market sentiment helps the US dollar index hold its ground and keeps the financial market non-volatile for now. On the other hand,  the various stimulus and energy payments have led to a record deficit in the UK but failed to solve the British workers’ problem, which sends more negative signals for GBP/USD. Market participants await the release of the US Gross Domestic Product (GDP) for the fourth quarter (Q4) and the Initial Jobless Claims on Thursday which will let market participants better understand the current market and trigger more price action.

For the technical aspect, RSI indicator 47 figures as of writing, still holding around the neutral region, signaling no main traction. As for the Bolling  Bands, the price trades between the moving average and lower band, suggesting that the is a lack of direction in the near term. In conclusion, we think GBP/USD may continue on consolidation until further breakthrough. For the uptrend scenario, the pair is establishing itself above the current support at 1.2273. It must not drop below the current support for any following upward movement. For the downtrend scenario, if the price drop below the support at 1.2273, it may stage more downward correction.

Resistance: 1.2430, 1.2600

Support: 1.2273,  1.2161, 1.2021

XAUUSD (4-Hour Chart)

Gold prices fell despite the weak US Dollar and falling US Treasury bond yields. Technical moves or near-term profit-taking could be the main reason. In the meantime, the US economic calendar would be busy on Thursday, led by US Gross Domestic Product (GDP) for the fourth quarter (Q4), expected at 2.6%. Further, Durable Good Orders are expected at 2.5%, compared to -2.1% of the previous. Initial Jobless Claims for the last week would also be updated, expected 205K, compared to 190K previous.

For the technical aspect, RSI indicator 51 figures as of writing, moving marginally around mid-line, signaling the lack of price movement. For the Bollinger Bands, the price is moving up and down between the upper band and the lower band, suggesting that the pair is lack traction. In conclusion, we think the market is in consolidation mode ahead of US key event on Thursday. The market needs a decisive breakthrough to confirm the following trend as  Gold price is trading between a narrow range. For the uptrend scenario, the next resistance is at $1,952. If the price breakthrough the resistance, it may head to test the next resistance at $1,977. For the downtrend scenario, if the price drop below $1,920, it may change its current trend and head to test the pivotal round figure mark at $1,900.

Resistance: 1952, 1977

Support: 1920, 1900, 1873

Economic Data

CurrencyDataTime (GMT + 8)Forecast
USDCore Durable Goods Orders (MoM) (Dec)21:30-0.2%
USDGDP (QoQ) (Q4)21:302.6%
USDInitial Jobless Claims21:30205K
USDNew Home Sales (Dec)23:00617K
Market awaited US GDP and Jobless Claims data

VT Markets Kicks Off 2023 with an Exciting Lineup of Innovative Products and Services

VT Markets, a next-generation multi-asset broker, has announced a brief roadmap of its plans for the year ahead. The broker has revealed an impressive lineup of strategies that aim to expand its market access, bolster its brand presence and improve clients’ trading efficiency.

An initiative clients are especially looking forward to is the exclusive 1:1000 leverage ratio for gold and forex products. Such an offer is unique only to VT Markets’ clients within the SEA region, and this will allow traders to have further control and flexibility over their investments. 

With the recent upgrade of the VT Markets App, traders can easily access 1000+ assets with high speed, transparency and fund safety. The new built-in features enable traders to monitor the financial markets on-the-go and in real-time, and execute trades with ease. The broker also has a strategic plan in place to partner with TradingView and Acuity to offer better services to its global clientele. By further tapping on innovative technologies, utilising advanced trading features and maintaining stringent safety protocols, VT Markets has all the necessary tools available to help traders maximise their profits while minimising risk. 

In order to bolster its brand presence, VT Markets has plans to revamp its websites and social media channels to maximise user experience. Apart from uplifting the brand’s image, such a move will also provide customers better access to stay informed about all things trading – from news to offerings, and promotions.

On a whole, the international broker has set its sights on further growth, by expanding its operations and achieving greater market penetration on a global scale. VT Markets is actively hiring personnel to ensure sufficient resources are available for all areas of operation throughout the different offices. 

VT Markets maintains an optimistic outlook for 2023, and are confident that its growth this year will surpass that of 2022. A representative of VT Markets said, “Despite the expected global recession in 2023, we are forecasting that our trading volume and the total number of traders will grow by at least 100%. With our bold strategies and expansion plans, we’re confident of maintaining our position at the forefront of the financial industry and setting the standard for others.”

About the Company:

VT Markets is a regulated multi-asset broker with a presence in over 160 countries. The broker has won many international accolades including Best Customer Service and Fastest Growing Broker. Its mission is to make trading an easy, accessible, and seamless experience for everyone.

Website: www.vtmarketsmy.com    

Microsoft shares increased after earnings exceeded expectations

U.S. equities struggled to maintain their recent rally throughout Tuesday’s trading. The Dow Jones Industrial Average gained 0.31% to close at 33733.96. The S&P 500 slipped 0.07% to close at 4016.95. The tech-heavy Nasdaq Composite lost 0.27% to close at 11334.27. The recent bear market rally has been aided by better-than-expected earnings results and signs of cooling inflation.

After the bell of the 24th, Microsoft Corp. released F2022 Q4 earnings. The software giant delivered better-than-expected earnings and shares rose 4% in late trading. Microsoft announced $2.32 earnings per share, while sales rose 2% over the quarter to $52.7 billion.  Microsoft’s Azure cloud computing proved resilience by gaining 38% in sales, beating estimates of a 37% growth. Recent developments of ChatGPT and OpenAI have injected excitement for the tech giant.

The benchmark U.S. 10-year treasury yield continued to drift lower and was last seen trading at around the 3.455% mark. The policy-sensitive short-term 2-year treasury yield currently sits at 4.148%.

Main Pairs Movement

The Dollar index, which tracks the U.S. Greenback against a basket of major foreign currencies, traded mostly sideways throughout Tuesday and lost 0.09% by the end of the day. The Dollar has been trading extremely range bound between the 101 to 103 level over the past week as market participants await crucial earnings results from major U.S. corporations.

EURUSD gained 0.13% throughout yesterday’s trading. The Euro continued to gain against the Dollar as the Dollar recedes around the 101 level. The EURUSD has notched its fifth consecutive winning session.

GBPUSD lost 0.32% throughout Tuesday’s trading. The British Pound traded lower against the Greenback as the U.K. PMI came in at 47, lower than the market consensus of 47.9. The lower British PMI sparked a weakening of the Sterling.

XAUUSD rose 0.31% throughout yesterday’s trading. The Dollar denominated Gold continues to gain as the Dollar weakens.

Technical Analysis

EURUSD (4-Hour Chart)

EUR/USD regains lost territory on the weak US dollar. Earlier, EUR/USD declined toward 1.0830 with the initial reaction to US PMI data. After the markets priced in the data, EUR/USD rebounded above 1.0870. The US Dollar struggles to maintain upside traction as Wall Street’s main indices recover from session lows.

For the technical aspect, RSI indicator 56 figures as of writing. The RSI indicator maintains neutral in the near term, signaling that the pair lose clear direction. As for the Bolling  Bands, the price is hovering around the moving average. Though the moving average is slightly upward, the upward momentum seems weak as the price edges lower. In conclusion, we think EUR/USD is in consolidation mode based on the technical analysis. The price is lack clear traction. A decisive breakthrough is needed to trigger the follow-through buy or sell interest. For the uptrend scenario, the pair is now trading slightly below the resistance at 1.0912. The price needs a breakthrough above the current resistance to meet the higher-high pattern of an uptrend. For the downtrend scenario, if the price drop below the support at 1.0780, it may lose its upward momentum and head to test the next support at 1.0710.

Resistance:  1.0912, 1.1048, 1.1131

Support: 1.0780, 1.0710, 1.0582

GBPUSD (4-Hour Chart)

GBP/USD fell on soft PMIs. Both the Services and Manufacturing PMIs came in below the 50 levels, indicating contraction. The Manufacturing PMI rose slightly to 46.7, up from 45.3 in November and above the forecast of 45.4 points. The Services PMI fell to 48.0, down from 49.9 in November and below the forecast of 49.6 points. On the other hand, the composite PMI fell to 47.8, down from 49.0 in November and below the forecast of 49.3 points. GBP/USD fell after PMIs released and kept going South in the early US session. After the US PMIs released, the US dollar went weak and therefore lifted GBP/USD. The pair regained some lost territory from the earlier trading session. At the time of writing, GBP/USD is trading at 1.2320.

For the technical aspect, RSI indicator 45 figures as of writing, sliding to a bearish region from the mid-line, suggesting that the downward correction could persist as the RSI indicator crossed below the mid-line. As for the Bolling  Bands, the price hovering around the lower band, signaling downside traction in the near term. In conclusion, we think GBP/USD may continue on correction based on the technical analysis. For the uptrend scenario, the pair has to establish itself above the current support at 1.2273 to regather upward strength. For the downtrend scenario, if the price drop below the support at 1.2273, it may trigger some follow-through selling and head to test the next support at 1.2161.

Resistance: 1.2430, 1.2600

Support: 1.2273,  1.2161, 1.2021

XAUUSD (4-Hour Chart)

Gold price touches a nine-month high on Tuesday amid renewed US Dollar selling. Bets for smaller FED rate hikes keep the US dollar index under pressure. The markets have been pricing in a modest 25 bps rate hike at the upcoming FOMC policy meeting next week. This resulted in a continued decline in the US Treasury bond yields and the US dollar index, which in turn benefit Gold bullish traders. On the other hand, recession fears also favor safe-haven Gold.

For the technical aspect, RSI indicator 63 figures as of writing, staying in a bullish region and rising from mid-line, suggesting that the uptrend should persist. For the Bollinger Bands, the price is moving up between the upper band and the upward average, which is a typical pattern for an uptrend. In conclusion, we think the market is in bullish mode as technical analysis shows bullish potential. For the uptrend scenario, the next resistance is at $1,952. If the price breakthrough the resistance, it may head to test the next resistance at $1,977. For the downtrend scenario, if the price drop below $1,920, it may change the current trend and head to test the pivotal round figure mark at $1,900.

Resistance: 1952, 1977

Support: 1920, 1900, 1873

Economic Data

CurrencyDataTime (GMT + 8)Forecast
AUDCPI (QoQ) (Q4)08:301.6%
EURGerman Ifo Business Climate Index (Jan)17:0090.2
CADBoC Monetary Policy Report23:00 
CADBoC Interest Rate Decision23:004.5%
USDCrude Oil Inventories23:300.971M
Back To Top
server

Hello there 👋

How can I help you?

Chat with our team instantly

Live Chat

Start a live conversation through...

  • Telegram
    hold On hold
  • Coming Soon...

Hello there 👋

How can I help you?

telegram

Scan the QR code with your smartphone to start a chat with us, or click here.

Don’t have the Telegram App or Desktop installed? Use Web Telegram instead.

QR code