Saham AS dibuka lebih rendah pada Khamis apabila risiko meningkat bahawa perang Iran akan memuncak, bukannya reda. Konflik kini memasuki minggu keempat, dan pasaran bertindak selepas Iran mengatakan tiada rundingan berlaku walaupun AS mendakwa sebaliknya.
Iran turut berkata ia tidak mengambil serius cadangan gencatan senjata “15 perkara” oleh pentadbiran. Pandangan pasaran sebelum ini ialah kesan ekonomi mungkin mencetuskan pembalikan dasar yang dikaitkan dengan frasa “TACO”.
Tekanan Tenaga Dan Kadar Faedah Meningkat
Minyak AS meningkat hampir 4% dan menghampiri $94 selepas susut di bawah $90 pada awal minggu. Hasil Perbendaharaan AS meningkat merentasi keluk daripada tempoh matang 12 bulan hingga 30 tahun.
Laporan menggambarkan pergerakan ribuan anggota tentera udara dan darat ke rantau itu, dengan perbincangan mengenai tindakan besar selepas pasaran ditutup pada Jumaat. Axios melaporkan perancangan untuk “pukulan terakhir”, termasuk lebih banyak pengeboman dan cubaan merampas pulau Kharg, Abu Musa dan Lakan berhampiran Selat Hormuz.
S&P 500 didagangkan turun 0.4% hingga 0.9% pada pagi Khamis, namun masih naik kira-kira 1% untuk minggu ini. Paras utama yang disebut ialah 6,550, dengan sokongan seterusnya pada 6,360 dan 6,200, manakala 7,000 digambarkan sebagai rintangan.
Indeks itu dikatakan berada di bawah purata bergerak mudah 200 hari. Fed memberi isyarat minggu lalu bahawa kadar faedah akan kekal tidak berubah untuk masa terdekat.
Mula berdagang sekarang – Klik di sini untuk membuat akaun sebenar VT Markets
AUD/USD didagangkan hampir 0.6920 pada Khamis, susut 0.35% pada hari tersebut, dan kekal hampir paras terendah bulanan dalam penyatuan menurun. Pasangan ini bergelut untuk pulih apabila Dolar AS kekal disokong.
Selera risiko kekal lemah selepas Iran menolak rundingan dan menepis cadangan gencatan senjata. Ketegangan berterusan di Timur Tengah dan penempatan tambahan tentera AS menyokong Dolar AS serta menekan Dolar Australia.
Risiko Timur Tengah Dan Sokongan Dolar
Kebimbangan terhadap bekalan tenaga menambah tekanan inflasi, dengan penutupan berkesan Selat Hormuz mengangkat harga minyak. Kenaikan minyak meningkatkan jangkaan bahawa bank pusat utama, termasuk Rizab Persekutuan, akan mengekalkan dasar yang cenderung hawkish, sekali gus menolak naik hasil Perbendaharaan AS.
Di Australia, kenyataan Penolong Gabenor RBA Christopher Kent tidak banyak mengangkat mata wang. Beliau merujuk kepada risiko inflasi akibat harga tenaga yang lebih tinggi dan keperluan mengekalkan dasar restriktif, namun reaksi pasaran adalah terhad.
Commerzbank melaporkan latar stagflasi, dengan merujuk kepada pertumbuhan yang lebih lemah, keyakinan pengguna menurun, dan PMI Perkhidmatan tergelincir ke zon penguncupan. Pasaran masih menilai kira-kira 54% kebarangkalian kenaikan kadar pada Mei.
Rabobank berkata kedudukan Australia sebagai pengeksport bersih tenaga boleh menyokong keadaan dagangan, dengan unjuran 0.71 dalam 3–6 bulan dan 0.72 dalam 12 bulan. Dalam tempoh terdekat, permintaan aset selamat, hasil AS yang lebih tinggi, dan kekurangan pemangkin domestik mengekalkan tekanan ke atas pasangan ini.
Peralihan Latar Makro
Apabila meninjau semula tempoh tersebut dari perspektif 2025, kita melihat bagaimana pandemik global mengubah naratif sepenuhnya dalam tempoh beberapa minggu selepas analisis ini ditulis. Pelonggaran dasar bank pusat yang diselaraskan secara besar-besaran selepas itu jauh mengatasi kebimbangan geopolitik ketika itu. Peralihan ini mendorong AUD/USD meningkat jauh melepasi paras 0.72 kemudian pada 2020 apabila selera risiko kembali.
Kini, pada penghujung Mac 2026, persekitaran ditentukan oleh pertumbuhan global yang semakin perlahan berbanding risiko geopolitik yang mendadak. Inflasi Australia telah reda kepada 3.2% dalam data suku tahunan terkini, membolehkan RBA mengekalkan pendirian dasar neutral. Angka terbaru menunjukkan kadar pengangguran meningkat kepada 4.3%, menjadikan bank pusat kurang alasan untuk mempertimbangkan kenaikan kadar.
Rizab Persekutuan AS berada dalam kedudukan yang serupa, dengan data terkini menunjukkan inflasi teras PCE tahunan pada 2.8%, jauh lebih hampir kepada sasarannya. Sehubungan itu, AUD/USD didagangkan dalam julat yang agak ketat sekitar 0.6650, paras yang sukar ditembusi selama berbulan-bulan. Kekurangan hala tuju yang jelas ini memerlukan strategi yang boleh mendapat manfaat daripada pergerakan mendatar.
Dalam persekitaran volatiliti rendah ini, pedagang boleh mempertimbangkan menjual opsyen untuk mengutip premium. Menjual iron condor AUD/USD dengan strike yang diletakkan di luar julat dagangan 0.65 hingga 0.68 kebelakangan ini boleh menjadi strategi berkesan untuk beberapa minggu akan datang. Pendekatan ini mendapat manfaat daripada susut nilai masa (time decay) dan pasangan kekal dalam julat.
Sebagai alternatif, bagi mereka yang sedikit cenderung menurun, bear call spread menawarkan cara risiko-terhad untuk bertaruh terhadap kenaikan yang ketara. Contohnya, seseorang boleh menjual call 0.6750 dan membeli call 0.6850 yang tamat tempoh pada penghujung April. Ini menguntungkan jika pasangan kekal di bawah harga strike jualan menjelang tarikh tamat tempoh.
Mula berdagang sekarang – Klik di sini untuk membuat akaun sebenar VT Markets
AUDUSD susut ke sekitar 0.687, menandakan paras terendah dua bulan.
Risiko inflasi meningkat, dengan CPI dilihat menghampiri 4.5% dan berpotensi 5% pada S2.
Pasaran menilai kebarangkalian 68% kenaikan kadar pada Mei, dengan kadar dijangka 4.75% menjelang akhir tahun.
Dolar Australia melemah ke sekitar $0.687, jatuh ke paras terendah dalam dua bulan apabila pasaran menilai semula risiko pertumbuhan global.
Pergerakan ini mencerminkan kebimbangan yang meningkat bahawa konflik berpanjangan di Timur Tengah boleh mencetuskan kejutan tenaga yang berterusan, sekali gus menekan mata wang berkait komoditi seperti Aussie.
Sebagai proksi kepada pertumbuhan global dan permintaan komoditi, AUDUSD lazimnya melemah apabila sentimen risiko merosot.
Aussie berkemungkinan kekal tertekan jika kebimbangan pertumbuhan semakin mendalam dan permintaan komoditi melemah.
Kelebihan Hasil Mengecil Apabila Pengetatan Global Meluas
Salah satu sokongan utama kepada dolar Australia, iaitu kadar faedah yang relatif lebih tinggi, mula pudar.
Pasaran kini menjangkakan bank pusat utama lain akan mengekalkan atau malah meningkatkan pengetatan, sekali gus mengecilkan kelebihan hasil Australia.
Peralihan ini mengurangkan insentif aliran modal masuk ke Aussie, khususnya ketika ketidaktentuan global meningkat.
Namun begitu, pasaran masih menilai kebarangkalian 68% kenaikan kadar pada Mei, dengan jangkaan kadar mencecah 4.75% menjelang akhir tahun.
Sokongan kadar mungkin menawarkan kenaikan yang terhad melainkan RBA bergerak lebih agresif berbanding rakan setara global.
Tekanan Inflasi Meningkat Apabila Kos Tenaga Melonjak
Kenaikan mendadak harga petrol memberi kesan langsung kepada prospek inflasi Australia.
Pakar ekonomi menjangkakan CPI utama meningkat ke arah 4.5%, dengan potensi menghampiri 5% pada S2 jika harga tenaga kekal tinggi.
Australian inflation remained elevated in February, even before the Iran war disrupted Middle East energy supplies and sent the cost of gasoline soaring, highlighting persistent price pressures in the economy. https://t.co/jBEU4ixjLg
Ini mewujudkan persekitaran yang sukar bagi penggubal dasar, kerana inflasi yang lebih tinggi mungkin memerlukan dasar yang lebih ketat, walaupun pertumbuhan semakin perlahan.
Gabungan kos yang meningkat dan penggunaan yang lebih lemah mula menekan perbelanjaan isi rumah.
RBA Berdepan Pertukaran Antara Pertumbuhan dan Inflasi
Reserve Bank of Australia (RBA) sedang mengemudi persekitaran dasar yang kompleks.
Penolong Gabenor RBA, Christopher Kent, memberi amaran bahawa konflik Teluk yang berpanjangan boleh menekan pertumbuhan ekonomi, walaupun bank pusat kekal fokus untuk menambat jangkaan inflasi.
The Middle East conflict and associated energy supply shock threaten to further fan inflation in Australia at a time when its economy is already grappling with capacity pressures, a senior Reserve Bank official said https://t.co/sMUTd5OmHD
Ini mencerminkan tema global yang lebih luas di mana bank pusat perlu mengimbangi kawalan inflasi dengan keadaan ekonomi yang semakin lemah.
RBA berkemungkinan kekal bergantung pada data, dengan keputusan dasar semakin dipengaruhi harga tenaga dan perkembangan global.
Analisis Teknikal
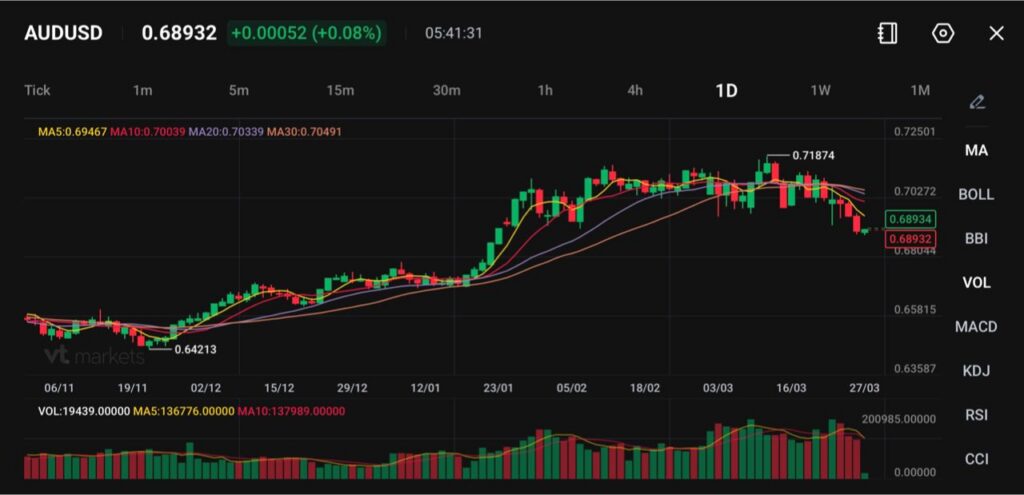
AUDUSD didagangkan sekitar 0.6893, meneruskan penarikan balik secara beransur selepas gagal bertahan di atas zon rintangan 0.71–0.7180. Struktur telah beralih daripada aliran menaik yang kukuh kepada fasa pembetulan, dengan tekanan menurun meningkat dalam jangka pendek.
Struktur Trend dan Purata Bergerak
Harga kini berada di bawah semua purata bergerak jangka pendek utama:
MA5: 0.6946
MA10: 0.7003
MA20: 0.7033
MA30: 0.7049
Penjajaran ini menunjukkan susunan menurun yang jelas, dengan semua MA condong ke bawah. Penolakan dari 0.7187 menandakan puncak setempat, diikuti oleh paras tinggi lebih rendah dan paras rendah lebih rendah yang konsisten.
Hakikat bahawa harga tidak mampu merampas semula walaupun MA5 menunjukkan penjual masih menguasai pasaran.
Paras Utama untuk Diperhatikan
Rintangan Terdekat: 0.6945 → 0.7000
Rintangan Lebih Kukuh: 0.7030 → 0.7050
Sokongan: 0.6850 → 0.6800
Paras Pecahan: Di bawah 0.6800 membuka ruang ke rantau 0.6700
Kawasan 0.6850 ialah sokongan utama pertama. Pecahan jelas di bawah paras ini akan mengesahkan kesinambungan pergerakan menurun.
Pemerhatian Tingkah Laku Harga
Rali daripada 0.6421 ke paras tinggi 0.7187 adalah kukuh dan dipacu trend. Namun, struktur terkini menunjukkan:
Penolakan berulang berhampiran paras tinggi
Penyatuan ketat bertukar menjadi pecahan
Susulan penurunan yang semakin meningkat
Ini tipikal bagi fasa pengagihan yang beralih kepada pembetulan.
Volum meningkat semasa penurunan baru-baru ini, menunjukkan minat jualan yang lebih aktif berbanding penyatuan terdahulu.
Apa yang Perlu Dipantau Seterusnya
Tumpukan pada bagaimana harga bertindak balas sekitar 0.6945 (zon MA5):
Gagal merampas semula: Mengekalkan tekanan penurunan
Tembus di atas 0.7000: Boleh mencetuskan short squeeze menuju 0.7030–0.7050
Selain itu, pantau pemacu makro:
Kekuatan USDX kekal menjadi halangan kepada AUD
Harga komoditi, khususnya bijih besi dan minyak, boleh mempengaruhi hala tuju AUD
Prospek Berhati-hati
Bias jangka pendek kekal menurun selagi di bawah 0.7000, dengan rali berkemungkinan dijual. Momentum hanya stabil jika harga mampu merampas semula zon 0.7030–0.7050. Sehingga itu, struktur memihak kepada susut ke arah 0.6850 dan berpotensi 0.6800.
Apa yang Pedagang Perlu Pantau Seterusnya
AUDUSD kekal sensitif kepada pemacu domestik dan global. Faktor utama termasuk:
Pergerakan harga minyak dan keadaan bekalan tenaga
Prospek pertumbuhan global dan sentimen risiko
Jangkaan dasar RBA dan data inflasi
Perbezaan hala tuju bank pusat merentas ekonomi utama
Buat masa ini, dolar Aussie lebih dipacu risiko global berbanding sokongan dasar domestik, dengan inflasi dipacu tenaga dan kebimbangan pertumbuhan membentuk hala tujunya dalam masa terdekat.
Soalan Lazim
Mengapa AUDUSD Jatuh ke Paras Terendah Dua Bulan?
AUDUSD susut ke sekitar 0.687 apabila kebimbangan pertumbuhan yang dipacu tenaga mengurangkan permintaan terhadap mata wang sensitif risiko seperti Aussie.
Bagaimana Kenaikan Harga Minyak Mempengaruhi Dolar Australia?
Harga minyak yang lebih tinggi meningkatkan inflasi dan menjejaskan pertumbuhan global, sekali gus melemahkan permintaan komoditi dan menekan Aussie.
Apa yang Mendorong Prospek Inflasi Australia Lebih Tinggi?
Kos petrol meningkat mendadak, dengan CPI dijangka mencecah 4.5% dan berkemungkinan 5% pada S2 jika harga tenaga kekal tinggi.
Mengapa Aussie Kehilangan Kelebihan Hasilnya?
Bank pusat lain dijangka mengetatkan dasar, sekali gus mengecilkan jurang kadar faedah yang sebelum ini menyokong AUDUSD.
Apa yang Dijangkakan Pasaran daripada RBA?
Pasaran menilai kebarangkalian 68% kenaikan kadar pada Mei, dengan kadar dijangka mencecah 4.75% menjelang akhir tahun.
Mula berdagang sekarang – Klik di sini untuk membuat akaun sebenar VT Markets
Data EIA AS menunjukkan pengeluaran simpanan gas asli sebanyak 54 bilion kaki padu bagi minggu berakhir 20 Mac. Unjuran sebelum ini menjangkakan pengeluaran sebanyak 49 bilion kaki padu.
Pengeluaran yang lebih besar daripada jangkaan, iaitu 54 bilion kaki padu daripada simpanan gas asli, merupakan isyarat menaik untuk jangka terdekat. Ia menunjukkan permintaan lebih kukuh daripada yang kami jangkakan bagi minggu berakhir 20 Mac. Pengetatan yang mengejutkan ini sepatutnya memberi sokongan segera kepada kontrak niaga hadapan bulan terdekat.
Tahap Inventori Dan Kesan Harga Jangka Terdekat
Namun begitu, kita perlu menilai perkara ini dalam konteks lebih luas iaitu tahap inventori semasa. Setakat laporan ini, jumlah gas bekerja dalam simpanan berada pada kira-kira 2,150 Bcf, yang masih melebihi 400 Bcf, atau sekitar 23%, berbanding purata lima tahun bagi tempoh ini. Lebihan yang ketara ini berkemungkinan mengehadkan sebarang kenaikan harga yang besar dalam beberapa minggu akan datang.
Melangkah ke hadapan, kami melihat pengeluaran akhirnya mula menurun, dengan kiraan pelantar terkini daripada Baker Hughes menunjukkan susut 5% sejak awal tahun. Pengunduran ini, digabungkan dengan permintaan yang kekal tinggi daripada kemudahan eksport LNG yang kini mencatat purata lebih 14.5 Bcf sehari, mewujudkan latar sokongan untuk harga pada separuh kedua tahun ini. Pasaran sedang menimbang lebihan inventori segera berbanding pengetatan pada masa hadapan.
Pemboleh ubah utama kekal pada cuaca ketika kita menghampiri penghujung musim pemanasan musim sejuk. Ramalan yang menunjukkan gelombang sejuk lewat musim pada awal April boleh mencetuskan satu lagi pengeluaran simpanan yang besar dan sekali lagi mengejutkan pasaran. Kami pernah melihat lonjakan harga ringkas dalam keadaan “shoulder season” yang serupa pada April 2025, mengingatkan betapa sensitifnya pasaran ini terhadap kejutan cuaca.
Memandangkan isyarat yang bercanggah ini, kami menjangkakan volatiliti meningkat. Pedagang wajar mempertimbangkan pembelian opsyen yang mendapat manfaat daripada pergerakan harga, seperti straddle pada kontrak Mei dan Jun, ketika pasaran menentukan sama ada simpanan yang tinggi atau pengeluaran yang menurun akan mendominasi hala tuju harga. Volatiliti tersirat masih munasabah, menawarkan titik masuk yang baik untuk posisi ini.
Spread Kalendar Untuk Pengetatan Hujung Tahun
Satu lagi strategi ialah meneliti spread kalendar bagi memanfaatkan prospek pengetatan bekalan pada hujung tahun. Kita boleh membina posisi dengan menjual kontrak Mei ’26 dan membeli kontrak Januari ’27. Dagangan ini mendapat manfaat jika pasaran memasukkan harga bagi keseimbangan bekalan-permintaan yang lebih ketat untuk musim sejuk akan datang, menyebabkan bahagian hujung (back end) lengkung niaga hadapan meningkat lebih daripada bahagian hadapan.
Mula berdagang sekarang – Klik di sini untuk membuat akaun sebenar VT Markets
Pasaran terus meletakkan harga bagi dua hingga tiga kenaikan kadar faedah Bank Pusat Eropah (ECB) pada 2026. Bagi April, penetapan harga masih membayangkan peluang 60% untuk kenaikan.
ECB sedang menimbang bagaimana untuk kekal berpandukan data yang masuk sambil pada masa yang sama mengemudi jangkaan kadar di seluruh keluk hasil. Pasaran telah bertindak balas terhadap usaha AS untuk mencapai perjanjian, namun penetapan harga bagi dua hingga tiga kenaikan masih kekal.
Harga Minyak Dan Tinjauan Inflasi
Harga minyak dianggap sebagai input utama bagi tinjauan inflasi jangka terdekat, dan ia hampir tidak berubah sejak awal minggu. Presiden Christine Lagarde berkata pada Rabu pagi bahawa ECB tidak akan bertindak sehingga mempunyai maklumat yang mencukupi, dan boleh mengetepikan kejutan harga yang bersifat sementara.
Penetapan harga pasaran membayangkan kemungkinan tindak balas ECB yang lebih tegas untuk menghentikan spiral harga. Swap inflasi hadapan bertempoh lebih panjang kekal relatif stabil, manakala niaga hadapan Euribor menunjukkan “bonggol” yang menandakan ada pembalikan kemudian.
ECB berdepan pertukaran antara mesejnya, kerana nada yang lebih dovish boleh menolak naik hasil pada hujung panjang sekiranya jangkaan inflasi meningkat. Nada yang lebih hawkish pula boleh mengalihkan perhatian kepada pertumbuhan yang lebih lemah.
Kami melihat pasaran yakin ECB akan melaksanakan sekurang-kurangnya dua kali kenaikan kadar tahun ini, dengan kebarangkalian kukuh 60% telah diambil kira bagi langkah seawal April. Dengan anggaran kilat terkini inflasi Zon Euro meningkat kepada 2.8%, didorong oleh tenaga, tekanan ke atas ECB semakin memuncak. Penetapan harga yang agresif ini mencadangkan pedagang perlu mengambil posisi untuk tindakan yang lebih hawkish.
Dagangan Keluk Euribor
Pemboleh ubah utama kekal harga minyak, yang mewujudkan dilema serius kepada bank pusat. Minyak mentah Brent degil bertahan di atas AS$92 setong, dan sebarang gangguan bekalan lanjut boleh memaksa ECB bertindak tegas bagi mengelakkan spiral harga. Ini berbeza dengan komen terbaru Presiden Lagarde tentang mengetepikan kejutan jangka pendek, mewujudkan ketidakpastian yang tepat untuk dimanfaatkan pedagang.
Persekitaran ini menyarankan strategi memainkan “bonggol” dalam jalur niaga hadapan Euribor, yang membayangkan pasaran menjangka kenaikan dalam masa terdekat tetapi pembalikan separa kemudian. Seseorang boleh mempertimbangkan untuk menjual (short) kontrak niaga hadapan jangka pendek bagi bertaruh pada kenaikan, sambil membeli kontrak bertempoh lebih panjang untuk mengambil posisi bagi pelonggaran pada masa depan. Kuncinya ialah berdagang peralihan yang dijangka pada keluk, bukan semata-mata arah keseluruhan.
Memandangkan imbangan ECB antara mengurus jangkaan inflasi dan mengelakkan kemelesetan, volatiliti adalah taruhan penting. Perbezaan antara apa yang pasaran letakkan harga dan apa yang ECB isyaratkan mewujudkan peluang untuk membeli volatiliti melalui opsyen. Strategi straddle pada niaga hadapan Bund Jerman menjelang mesyuarat April boleh menjadi menguntungkan jika bank itu memberikan kejutan ke mana-mana arah.
Swap inflasi jangka panjang kekal relatif stabil, menunjukkan keyakinan bahawa ECB mempunyai alat untuk mengurus inflasi, kredibiliti yang diperoleh semasa kitaran kenaikan agresif yang kita lihat berakhir pada 2025. Namun, kali ini berbeza, kerana data PMI terkini menunjukkan sektor pembuatan yang rapuh dan boleh terjejas oleh dasar yang terlalu agresif. ECB akhirnya mungkin terpaksa menaikkan kadar semata-mata untuk memenuhi jangkaan pasaran dan membeli lebih banyak masa untuk dirinya.
Mula berdagang sekarang – Klik di sini untuk membuat akaun sebenar VT Markets
Presiden Bundesbank Joachim Nagel berkata Bank Pusat Eropah (ECB) boleh menaikkan kadar faedah seawal April jika harga tenaga yang lebih tinggi meningkatkan risiko inflasi. Beliau mengaitkan risiko itu dengan kenaikan harga minyak dan gas serta gangguan yang berkait dengan penutupan Selat Hormuz.
Nagel berkata penggubal dasar akan mempunyai maklumat yang mencukupi menjelang mesyuarat ECB pada 29–30 April untuk memutuskan sama ada untuk mengetatkan dasar atau menunggu. Beliau berkata, pengetatan lanjut tidak sepatutnya diketepikan terlalu awal.
Isyarat Bekalan Wang Zon Euro
Data monetari zon euro menunjukkan momentum yang lebih lemah pada Februari. Pertumbuhan M3 perlahan kepada 3.0% tahun ke tahun daripada 3.2%, manakala pertumbuhan M1 mereda kepada 4.8% daripada 5.2%.
Data ini menunjukkan keadaan kecairan yang lebih sederhana seiring pertumbuhan kredit yang stabil namun kekal lembap di seluruh zon euro. Kesan konflik Timur Tengah terhadap tingkah laku kredit masih belum jelas.
Euro kini tersepit antara dua kuasa yang bertentangan, mewujudkan ketidaktentuan untuk beberapa minggu akan datang. Kita melihat nada hawkish daripada bank pusat yang bimbang tentang harga tenaga Timur Tengah, sementara data ekonomi penting menunjukkan momentum monetari yang semakin perlahan. Pertembungan antara kata-kata dan angka ini mencadangkan tempoh turun naik yang lebih tinggi bagi mata wang tersebut.
Dagangan Untuk Volatiliti
Bagi pedagang derivatif, persekitaran ini merupakan isyarat klasik untuk mempertimbangkan strategi yang meraih manfaat daripada pergerakan harga, tanpa mengira arah. Membeli volatiliti pada Euro boleh menjadi pendekatan yang berhemah, kerana pasaran boleh bertindak balas dengan ketara sama ada kepada kenaikan kadar yang tidak dijangka atau pengesahan kelemahan ekonomi. Kuncinya ialah berada dalam posisi untuk pergerakan yang tegas, bukannya bertaruh pada hasil tertentu.
Pandangan ini disokong oleh angka inflasi terkini awal bulan ini, yang menunjukkan inflasi utama meningkat kepada 2.8% akibat kos tenaga, manakala inflasi teras sebenarnya mereda kepada 2.5%. Data bercampur ini memberi “peluru” kepada kedua-dua kumpulan hawks dan doves di ECB, menambah keraguan pasaran. Ketidaktentuan ini menjadikan strategi opsyen seperti straddle, yang bertaruh pada pergerakan harga besar, lebih relevan.
Risiko geopolitik bukan sekadar teori; kita melihat niaga hadapan minyak mentah Brent melonjak minggu lalu selepas sebuah kapal tangki ditahan seketika berhampiran Selat Hormuz. Peristiwa masa nyata ini menguatkan amaran Presiden Bundesbank Nagel mengenai potensi kenaikan kadar pada April untuk mengekang inflasi dipacu tenaga. Ini menjadikan senario hawkish sebagai ancaman nyata yang perlu diambil kira dalam penetapan harga pasaran.
Melihat kepada pasaran kadar faedah, niaga hadapan kini hanya mencerminkan kira-kira 35% kebarangkalian kenaikan 25 mata asas pada mesyuarat April. Penetapan harga ini menawarkan peluang yang jelas untuk pedagang membuat pertaruhan berdasarkan penilaian mereka terhadap situasi. Seseorang boleh berdagang niaga hadapan EURIBOR untuk membuat spekulasi sama ada pasaran meremehkan atau melebihkan peluang ECB bertindak bulan depan.
Mula berdagang sekarang – Klik di sini untuk membuat akaun sebenar VT Markets
Indeks Dolar AS (DXY) kekal kukuh pada Khamis, diniagakan hampir 99.75 dan meningkat untuk hari ketiga. Sokongan datang apabila ketegangan berkaitan perang AS-Israel dengan Iran berterusan.
Ketidaktentuan mengenai rundingan AS-Iran berlanjutan selepas Iran menolak pelan 15 perkara yang dicadangkan Washington, menurut Press TV. Iran menetapkan syarat termasuk penghentian permusuhan, jaminan terhadap konflik berulang, pampasan perang, gencatan senjata yang lebih luas, dan pengiktirafan autoritinya ke atas Selat Hormuz.
Kekuatan Dolar Dan Ketegangan Geopolitik
Pegawai AS berkata perbincangan dengan perunding Iran masih berlangsung, manakala pegawai Iran menafikan sebarang rundingan sedang diadakan. Laporan mengenai penempatan ketenteraan AS selanjutnya mengekalkan kebimbangan terhadap konflik yang lebih berpanjangan.
Axios melaporkan pegawai AS sedang menilai pilihan ketenteraan yang menyasarkan kedudukan Iran. Lokasi yang disebut termasuk Pulau Kharg, hab eksport minyak utama Iran, serta kawasan sekitar Selat Hormuz seperti Pulau Larak dan Abu Musa.
Harga minyak yang lebih tinggi meningkatkan kebimbangan inflasi dan mengurangkan jangkaan pemotongan kadar oleh Rizab Persekutuan, sekali gus menolak naik hasil Perbendaharaan AS. Pasaran kini menjangka kadar kekal tidak berubah hingga 2026, berbanding jangkaan terdahulu untuk sekurang-kurangnya dua pemotongan.
Tinjauan Reuters mendapati 61 daripada 82 ahli ekonomi menjangka tiada perubahan kadar pada suku tahun akan datang. Bagi akhir 2026, 28 menjangka satu pemotongan dan 37 menjangka dua pemotongan.
Unjuran Kadar Dan Kedudukan Pasaran
Tuntutan Awal Pengangguran AS adalah 210K berbanding 205K sebelum ini, dengan purata empat minggu pada 210.5K berbanding 210.75K.
Mula berdagang sekarang – Klik di sini untuk membuat akaun sebenar VT Markets
TD Securities berkata Penasihat Dagangan Komoditi (CTA) berkemungkinan menjual emas melainkan harga melantun semula dengan kukuh pada minggu hadapan. Firma itu berkata kenaikan harga yang besar diperlukan untuk menghentikan algoritma daripada menjual sebahagian besar baki posisi panjang.
Nota itu berkata emas kini didagangkan lebih seperti aset berisiko, dikaitkan dengan aliran kepelbagaian dolar AS. Ia turut mengaitkan pergerakan itu dengan tekanan berkaitan perang ke atas lebihan sektor rasmi.
Permintaan Sektor Rasmi Melemah
Ia berkata perang di Timur Tengah telah menjejaskan ekonomi Teluk dan mengurangkan lebihan di Asia Timur, sekali gus menjejaskan permintaan sektor rasmi buat masa ini. Ia menambah penyertaan institusi yang meluas kini menjadi lebih terdedah, dengan bilangan pembeli yang semakin berkurangan ketika jualan besar-besaran.
TD Securities berkata sebahagian peserta pasaran menyalahkan kejatuhan harga berpunca daripada pengurangan leveraj, namun anggarannya menunjukkan leveraj dana kuantitatif tidak berubah sejak Hari ke-2 perang itu. Ini, menurutnya, menunjukkan struktur pasaran yang semakin lemah.
Ia berkata pelupusan paksa (liquidation) adalah besar, tetapi pasaran masih jauh daripada capitulation. Ia mencadangkan supaya menunggu capitulation posisi panjang CTA sebelum membeli ketika harga susut, dan menyatakan kemungkinan penguraian lanjut “dagangan debasement”, termasuk keputusan Mahkamah Agung yang dikaitkan dengan perbicaraan Lisa Cook.
Penasihat Dagangan Komoditi (CTA) berkemungkinan mula menjual pegangan emas mereka dalam kebanyakan senario pasaran. Satu rali harga yang ketara diperlukan dalam minggu hadapan untuk menghalang dana sistematik ini daripada melupuskan sebahagian besar posisi panjang mereka. Ini menunjukkan bahawa tanpa belian yang kukuh, pasaran berada dalam kedudukan untuk bergerak lebih rendah.
Pemangkin Berpotensi Di Hadapan
Emas kini berkelakuan lebih seperti aset berisiko berbanding aset lindung nilai selamat tradisional. Kami melihat korelasinya dengan pasaran ekuiti meningkat sejak konflik Timur Tengah 2025, yang menjejaskan ekonomi negara pengeluar komoditi utama. Ini mengganggu aliran kepelbagaian dolar AS yang lazimnya menyokong emas ketika tempoh tidak menentu.
Sumber permintaan utama juga melemah buat sementara waktu. Kesan ekonomi daripada perang tahun lalu telah mengurangkan dengan ketara lebihan dagangan pembeli utama bank pusat di Teluk dan Asia Timur. Melihat ke belakang, kami menyaksikan pembelian sektor rasmi merosot mendadak pada akhir 2025 daripada kadar rekod pada 2023 dan 2024, sekali gus menyebabkan pelabur institusi terdedah tanpa sokongan penting tersebut.
Skala pelupusan paksa adalah besar, namun kita masih jauh daripada kejadian capitulation penuh. Bagi pedagang derivatif, ini bermakna membeli ketika susut ini adalah pramatang sehingga kita melihat “washout” daripada kelompok CTA. Perhatikan lonjakan mendadak dalam volum jualan sebagai petanda bahawa baki posisi panjang pengikut trend ini telah dipaksa keluar.
Peristiwa akan datang juga boleh mencetuskan penguraian lanjut “dagangan debasement” berasaskan ketakutan. Keputusan Mahkamah Agung yang masih tertangguh mengenai isu Lisa Cook sedang mewujudkan ketidaktentuan terhadap hala tuju dasar monetari. Ini merupakan pemangkin utama yang boleh mendorong lebih banyak jualan jika keputusan itu dilihat mengurangkan risiko kewangan jangka panjang.
Mula berdagang sekarang – Klik di sini untuk membuat akaun sebenar VT Markets
HSBC Global Research menjangkakan dolar New Zealand (NZD) kekal berada di bawah tekanan berbanding dolar AS (USD) dalam minggu-minggu akan datang. Pasaran masih mengambil kira pengetatan lanjut oleh Reserve Bank of New Zealand (RBNZ) sepanjang 12 bulan akan datang.
RBNZ dijadual bermesyuarat pada 8 April, dengan kadar dasar dijangka kekal pada 2.25% (Bloomberg, 25 Mac 2026). Harga minyak dan gas yang lebih tinggi, dikaitkan dengan konflik di Timur Tengah, telah menaikkan hasil (yields) tempatan dan menambah kepada unjuran kenaikan kadar.
Tinjauan Jangka Terdekat NZD/USD
Kadar faedah New Zealand telah meningkat berbanding kadar Australia, yang menyokong pengukuhan NZD berbanding dolar Australia (AUD). Namun begitu, NZD/USD dijangka kekal lemah melainkan RBNZ memberi keputusan yang lebih hawkish daripada jangkaan pasaran.
Dolar New Zealand berkemungkinan kekal lemah berbanding dolar AS dalam beberapa minggu akan datang. Kami melihat NZD/USD susut ke sekitar 0.6150 bulan ini, sebahagian besarnya kerana data AS terkini—seperti laporan pekerjaan bukan perladangan (non-farm payrolls) minggu lalu yang menambah 250,000 pekerjaan—menyokong pengukuhan dolar AS. Trend ini dijangka berterusan menjelang mesyuarat RBNZ.
Walaupun pasaran menjangkakan lebih banyak kenaikan kadar RBNZ sepanjang tahun akan datang, perkara ini sudah pun dicerminkan dalam harga. Dengan minyak mentah Brent kekal kukuh sekitar AS$95 setong dan data inflasi kami bagi S4 2025 masih degil pada 3.8%, hala tuju pengetatan seterusnya bukan lagi rahsia. Oleh itu, mesyuarat 8 April yang dijangka mengekalkan kadar pada 2.25% berkemungkinan tidak menawarkan sokongan baharu.
Bagi kami, ini mencadangkan strategi membeli opsyen put NZD/USD dengan tarikh luput selepas mesyuarat April untuk memposisikan bagi penurunan lanjut. Memandangkan pasaran sudah pun mengambil kira langkah RBNZ yang berkemungkinan, volatiliti tersirat bagi opsyen ini mungkin terlebih anggar. Menjual volatiliti melalui strategi seperti short strangles boleh menguntungkan jika RBNZ menyampaikan keputusan mendatar seperti dijangka.
Nilai Relatif Berbanding Dolar Australia
Kami melihat susunan yang serupa pada 2024 apabila RBNZ mengekalkan pendirian hawkish tetapi kebimbangan pertumbuhan global mengekang pengukuhan kiwi. Tumpuan pasaran mudah kekal pada tema lebih luas seperti dasar kadar faedah AS atau sentimen risiko, bukannya semata-mata jangkaan kadar tempatan. Corak sejarah ini menyokong pandangan bahawa NZD boleh melemah walaupun bank pusat kita berucap tegas.
Sebaliknya, kiwi kelihatan jauh lebih kukuh berbanding dolar Australia. Kenaikan kadar swap dua tahun New Zealand telah mengatasi Australia, sekali gus melebarkan perbezaan hasil memihak kepada New Zealand. Ini menjadikan posisi long NZD/AUD—mungkin menggunakan kontrak hadapan—sebagai dagangan berpasangan (pair trade) yang menarik untuk mengasingkan kelebihan kadar relatif New Zealand.
Mula berdagang sekarang – Klik di sini untuk membuat akaun sebenar VT Markets
Bank pusat Afrika Selatan, South African Reserve Bank (SARB), mengekalkan kadar faedah utamanya tidak berubah pada 6.75%. Keputusan ini selaras dengan jangkaan.
Keputusan itu mengekalkan kos pinjaman stabil bagi isi rumah dan perniagaan. Ia juga mengekalkan tetapan dasar tidak berubah bagi tempoh akan datang.
Reaksi Pasaran Dan Tinjauan Volatiliti
Dengan South African Reserve Bank mengekalkan kadar seperti dijangka pada 6.75%, elemen kejutan buat masa ini telah tiada. Kami melihat keputusan ini akan menyebabkan penurunan volatiliti tersirat bagi pasangan mata wang USD/ZAR dalam jangka pendek. Ini menjadikan strategi seperti menjual opsyen lebih menarik memandangkan pasaran telah pun mengambil kira kestabilan ini.
Rand dijangka mendapat sokongan sekitar paras semasa, memandangkan kadar faedah tinggi terus menarik pedagang carry. Namun, tumpuan pasaran kini akan beralih sepenuhnya kepada bila pemotongan kadar pertama mungkin berlaku lewat tahun ini. Dengan bacaan inflasi Februari 2026 masih kukuh pada 5.8%, kami percaya pemotongan sebelum suku ketiga adalah tidak mungkin.
Bagi mereka yang berdagang swap kadar faedah, keluk hadapan berkemungkinan melebih-lebihkan kelajuan pemotongan kadar pada masa hadapan. Kami mengambil posisi untuk keluk hasil yang lebih mendatar dalam beberapa bulan akan datang, apabila kadar jangka pendek kekal berjangkar oleh pendirian berhati-hati SARB. Melihat kembali 2025, kami menyaksikan beberapa “false start” apabila pasaran menilai pemotongan yang terlalu awal, sebelum berakhir dengan kekecewaan.
Dari sudut ekuiti, Indeks JSE All-Share mungkin menyaksikan rali lega selepas keputusan ini selesai. Walaupun kadar tinggi yang berterusan menjadi halangan kepada pertumbuhan, seperti dibuktikan oleh angka KDNK 0.9% yang lembap pada lewat 2025, ia menguntungkan margin faedah bersih saham perbankan. Kami menjangkakan prestasi kewangan mengatasi sektor sensitif kadar seperti runcit atau hartanah.
Ekuiti Dan Penentududukan Sektor
Mula berdagang sekarang – Klik di sini untuk membuat akaun sebenar VT Markets