Tuntutan awal AS bagi insurans pengangguran meningkat kepada 210K pada minggu berakhir 21 Mac, menurut laporan Jabatan Buruh AS yang dikeluarkan pada Khamis. Angka itu sepadan dengan anggaran dan naik daripada 205K pada minggu sebelumnya, yang tidak disemak semula.
Purata bergerak empat minggu susut 0.25K kepada 210.5K daripada 210.75K, dengan bacaan terdahulu tidak disemak semula. Tuntutan pengangguran berterusan turun 32K kepada 1.819 juta bagi minggu berakhir 14 Mac.
Kekuatan Dolar Di Tengah Ketegangan Geopolitik
Pada Khamis, Indeks Dolar AS (DXY) meningkat ke paras tertinggi tiga hari berhampiran 100.00 apabila dolar AS meneruskan pemulihan mingguan. Pergerakan itu berlaku ketika ketegangan geopolitik berterusan.
Laporan itu diperbetulkan pada 26 Mac pada 13:04 GMT untuk menyatakan bahawa data tuntutan berterusan merangkumi minggu berakhir 14 Mac, bukannya 7 Mac.
Melihat kembali pada tempoh ini pada 2025, kita menyaksikan pasaran buruh yang stabil, dengan tuntutan awal pengangguran kekal sekitar 210K. Data tersebut tidak banyak mengubah naratif, namun ia menyokong pengukuhan dolar di tengah tekanan geopolitik. Tempoh ini menetapkan penanda aras tentang rupa ekonomi AS yang berdaya tahan, tetapi tidak terlalu panas.
Hari ini, situasinya telah berubah, apabila tuntutan awal bagi minggu lalu dicatat sedikit lebih tinggi pada 218K, dengan purata empat minggu kini sekitar 215K. Kenaikan perlahan sepanjang setahun lalu ini menunjukkan pasaran buruh mula melembut di pinggir. Tuntutan berterusan juga meningkat kepada 1.905 juta, mencerminkan tempoh carian pekerjaan baharu yang lebih lama bagi mereka yang diberhentikan.
Implikasi Dagangan Dan Kedudukan Pasaran
Indeks Dolar AS, yang menguji paras 100 setahun lalu, telah menunjukkan kekuatan yang berterusan dan kini didagangkan sekitar 104. Kekuatan berpanjangan ini, didorong oleh ketidaktentuan global yang berterusan, terus mengetatkan keadaan kewangan di peringkat global. Ini merupakan faktor kritikal yang pada awal 2025 hanyalah trend yang baru mula terbentuk.
Dalam konteks ini, pedagang wajar mempertimbangkan kedudukan untuk menghadapi turun naik yang meningkat dalam pasaran ekuiti. Membeli opsyen panggilan VIX atau mewujudkan kolar sebaran put pada indeks utama seperti S&P 500 boleh menawarkan lindung nilai yang kos efektif. Ini melindungi daripada potensi kemerosotan pasaran jika data buruh terus merosot lebih cepat daripada jangkaan.
Dalam pasaran kadar faedah, tumpuan perlu diberikan kepada masa perubahan dasar Rizab Persekutuan. Data semasa menunjukkan ekonomi yang kurang teguh berbanding setahun lalu, menjadikan pemotongan kadar pada masa hadapan lebih berkemungkinan. Pedagang boleh meneliti niaga hadapan SOFR, khususnya bagi penghujung tahun, untuk membuat kedudukan menjelang peralihan yang lebih dovish daripada bank pusat.
Mula berdagang sekarang – Klik di sini untuk membuat akaun sebenar VT Markets
Tuntutan pengangguran berterusan AS bagi minggu berakhir 13 Mac mencatat 1.819 juta. Ini lebih rendah daripada unjuran 1.86 juta.
Keputusan ini menunjukkan lebih sedikit individu kekal menerima faedah pengangguran berbanding jangkaan. Jurang antara unjuran dan angka sebenar ialah 0.041 juta (41,000).
Kekuatan Pasaran Buruh
Data terkini tuntutan pengangguran berterusan, pada 1.819 juta, menunjukkan pasaran buruh lebih “panas” daripada jangkaan kami. Ketahanan ini menandakan ekonomi asas kekal kukuh, sekali gus mencabar naratif mengenai kelembapan yang bakal berlaku dalam masa terdekat. Kekuatan di luar jangkaan ini bermakna kita perlu menilai semula andaian terhadap hala tuju Rizab Persekutuan (Fed) selepas ini.
Pasaran buruh yang ketat meningkatkan kebimbangan terhadap inflasi gaji, yang boleh memaksa Fed menangguhkan sebarang rancangan pemotongan kadar faedah. Kita melihat kebarangkalian pemotongan kadar pada Jun, seperti dijejak oleh niaga hadapan CME, susut daripada melebihi 70% kepada sekitar 55% selepas data ini diterbitkan. Peralihan jangkaan ini adalah faktor paling kritikal bagi penetapan harga derivatif dalam beberapa minggu akan datang.
Kita perlu berhati-hati kerana situasi ini terasa mirip kepada sentimen pasaran pada musim bunga 2025. Ketika itu, siri laporan ekonomi yang kukuh turut menolak ke belakang garis masa pemotongan kadar, mendorong lonjakan hasil bon dan jualan besar dalam ekuiti berorientasikan pertumbuhan. Pengajaran sejarah menunjukkan kita wajar bersedia menghadapi turun naik yang lebih ketara apabila pasaran menghadam realiti baharu ini.
Ketidakpastian ini bermakna kita patut menjangkakan volatiliti lebih tinggi, khususnya menjelang penerbitan data inflasi seterusnya dan mesyuarat Fed. VIX, yang sebelum ini cenderung berada di bawah 14, berkemungkinan mendapat sokongan dan boleh menguji julat 17-18 apabila pedagang membeli perlindungan. Pertimbangkan untuk membeli straddle atau strangle pada indeks utama bagi memanfaatkan jangkaan peningkatan ayunan harga.
Bagi posisi tertentu, prospek untuk sektor sensitif kadar seperti teknologi dan hartanah menjadi lebih mencabar. Kita boleh mempertimbangkan pembelian put atau membentuk bear call spread pada ETF berfokuskan teknologi. Sebaliknya, asas pengguna yang kukuh baik untuk saham penggunaan budi bicara, menjadikan bull put spread pada kaunter runcit dan perjalanan lebih menarik.
Fokus Pada CPI
Laporan Indeks Harga Pengguna (CPI) yang akan datang kini lebih penting dalam menentukan hala tuju pasaran. Bacaan inflasi yang sekali lagi tinggi akan mengesahkan keperluan Fed untuk kekal hawkish, dan berkemungkinan menekan pasaran dengan lebih lanjut. Kita perlu membuat posisi bagi acara binari ini, kerana ia sama ada akan mengesahkan kebimbangan baharu pasaran atau memberikan kelegaan yang ketara.
Mula berdagang sekarang – Klik di sini untuk membuat akaun sebenar VT Markets
Purata bergerak empat minggu bagi tuntutan awal faedah pengangguran di Amerika Syarikat ialah 210.5K setakat 20 Mac. Purata empat minggu sebelumnya ialah 210.75K.
Ini merupakan penurunan 0.25K berbanding angka terdahulu. Titik data terkini mencerminkan perubahan kecil dalam trend kebelakangan ini.
Ketahanan Pasaran Buruh
Data tuntutan pengangguran yang stabil mengukuhkan pandangan kami bahawa pasaran buruh kekal berdaya tahan. Kekuatan yang konsisten ini menunjukkan Rizab Persekutuan (Fed) tidak akan berasa tertekan untuk menurunkan kadar faedah dalam masa terdekat. Oleh itu, kita wajar melaraskan jangkaan terhadap pivot dovish, dengan menolak garis masa bagi sebarang potongan kadar yang berpotensi ke tempoh yang lebih lewat.
Dengan Fed berkemungkinan kekal tidak berubah, kami menjangkakan tekanan berterusan terhadap derivatif kadar faedah jangka pendek yang telah memprice-in potongan agresif untuk musim panas. Data inflasi terkini, yang menunjukkan PCE teras bagi Februari 2026 kekal pada 2.8%, menyokong pendirian berhati-hati ini daripada pembuat dasar. Persekitaran ini mencadangkan strategi memudar (fade) kenaikan dalam kontrak niaga hadapan yang berkait dengan kadar SOFR.
Kestabilan ini mengekalkan volatiliti pasaran rendah, dengan indeks VIX kini diniagakan sekitar 13.5. Ini menjadikan penjualan premium opsyen sebagai strategi yang menarik, memandangkan ekonomi yang kukuh menyediakan penampan kepada pasaran ekuiti. Kami melihat peluang dalam menulis covered call pada saham teknologi berprestasi baik atau menjual cash-secured put pada ETF pasaran luas seperti SPY.
Melihat ke belakang, persekitaran yang stabil ini merupakan kontras yang ketara berbanding kegelisahan pasaran yang kita lihat pada musim luruh 2025 apabila kebimbangan kemelesetan lebih meluas. Namun, volatiliti rendah semasa tidak seharusnya membawa kepada rasa selesa. Kekal berhemah untuk memegang sebahagian put perlindungan jangka panjang yang murah pada indeks utama sebagai lindung nilai terhadap sebarang kejutan geopolitik atau ekonomi yang tidak dijangka.
Penentududukan Merentas Kadar Dan Ekuiti
Angka pekerjaan yang kukuh menandakan kuasa perbelanjaan pengguna yang berterusan, yang memberi manfaat kepada sektor kitaran. Kita boleh mempertimbangkan strategi opsyen bullish pada ETF barangan pengguna budi bicara seperti XLY. Ini boleh dipadankan dengan posisi bearish pada sektor sensitif kadar faedah seperti utiliti, yang cenderung berprestasi lemah apabila prospek potongan kadar semakin pudar.
Mula berdagang sekarang – Klik di sini untuk membuat akaun sebenar VT Markets
Tuntutan awal faedah pengangguran AS berjumlah 210,000 bagi minggu berakhir 20 Mac, sejajar dengan ramalan.
Data tersebut menunjukkan tiada penyimpangan daripada jangkaan bagi tempoh yang diliputi.
Latar Belakang Pasaran Buruh Yang Stabil
Melihat ke belakang, tuntutan awal pengangguran sebanyak 210,000 bagi 20 Mac 2025 mencerminkan pasaran buruh yang stabil dan mudah dijangka. Kestabilan itu mengekang volatiliti pasaran, sekali gus memberi ganjaran kepada pertaruhan arah yang ringkas. Namun, persekitaran yang kita hadapi hari ini jauh berbeza.
Kini kita melihat tanda-tanda pasaran pekerjaan yang semakin menyejuk, dengan tuntutan mingguan sejak kebelakangan ini cenderung meningkat menghampiri 230,000. Ini berbeza dengan kekuatan yang kita lihat tahun lalu dan menambah ketidaktentuan terhadap hala tuju ekonomi. Langkah seterusnya Rizab Persekutuan kini kurang jelas berbanding setahun lalu.
Ketidaktentuan ini diburukkan lagi oleh data inflasi yang kekal degil melebihi sasaran bank pusat, dengan bacaan terakhir Indeks Harga Pengguna (CPI) pada 3.1%. Ini meletakkan Fed dalam kedudukan sukar untuk mengimbangi pasaran buruh yang melemah dengan inflasi yang berterusan. Pertembungan ini menjadi punca langsung volatiliti pasaran.
Akibatnya, volatiliti tersirat dalam pasaran opsyen meningkat, dengan VIX kini berlegar sekitar 18, jauh lebih tinggi berbanding paras yang lebih tenang pada awal 2025. Ini bermakna premium opsyen lebih mahal, mencerminkan potensi ayunan pasaran yang lebih besar. Strategi yang sekadar bertaruh pada arah kini lebih berisiko.
Penentududukan Untuk Volatiliti Lebih Tinggi
Oleh itu, pedagang wajar mempertimbangkan strategi yang mendapat manfaat daripada peningkatan volatiliti ini. Membeli straddle atau strangle pada indeks menjelang mesyuarat FOMC seterusnya atau data inflasi utama boleh menjadi berkesan, kerana ia memperoleh keuntungan daripada pergerakan ketara ke mana-mana arah. Pendekatan ini membolehkan kita memanfaatkan ketidaktentuan itu sendiri, bukannya meneka keputusan.
Dalam minggu-minggu akan datang, kami akan memantau rapi sebarang penyimpangan dalam angka pekerjaan dan inflasi. Menggunakan opsyen untuk melindung nilai portfolio ekuiti sedia ada dengan put perlindungan juga merupakan langkah berhemah. Persekitaran yang mudah dijangka seperti yang kita ingat pada tempoh sama tahun lalu bukan lagi realiti.
Mula berdagang sekarang – Klik di sini untuk membuat akaun sebenar VT Markets
USD/CHF meningkat ke sekitar 0.7930 pada Khamis, naik 0.15% pada hari tersebut. Pergerakan itu menyusul permintaan yang stabil terhadap Dolar AS di tengah ketidaktentuan geopolitik dan berkurangnya harapan untuk gencatan senjata antara AS dan Iran.
Indeks Dolar AS (DXY) kekal berhampiran paras tertinggi terbaharu sekitar 99.90. Ketegangan meningkat selepas Iran menolak cadangan gencatan senjata 15 perkara Presiden AS Donald Trump, menyifatkannya sebagai “terlalu maksimalis dan tidak munasabah”.
Rundingan Gencatan Senjata Tergendala
The Wall Street Journal melaporkan bahawa Iran mahukan jaminan terhadap permusuhan yang boleh tercetus semula, penamatan serangan Israel ke atas Hezbollah, serta lebih kawalan ke atas Selat Hormuz, termasuk hak untuk mengutip yuran transit. Pegawai AS berkata syarat-syarat ini tidak realistik, sekali gus menurunkan kebarangkalian perjanjian dalam masa terdekat.
Sikap berhati-hati pasaran menyokong permintaan untuk aset lindung nilai seperti Dolar AS, manakala niaga hadapan ekuiti AS kekal tertekan. Trump berkata perunding Iran sedang “merayu” untuk mencapai perjanjian dan menggesa mereka supaya “lebih serius”.
Tinjauan Reuters menunjukkan kebanyakan ahli ekonomi menjangka Rizab Persekutuan akan mengekalkan kadar faedah dalam julat 3.50%–3.75% sekurang-kurangnya sehingga September. Pemotongan kadar masih dijangka lewat tahun ini di tengah inflasi yang berterusan.
Franc Switzerland secara umum kekal stabil. Bank Negara Switzerland (SNB) mengulangi bahawa ia bersedia untuk campur tangan bagi membendung pengukuhan Franc yang berlebihan, dengan Pengerusi Martin Schlegel berkata kesediaan untuk bertindak telah meningkat.
Pemacu Beralih Sejak Awal 2025
Mengimbas kembali awal 2025, pasaran dilihat tertumpu pada ketegangan AS-Iran, yang mendorong USD/CHF ke arah 0.7930 susulan permintaan lindung nilai untuk dolar. Bias kenaikan itu terbukti tepat, memandangkan pasangan ini kini diniagakan jauh lebih tinggi sekitar 0.8950. Pemacu utama sejak itu telah beralih daripada geopolitik kepada perbezaan dasar monetari yang lebih jelas.
Unjuran Rizab Persekutuan yang kita lihat pada 2025, yang menjangkakan pemotongan kadar lewat tahun tersebut daripada puncak 3.75%, ternyata terlalu dovish. Sebaliknya, inflasi yang berterusan memaksa Fed mengekalkan kadar lebih tinggi untuk lebih lama, dan ia kini berada dalam julat 4.75%-5.00% walaupun selepas satu pemotongan berhati-hati baru-baru ini. Dengan data CPI AS terkini bagi Februari 2026 menunjukkan inflasi masih melekit pada 2.8%, kami percaya Fed akan perlahan untuk membuat pemotongan lanjut.
Sebaliknya, SNB telah bergerak tegas ke arah bertentangan, menunaikan pendirian berhati-hati yang kami catat pada 2025. SNB menjadi bank pusat utama pertama yang memotong kadar, mengejutkan pasaran dan menurunkan kadar dasarnya kepada 1.25% hanya minggu lalu. Langkah agresif untuk melemahkan franc ini mewujudkan perbezaan kadar faedah yang ketara yang memihak kepada pegangan dolar AS berbanding franc Switzerland.
Memandangkan jurang dasar yang semakin melebar ini, pedagang wajar mempertimbangkan penggunaan opsyen untuk membuat posisi bagi pengukuhan lanjut USD/CHF. Volatiliti tersirat telah menurun sejak kebimbangan geopolitik awal 2025 reda, menjadikan opsyen panggilan (call) panjang atau spread bull call lebih berpatutan kini. Strategi ini menawarkan cara berisiko terhad untuk meraih keuntungan jika perbezaan kadar faedah terus menolak pasangan ini lebih tinggi.
Secara khusus, kita wajar melihat kontrak opsyen 3 bulan dan 6 bulan untuk menangkap tempoh jangkaan perbezaan dasar yang berterusan. Risiko utama kepada pandangan ini ialah lonjakan mendadak penghindaran risiko global yang mengembalikan tarikan franc sebagai aset selamat, atau jika data ekonomi AS melemah secara tidak dijangka, memaksa Fed memberi isyarat pemotongan kadar yang lebih pantas.
Mula berdagang sekarang – Klik di sini untuk membuat akaun sebenar VT Markets
S&P 500 susut 1.74%, dengan niaga hadapan kini cuba bangkit semula.
Trump menangguhkan tindakan selama 10 hari, meredakan sentimen risiko dalam terdekat.
Hasil bon dan harga tenaga yang meningkat terus mendorong kebimbangan stagflasi.
Niaga hadapan ekuiti A.S. meningkat kecil pada Jumaat, dengan S&P 500 cuba menstabil selepas susut 1.74% pada sesi sebelumnya.
Lantunan itu menyusuli jualan besar-besaran merentasi indeks utama, dengan Dow jatuh 1.01% dan Nasdaq merosot 2.38%, diterajui kelemahan saham teknologi.
US stocks sank on Thursday amid uncertainty over the Middle East conflict, with oil hovering above $100. pic.twitter.com/2fzKNYsZv8
Hasil Perbendaharaan meningkat sepanjang sesi, memberi tekanan kepada penilaian, khususnya dalam sektor berorientasikan pertumbuhan.
Sebarang pemulihan mungkin kekal rapuh apabila hasil bon dan risiko makro terus membebankan sentimen.
Penangguhan Geopolitik Beri Kelegaan Sementara
Pasaran menerima sedikit kelegaan selepas Presiden Donald Trump melanjutkan tarikh akhir bagi kemungkinan serangan ke atas infrastruktur tenaga Iran selama 10 hari.
Langkah itu membayangkan rundingan masih berjalan, sekali gus mengurangkan risiko peningkatan ketegangan dalam masa terdekat.
A senior officer onboard a tanker said his ship was given permission to pass through the Strait of Hormuz by Iran, and guided by the navy, following negotiations between Tehran and New Delhi https://t.co/nlSPyDVkdi
Namun, Iran menolak cadangan 15 perkara A.S. dan mengemukakan syaratnya sendiri, termasuk kawalan ke atas selat itu, menyebabkan ketegangan masih belum selesai.
Rali berasaskan kelegaan mungkin tidak bertahan lama kecuali terdapat kemajuan jelas ke arah penyah-eskalasi.
Kenaikan Hasil dan Harga Tenaga Dorong Kebimbangan Stagflasi
Reaksi pasaran yang lebih luas mencerminkan kebimbangan yang semakin meningkat terhadap stagflasi.
Kenaikan mendadak harga tenaga menyemarakkan jangkaan inflasi, manakala hasil Perbendaharaan yang lebih tinggi mengetatkan keadaan kewangan.
Interest-rate strategists at Morgan Stanley say this month’s Treasury market slump has hallmarks of forced selling of two-year notes, whose yields soared as traders abandoned wagers on Federal Reserve interest-rate cuts and began to price in a hike https://t.co/rGSdCV7Tjw
Gabungan ini amat mencabar untuk ekuiti, kerana ia meningkatkan kadar diskaun sambil mengancam pertumbuhan ekonomi.
Saham teknologi, yang sensitif terhadap perubahan kadar faedah, menerajui kejatuhan pada sesi sebelumnya.
Tekanan berterusan daripada hasil mungkin mengehadkan kenaikan ekuiti, khususnya dalam sektor yang sensitif kadar faedah.
Tinjauan Teknikal Menunjukkan Tekanan Aliran Menurun
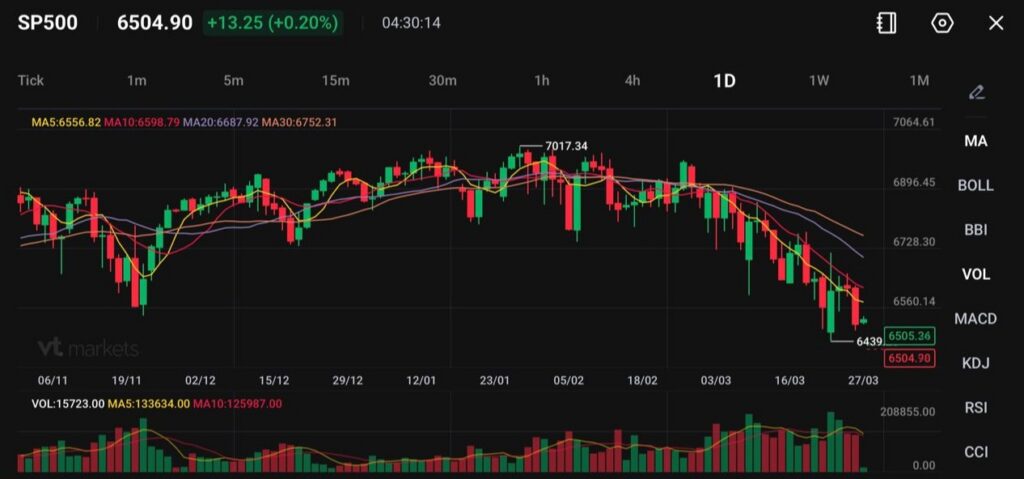
S&P 500 (SP500) didagangkan sekitar 6505, cuba membuat lantunan ringan selepas jualan mendadak yang menolak harga turun ke paras rendah ~6439. Struktur lebih luas telah beralih daripada julat sebelumnya kepada aliran menurun jangka pendek yang jelas, dan lantunan ini setakat ini kelihatan lebih bersifat pembetulan berbanding lonjakan impulsif.
Struktur Trend dan Momentum
Harga telah menembusi ke bawah semua purata bergerak utama, dengan:
MA5: 6556
MA10: 6598
MA20: 6687
MA30: 6752
Semua purata bergerak kini condong menurun dan tersusun secara bearish, mengesahkan tekanan menurun yang berterusan. Lilin-lilin terkini menunjukkan paras tinggi lebih rendah dan paras rendah lebih rendah, iaitu tingkah laku kesinambungan trend yang klasik.
Lantunan semasa sedang menguji bahagian bawah purata jangka pendek, khususnya zon MA5 dan MA10 (6550–6600), yang kini bertindak sebagai rintangan dinamik.
Volum meningkat ketika fasa jualan dan menyusut sedikit semasa lantunan. Ini menunjukkan pembeli masih belum benar-benar komited.
Paras Utama untuk Diperhatikan
Rintangan Terdekat: 6550 → 6600
Rintangan Lebih Kukuh: 6685 → 6750
Sokongan: 6439 → 6400
Paras Pecahan: Di bawah 6400 membuka ruang ke zon 6300
Paras rendah 6439 ialah lantai utama untuk jangka terdekat. Penembusan jelas di bawah paras itu berkemungkinan mempercepat momentum menurun.
Di sebelah atas, harga perlu menawan semula 6600 terlebih dahulu, kemudian 6685 (zon MA20) untuk mengubah sentimen kembali ke arah neutral.
Pemerhatian Tingkah Laku Harga
Penolakan daripada paras tinggi 7017 sebelum ini telah mencetuskan peralihan struktur sepenuhnya. Pasaran yang sebelum ini mendatar kini beralih kepada fasa pengagihan, diikuti pecahan ke bawah.
Lantunan terkini menunjukkan:
Lilin yang lebih kecil
Pembelian yang kurang agresif
Rintangan cepat bertahan
Ini lazim bagi lantunan semula bearish, bukannya pembalikan arah.
Perkara Seterusnya untuk Diperhatikan
Perhatikan reaksi harga sekitar 6550–6600:
Penolakan di sini: Berkemungkinan kesinambungan penurunan ke arah 6439 dan berpotensi 6400
Menembusi dan kekal di atas 6600: Membuka ruang “squeeze” ke arah 6685
Selain itu, perhatikan juga:
Hasil bon A.S. (hasil lebih tinggi menekan ekuiti)
Kekuatan USDX (dolar yang kuat sering membebankan aset berisiko)
Tinjauan Berhati-hati
Bias jangka pendek kekal bearish selagi di bawah 6600, dengan rali berkemungkinan menjadi peluang untuk dijual. Momentum hanya berubah jika harga mampu menawan semula dan kekal di atas purata 20 hari (~6685). Sehingga itu, struktur memihak kepada paras tinggi yang lebih rendah serta tekanan berterusan ke atas zon sokongan.
Apa Yang Pedagang Patut Perhatikan Seterusnya
Pasaran kekal dipacu gabungan faktor geopolitik dan makro. Bidang utama untuk dipantau termasuk:
Kemajuan dalam rundingan A.S.–Iran
Pergerakan hasil Perbendaharaan
Kestabilan harga minyak dan aliran bekalan melalui Hormuz
Prestasi saham teknologi
Buat masa ini, S&P 500 cuba mencari tapak sokongan, namun imbangan antara pengurangan risiko geopolitik dan pengetatan keadaan kewangan kekal dalam keadaan yang sangat seimbang.
Soalan Lazim (FAQ)
Mengapa S&P 500 Jatuh Mendadak Baru-baru Ini?
S&P 500 susut 1.74% disebabkan kenaikan hasil Perbendaharaan, harga minyak yang lebih tinggi, serta kebimbangan stagflasi yang meningkat.
Apa yang Mencetuskan Lantunan Niaga Hadapan Saham A.S.?
Niaga hadapan meningkat selepas Trump menangguhkan kemungkinan serangan ke atas Iran selama 10 hari, sekali gus meredakan kebimbangan geopolitik dalam masa terdekat.
Bagaimana Kenaikan Harga Minyak Mempengaruhi Saham A.S.?
Harga minyak yang lebih tinggi meningkatkan risiko inflasi, menaikkan kos perniagaan, dan memberi tekanan kepada bank pusat untuk mengekalkan dasar yang ketat.
Mengapa Hasil Perbendaharaan Penting untuk Ekuiti?
Hasil yang meningkat menaikkan kos pinjaman dan mengurangkan nilai kini pendapatan masa hadapan, sekali gus menekan penilaian saham.
Mengapa Saham Teknologi Menerajui Kejatuhan?
Saham teknologi lebih sensitif kepada kadar faedah, jadi hasil yang lebih tinggi cenderung mencetuskan jualan yang lebih ketara dalam sektor tersebut.
Apakah Risiko Stagflasi dan Mengapa Ia Penting?
Stagflasi menggabungkan pertumbuhan yang perlahan dengan inflasi yang meningkat, yang mencabar kedua-dua ekuiti dan bank pusat.
Adakah Lantunan Pasaran Semasa Mampan?
Pemulihan ini mungkin rapuh melainkan hasil stabil dan ketegangan geopolitik reda.
Mula berdagang sekarang – Klik di sini untuk membuat akaun sebenar VT Markets
Francesco Pesole dari ING menjejaki mesej Bank of England daripada ahli MPC, Sarah Breeden, Alan Taylor dan Megan Greene. Beliau menyifatkan komen Greene dan Breeden sebagai bercampur-campur tetapi cenderung ke arah pendirian hawkish, manakala Taylor kekal dengan pandangan dovish.
Greene mengulangi kebimbangan mengenai inflasi. Breeden berkata beliau akan mengundi untuk pemotongan kadar pada mesyuarat minggu lalu sekiranya lonjakan harga tenaga tidak berlaku, namun nada keseluruhannya kekal hawkish.
Mesej BoE Isyaratkan Kecenderungan Bercampur
Taylor dilihat sebagai satu-satunya ahli MPC yang kekal dovish minggu lalu. Beliau berkata kejutan tenaga sementara mempunyai implikasi terhad terhadap inflasi jangka sederhana dan bahawa ambang untuk kenaikan kadar adalah tinggi.
Pesole berkata senario penyah-eskalasi boleh memberi lebih ruang untuk penetapan semula dovish dalam jangkaan kadar UK, sekali gus menjejaskan lengkung Pound. Beliau mengekalkan pandangan asas bahawa EUR/GBP boleh bergerak melepasi 0.8700 dalam beberapa minggu akan datang apabila jangkaan kadar UK diselaraskan lebih rendah.
Artikel itu menyatakan ia dihasilkan dengan bantuan alat AI dan disemak oleh seorang editor. Ia juga menerangkan Pasukan FXStreet Insights sebagai memilih pemerhatian pasaran daripada pakar serta menambah input penganalisis dalaman dan luaran.
Pada 2025, kami memerhati kemungkinan perubahan dovish daripada ahli Bank of England seperti Greene dan Breeden, yang sebelum ini agak hawkish. Peralihan yang dijangka itu kini semakin hampir apabila inflasi UK telah turun dengan ketara kepada 2.5% berdasarkan data bulan lalu, susut mendadak berbanding paras tahun lalu. Persekitaran ini mewujudkan peluang kerana pasaran mungkin masih memandang rendah kebarangkalian pemotongan kadar bermula musim panas ini.
Implikasi Untuk Kedudukan Eur Gbp
Sebab utama pasaran teragak-agak ialah pertumbuhan gaji UK kekal “melekit”, masih sekitar 4.5%, yang menjadi kebimbangan utama bank pusat. Bagaimanapun, pecahan undi Bank of England pada mesyuarat Mac 2026 melebar kepada 7-2 memihak kepada mengekalkan kadar, dengan dua ahli kini secara aktif mengundi untuk pemotongan. Dari segi sejarah, apabila dua ahli membantah demi pemotongan, pusingan dasar penuh lazimnya menyusul dalam dua mesyuarat seterusnya.
Bagi pedagang derivatif, ini mencadangkan pembentukan posisi untuk Pound yang lebih lemah berbanding euro apabila jangkaan kadar UK diselaraskan lebih rendah. Membeli opsyen panggilan EUR/GBP dengan harga mogok sekitar 0.8700 dan tarikh luput pada Jun 2026 merupakan cara langsung untuk memanfaatkan pandangan ini. Strategi ini menawarkan risiko yang terhad bagi potensi pergerakan naik mendadak dalam pasangan mata wang tersebut jika BoE memberi isyarat pemotongan kadar semakin hampir.
Kami masih melihat ruang untuk EUR/GBP bergerak melepasi 0.8700 dalam beberapa minggu akan datang. Bank Pusat Eropah juga berada pada laluan untuk memotong kadar, namun dengan pertumbuhan Zon Euro yang lebih lembap, tindakan mereka sebahagian besarnya sudah dijangka pasaran. Potensi kejutan yang lebih besar terletak pada Bank of England, bermakna Pound mempunyai lebih ruang untuk melemah apabila penetapan semula dovish ini berlaku.
Mula berdagang sekarang – Klik di sini untuk membuat akaun sebenar VT Markets
Rand Afrika Selatan (ZAR) berdepan tekanan yang semakin meningkat apabila ia mengetuai aliran keluar dalam kalangan mata wang pasaran sedang pesat membangun (EM) berpulangan tinggi menjelang keputusan Bank Rizab Afrika Selatan (SARB). Sepanjang minggu lalu, ZAR merupakan mata wang EM berpulangan tinggi dengan prestasi terburuk, walaupun masih antara yang paling kukuh pegangan.
Dagangan kebelakangan ini menyaksikan penjualan ZAR yang lebih pantas, dengan sebahagian posisi mata wang secara terus mula diterbalikkan. Jangkaan pasaran terhadap dasar SARB telah beralih daripada laluan hampir “autopilot” ke arah sasaran inflasi yang lebih rendah kepada penetapan harga pengetatan agresif.
Laporan itu mengaitkan penetapan semula harga ini dengan kebimbangan yang meningkat terhadap imbangan pembayaran Afrika Selatan dan kestabilan rand. Ia menunjukkan SARB dijangka mengambil pendirian yang tegas bernada hawkish bagi mengurangkan kemerosotan lanjut, khususnya jika tekanan imbangan pembayaran meningkat.
Keputusan SARB digambarkan sebagai satu lagi ujian bagi mata wang berpulangan tinggi, terutama di EMEA. Laporan itu menambah bahawa tindak balas hawkish diperlukan dalam persekitaran semasa.
Bagi pedagang derivatif, ini menunjukkan volatiliti rand yang meningkat dalam minggu-minggu akan datang. Pembelian opsyen panggilan (call) ke atas USD/ZAR menawarkan cara untuk mengambil posisi bagi kelemahan rand selanjutnya, memandangkan strategi ini memberikan pendedahan kenaikan dengan risiko penurunan yang terhad. Volatiliti tersirat bagi opsyen ZAR satu bulan telah pun meningkat daripada 15% kepada melebihi 18% dalam beberapa minggu kebelakangan ini, menandakan pasaran bersedia menghadapi ayunan harga yang lebih besar.
Pasaran kini sudah menetapkan harga kebarangkalian yang tinggi untuk kenaikan 25 mata asas oleh SARB pada mesyuarat seterusnya. Pedagang perlu berhati-hati, kerana sebarang tanda teragak-agak daripada bank pusat boleh mencetuskan jualan mendadak. Oleh itu, pemantauan perjanjian kadar hadapan (FRA) jangka pendek akan menjadi kritikal untuk menilai perubahan dalam jangkaan dasar monetari.
Mula berdagang sekarang – Klik di sini untuk membuat akaun sebenar VT Markets
NZD/USD jatuh untuk hari ketiga, merosot di bawah 0.5800 selepas berundur daripada paras tinggi minggu lalu berhampiran 0.5900. Ia mencecah 0.5781 semasa sesi Eropah pada Khamis.
Sentimen pasaran melemah selepas Iran menolak pelan 15-perkara AS yang bertujuan menamatkan perang di Timur Tengah. Menteri Luar Iran, Abbas Araghchi, berkata tiada rundingan dengan AS selagi pengeboman berterusan.
Eskalasi Timur Tengah Mendorong Sentimen Risk-Off
Donald Trump menggesa Iran supaya “lebih serius” mengenai rundingan menerusi hantaran di Truth Social dan memberi amaran AS boleh bertindak balas dengan “menghentam lebih kuat” jika syarat tidak dipenuhi. Pesawat Israel mengebom timur Iran, manakala Iran melancarkan serangan peluru berpandu dan dron baharu ke atas Israel.
Iran turut mengemukakan cadangan damainya sendiri, menuntut jaminan terhadap tindakan ketenteraan pada masa hadapan, pampasan kerosakan perang, serta kawalan rasmi ke atas Selat Hormuz. Pelan itu juga merangkumi permintaan gencatan senjata di Lubnan.
Kalendar New Zealand sebahagian besarnya kosong, dengan Tinjauan Keyakinan Pengguna Roy Morgan dijadualkan lewat Khamis. Di AS, Tuntutan Pengangguran mingguan serta kenyataan daripada beberapa penceramah Rizab Persekutuan dijangka dikeluarkan.
Mula berdagang sekarang – Klik di sini untuk membuat akaun sebenar VT Markets
ECB mengadakan persidangan tahunan “ECB & Its Watchers” di Frankfurt, dengan Presiden Christine Lagarde dan Ketua Ahli Ekonomi Philip Lane berucap. Kenyataan mereka menunjukkan kesediaan yang lebih tegas untuk mengetatkan dasar monetari berbanding kitaran terdahulu.
Perbincangan menumpukan kepada tindak balas terhadap kejutan inflasi yang didorong tenaga, dengan ECB memberi isyarat fungsi tindak balas yang lebih keras. Lagarde berkata ECB bersedia untuk bertindak “pada mana-mana mesyuarat”.
Fungsi Tindak Balas ECB Lebih Agresif
Penceramah merujuk kepada keputusan tinjauan yang akan datang sebagai penting untuk menilai risiko inflasi jangka terdekat. Jika penunjuk ini merosot, ECB boleh menaikkan kadar seawal S2.
Perhatian pasaran tertumpu pada tinjauan berkaitan inflasi yang diterima masuk dan ukuran perniagaan, termasuk harga input PMI. Indeks PMI Komposit Harga Input zon euro disebut sebagai membayangkan potensi kenaikan yang sangat ketara dalam ukuran inflasi.
ECB menyampaikan kesediaan untuk bergerak sementara menunggu bukti yang lebih jelas mengenai penularan inflasi.
Implikasi Terhadap Kadar, FX dan Volatiliti
Terdapat keutamaan yang jelas untuk bertindak secara proaktif, menerima risiko pertumbuhan ekonomi yang lebih perlahan daripada membiarkan inflasi berakar umbi. Bagi pedagang derivatif, data tinjauan yang akan datang kini pemangkin paling penting kepada pergerakan pasaran. HCOB Flash Eurozone PMI terkini bagi Mac menunjukkan indeks harga input meningkat untuk bulan kedua berturut-turut, satu isyarat bahawa tekanan harga sedang terbina di peringkat korporat.
Persekitaran ini mencadangkan penentududukan untuk kadar faedah jangka pendek yang lebih tinggi di zon euro dalam minggu-minggu mendatang. Kita hanya perlu melihat kembali tempoh 2022-2023, yang dari perspektif kami pada 2025 merupakan pengajaran jelas tentang betapa pantas pasaran menilai semula apabila ECB beralih haluan. Pedagang niaga hadapan Euribor wajar memerhati potensi jualan jika ukuran inflasi yang akan datang terus mengejutkan ke arah lebih tinggi.
Sikap ECB yang lebih tegas juga sepatutnya menyokong euro, khususnya berbanding mata wang yang bank pusatnya dilihat lebih dovish. Ini boleh meningkatkan tarikan untuk membeli opsyen panggilan bagi pasangan EUR/USD atau EUR/JPY. Ketidakpastian yang meningkat mengenai masa kenaikan kadar berpotensi akan mendorong volatiliti lebih tinggi, menjadikan strategi opsyen yang mendapat manfaat daripada turun naik harga lebih menarik.
Mula berdagang sekarang – Klik di sini untuk membuat akaun sebenar VT Markets