PMI Pembuatan HCOB Perancis meningkat kepada 50.2 pada Mac. Ini melebihi unjuran 49.
Bacaan melebihi 50 menunjukkan pengembangan aktiviti pembuatan. Bacaan di bawah 50 menunjukkan penguncupan.
Implikasi Terhadap Aset Risiko Eropah
Pengembangan yang tidak dijangka dalam sektor pembuatan Perancis mencabar pandangan lazim mengenai ekonomi Eropah yang lembap. Kejutan positif ini menunjukkan kekuatan asas yang belum lagi diambil kira sepenuhnya oleh pasaran. Oleh itu, kami wajar melaraskan strategi untuk mengambil kira potensi kenaikan aset Eropah.
Data ini berpotensi menjadi pemangkin penting kepada indeks CAC 40, yang kebanyakannya bergerak mendatar sepanjang suku ini. Memandangkan pendapatan korporat bagi suku pertama 2026 dijangka dilaporkan dalam beberapa minggu akan datang, kekuatan pembuatan ini mungkin menandakan keputusan yang lebih baik daripada jangkaan bagi syarikat perindustrian. Kami mempertimbangkan untuk membeli opsyen panggilan jangka terdekat pada indeks bagi memanfaatkan potensi penembusan.
Isyarat ekonomi yang lebih kukuh turut membawa implikasi kepada Euro, khususnya ketika Bank Pusat Eropah memberi isyarat pendirian berhati-hati. Data ini menjadikan pemotongan kadar faedah sebelum suku ketiga jauh kurang berkemungkinan, berbeza dengan penetapan harga pasaran yang menunjukkan 40% peluang pemotongan pada Jun hanya minggu lalu. Sehubungan itu, kami melihat nilai dalam posisi menaik untuk Euro berbanding dolar A.S., mungkin melalui pembelian niaga hadapan EUR/USD.
Melihat ke belakang, kita mengingati bagaimana pada 2025 pasaran memberi tumpuan kepada kelemahan perindustrian, yang menolak hasil bon 10 tahun Perancis ke paras terendah dalam tempoh dua tahun. Angka pembuatan hari ini mencadangkan trend itu mungkin berbalik, sekali gus boleh memperkenalkan semula tekanan inflasi. Ini mendorong kami mempertimbangkan dagangan yang akan mendapat manfaat daripada kenaikan hasil bon, seperti membeli opsyen jual pada niaga hadapan Euro-OAT.
Prospek Kadar Dan Inflasi
Mula berdagang sekarang – Klik di sini untuk membuat akaun sebenar VT Markets
Emas (XAU/USD) kembali naik melepasi paras $4,400 pada awal dagangan Eropah pada Selasa, selepas pulih daripada kerugian intrahari dan menghampiri paras tertinggi harian. Kenaikan lanjut bagaimanapun terhad oleh pendirian bank pusat yang kekal hawkish serta pengukuhan Dolar AS, yang mengurangkan permintaan terhadap aset tanpa pulangan (non-yielding).
Iran menafikan sedang mengadakan rundingan dengan AS untuk menamatkan perang, selepas Presiden Donald Trump berkata pada Isnin bahawa satu perjanjian boleh dicapai tidak lama lagi. Penasihat kanan Mohsen Rezaei berkata perang akan berterusan sehingga Iran menerima pampasan penuh, manakala tekanan baharu ke atas infrastruktur tenaga Iran serta penutupan berkesan Selat Hormuz menyokong harga minyak mentah.
Pemacu Harga Emas Dan Sentimen Pasaran
Harga minyak yang lebih tinggi menambah kepada kebimbangan inflasi yang kembali meningkat, sekali gus menggalakkan jangkaan bahawa bank pusat mungkin menaikkan kadar faedah. Pasaran kini hampir sepenuhnya menyingkirkan kemungkinan pemotongan kadar oleh Rizab Persekutuan (Fed) dan telah meningkatkan pertaruhan terhadap kenaikan kadar menjelang akhir tahun ini, mendorong hasil Perbendaharaan AS lebih tinggi dan menyokong USD.
Ketegangan berterusan di Timur Tengah turut menyokong permintaan aset selamat, sekali gus mengehadkan jualan baharu dalam emas. Pedagang menantikan data PMI kilat global bagi hala tuju jangka terdekat.
Dari sudut teknikal, emas menembusi di bawah SMA 100 hari minggu lalu, sebelum menemui sokongan berhampiran SMA 200 hari sekitar $4,100. MACD (12, 26, 9) kekal negatif, manakala RSI berada pada 25.82; sokongan terletak pada $4,305, dengan rintangan pada $4,650, $4,820, $4,610, dan seterusnya $5,000.
Strategi Dagangan Dan Paras Utama
Namun, konflik yang berlarutan di Timur Tengah menghalang kejatuhan harga sepenuhnya. Penafian Iran mengenai rundingan damai dan gangguan berterusan di sekitar Selat Hormuz mengekalkan bidaan aset selamat. Ini mewujudkan lantai sokongan kepada pasaran, kerana sebarang peningkatan ketenteraan boleh mencetuskan lonjakan ketara kepada keselamatan dan mendorong harga emas naik mendadak.
Dari perspektif dagangan, menjual ketika lantunan menghampiri kluster rintangan berhampiran SMA 100 hari sekitar $4,610 dilihat sebagai strategi yang munasabah. Kita boleh mempertimbangkan untuk membeli opsyen put dengan harga mogok di bawah $4,300 bagi memanfaatkan potensi penembusan ke arah paras sokongan utama $4,100. Strategi ini memanfaatkan tekanan menurun yang dominan daripada dasar monetari sambil menetapkan risiko dengan jelas.
Bacaan RSI yang terlebih jual memang mencadangkan berhati-hati daripada mengejar harga lebih rendah dari sini, memandangkan keadaan serupa pernah mendahului lantunan tajam pada suku keempat 2025. Bagi pedagang yang menjangkakan tempoh pergerakan tidak menentu tetapi mendatar (range-bound), menjual straddle boleh menangkap premium ketika emas menyatu antara paras sokongan dan rintangan utamanya. Pendekatan ini mendapat manfaat daripada volatiliti tanpa memilih arah tertentu.
Akhirnya, kami memerhati purata pergerakan 200 hari sekitar $4,100 sebagai titik pangsi kritikal. Penembusan tegas di bawah paras ini akan memberi isyarat pembetulan yang lebih mendalam sedang berlaku. Sebaliknya, jika sokongan ini kekal kukuh di tengah-tengah berita geopolitik yang semakin buruk, kami akan mempertimbangkan untuk membeli opsyen call bagi memposisikan diri terhadap potensi squeeze kembali ke arah $4,800.
Mula berdagang sekarang – Klik di sini untuk membuat akaun sebenar VT Markets
Brent mentah mengalami turun naik pantas apabila laporan mengenai kemungkinan rundingan AS–Iran muncul sebelum dinafikan. Harga merosot di bawah $100 sebelum kembali meningkat melepasi $103 apabila kebimbangan mengenai peningkatan eskalasi serantau muncul semula.
Brent turun daripada $113 setong kepada $99.94 setong pada penutupan, pergerakan sebanyak -10.92%. WTI turut jatuh, daripada sekitar $99 setong kepada $88.13 setong pada penutupan.
Tajuk Berita Geopolitik Memacu Volatiliti
Selepas pegawai Iran menafikan sebarang rundingan, Brent melonjak hampir 4% kepada $103.88 setong. Niaga hadapan S&P 500 turun -0.69% manakala niaga hadapan STOXX 50 turun -0.84%.
Brent kekal di bawah paras tertinggi intra hari sebelumnya. Pergerakan ini dikaitkan dengan perubahan jangkaan mengenai tempoh konflik, risiko inflasi, dan dasar kadar faedah dalam masa terdekat.
Menoleh semula kepada volatiliti pada 2025, kita melihat betapa sensitifnya Brent terhadap tajuk berita geopolitik yang melibatkan Iran. Satu khabar angin mengenai rundingan sahaja sudah cukup menghantar harga menjunam daripada $113 kepada bawah $100 dalam satu sesi. Reaksi sepantas picu yang sama masih wujud dalam pasaran hari ini.
Memandangkan Brent kini stabil sekitar $87 setong, pasaran pada asasnya disokong oleh keputusan terbaru OPEC+ untuk melanjutkan pemotongan pengeluaran sehingga suku kedua. Namun, data mingguan EIA yang menunjukkan peningkatan inventori minyak mentah A.S. sebanyak 1.4 juta tong minggu lalu menandakan gambaran bekalan tidak sepenuhnya ketat. Ini mewujudkan keseimbangan yang rapuh di mana berita boleh memberi impak yang tidak seimbang.
Ini mencadangkan bahawa mengambil pandangan arah yang tegas menggunakan niaga hadapan adalah strategi berisiko tinggi dalam beberapa minggu akan datang. Pengajaran daripada 2025 ialah sebarang perkembangan, sama ada benar atau sekadar khabar angin, boleh memadamkan keuntungan atau kerugian sekelip mata.
Berdagang Volatiliti, Bukan Arah
Indeks Volatiliti Minyak Mentah CBOE (OVX) sudah pun meningkat kepada 33, menunjukkan pasaran sedang mengambil kira ayunan harga yang lebih besar. Pedagang wajar mempertimbangkan strategi volatiliti panjang, seperti membeli straddle atau strangle, yang mendapat manfaat daripada pergerakan harga yang ketara dalam mana-mana arah. Pendekatan ini mengurangkan keperluan untuk meneka dengan tepat hasil perbincangan geopolitik yang sukar dibaca.
Selain itu, kita tidak boleh mengetepikan naratif inflasi yang begitu dominan pada 2025. Sebarang lonjakan mendadak dalam harga minyak akan segera mengembalikan kebimbangan bank pusat ke barisan hadapan, menambah satu lagi lapisan ketidaktentuan. Ini mengukuhkan lagi alasan untuk strategi yang bersedia menghadapi pergerakan tajam dan sukar dijangka, bukannya trend yang stabil.
Mula berdagang sekarang – Klik di sini untuk membuat akaun sebenar VT Markets
Yen Jepun pulih daripada kerugian awal berbanding Dolar AS dan diniagakan hampir mendatar sekitar 158.50 dalam sesi Eropah pada Selasa. USD/JPY menyusut apabila Dolar AS melepaskan sebahagian keuntungan awal di tengah-tengah selera risiko yang bertambah baik.
Niaga hadapan S&P 500 memadamkan penyusutan awal dan beralih positif sekitar 6,600.00 semasa dagangan Eropah. Indeks Dolar AS (DXY) turun daripada paras tertinggi harian 99.45 kepada kira-kira 99.15.
Selera Risiko Bertambah Baik
Sentimen risiko bertambah baik susulan jangkaan bahawa konflik di Timur Tengah mungkin tidak meluas. Ini berikutan kenyataan Presiden AS Trump bahawa beliau mengarahkan Jabatan Perang untuk menghentikan serangan ke atas loji janakuasa Iran selama lima hari.
Iran menolak laporan mengenai rundingan langsung dengan AS berkaitan penyaheskalasi. Walaupun begitu, komen Trump menyokong jangkaan kemungkinan penyelesaian.
Di Jepun, Yen mendapat sokongan selepas kenyataan Bank of Japan yang menunjukkan tekanan inflasi meningkat secara sederhana. Gabenor Ueda berkata inflasi asas dijangka memecut secara sederhana, dengan merujuk kepada pasaran buruh yang ketat serta tingkah laku penetapan gaji dan harga.
CPI Nasional Jepun tidak termasuk makanan segar bagi Februari meningkat 1.6% tahun ke tahun. Ini lebih rendah daripada unjuran 1.7% dan bacaan terdahulu 2%.
Tinjauan Volatiliti
Peningkatan selera risiko, didorong oleh jeda permusuhan di Timur Tengah, memberi tekanan kepada status Yen sebagai mata wang selamat. Kami melihat keyakinan baharu ini pada niaga hadapan S&P 500, yang menunjukkan aliran modal menjauhi aset selamat dan masuk ke aset berisiko lebih tinggi. Persekitaran sebegini lazimnya memihak kepada penjualan Yen untuk membiayai dagangan carry, khususnya berbanding mata wang dengan kadar faedah lebih tinggi.
Namun, ini perlu ditimbang dengan pendirian yakin Bank of Japan, yang disokong oleh data sebenar. Selepas rundingan “Shunto” baru-baru ini, di mana firma-firma besar bersetuju dengan kenaikan gaji purata melebihi 4.3%—tertinggi dalam beberapa dekad—naratif inflasi BoJ semakin mendapat kredibiliti. Pedagang wajar mempertimbangkan pembelian opsyen panggilan JPY atau menjual niaga hadapan USD/JPY bagi memposisikan diri untuk kemungkinan kenaikan kadar faedah lebih awal daripada jangkaan pasaran.
Melihat ke belakang, kami menyaksikan situasi serupa pada 2025 apabila komitmen lisan yang kukuh daripada pegawai Jepun mencetuskan lonjakan tajam tetapi singkat pada Yen. Pemacu teras ketika itu—seperti yang mungkin berlaku sekarang—ialah jurang kadar faedah yang besar antara Jepun dan AS. Oleh itu, penggunaan struktur opsyen seperti put spread pada JPY boleh melindungi daripada lonjakan sementara sambil mengekalkan pandangan menurun sekiranya BoJ gagal bertindak tegas.
Isyarat bercanggah antara data inflasi yang lemah dan pertumbuhan gaji yang kukuh mencadangkan satu tempoh volatiliti tinggi sedang menghampiri. Volatiliti tersirat satu bulan bagi USD/JPY baru-baru ini merosot kepada 8.5%, menjadikan straddle opsyen relatif murah. Kami percaya ini membuka peluang untuk berdagang penembusan yang bakal berlaku, kerana pasangan ini berkemungkinan tidak akan kekal dalam julat sempit apabila dasar monetari dan risiko geopolitik menarik ke arah bertentangan.
Mula berdagang sekarang – Klik di sini untuk membuat akaun sebenar VT Markets
Pasaran berhati-hati pada awal Selasa selepas dagangan tidak menentu pada permulaan minggu. Bacaan awal PMI Pembuatan dan Perkhidmatan bagi Mac dijadualkan dikeluarkan dari Jerman, Zon Euro, UK dan AS.
Pada Isnin, Donald Trump berkata serangan ketenteraan terhadap loji janakuasa Iran akan ditangguhkan selepas “perbualan yang baik dan produktif”. Kemudian, kementerian luar Iran berkata tiada “sebarang dialog”, dan Rumah Putih mengatakan situasi itu “bersifat berubah-ubah”.
Fokus Pasaran Beralih Kepada Terbitan PMI
Pada awal Selasa di Eropah, niaga hadapan indeks saham AS lebih rendah dan Indeks USD mengekalkan kenaikan kecil di atas 99.00. Selepas merosot lebih 9% pada Isnin, WTI pulih menghampiri $90, naik kira-kira 1.5% pada hari itu.
Emas jatuh ke paras terendah 2026 berhampiran $4,100 pada Isnin sebelum ditutup hampir $4,400. Ia didagangkan sedikit di atas $4,400 dalam julat sempit pada sesi Eropah.
Di Australia, PMI Komposit S&P Global turun kepada 47 dalam bacaan awal Mac daripada 52.4 pada Februari. AUD/USD didagangkan sedikit di bawah 0.7000.
USD/JPY didagangkan sekitar 158.50; PMI Pembuatan Jepun turun kepada 51.4 daripada 53 dan PMI Perkhidmatan kepada 52.8 daripada 53.8. CPI tahunan Jepun meningkat 1.3% pada Februari selepas 1.5% pada Januari.
EUR/USD mencecah 1.1640 pada Isnin dan kekal di atas 1.1600 pada awal Selasa. GBP/USD berada di atas 1.3400 selepas meningkat lebih 0.6% pada Isnin.
Mula berdagang sekarang – Klik di sini untuk membuat akaun sebenar VT Markets
AUD/JPY merosot untuk sesi kedua dan diniagakan berhampiran 111.00 pada awal dagangan Eropah pada Selasa. Pada carta harian, harga sedang menguji bahagian bawah saluran menaik.
Hala tuju jangka terdekat adalah neutral dengan kecenderungan sedikit menaik, memandangkan pasangan ini kekal di atas Purata Pergerakan Eksponen (EMA) 50 hari yang meningkat. Kejatuhan terbaharu susulan pembetulan daripada kawasan 113.00, manakala EMA sembilan hari mendatar berhampiran paras semasa.
Rsi Isyarat Keseimbangan, Bukan Momentum
Indeks Kekuatan Relatif (RSI) 14 hari berada pada 50, selepas mereda daripada paras terlebih beli melebihi 70 awal bulan ini. Ini menunjukkan keadaan seimbang, bukannya tekanan belian atau jualan yang kuat.
Jika pasangan ini melantun, ia berpotensi mensasarkan 111.50 dan kemudian EMA sembilan hari pada 111.69. Pergerakan melepasi 111.69 boleh membuka ruang untuk menguji semula paras tertinggi sepanjang masa pada 113.96, yang dicatat pada 11 Mac.
Di sebelah bawah, sokongan berada berhampiran 110.60 pada lantai saluran, kemudian EMA 50 hari pada 109.60. Di bawah itu, 108.00 ialah sokongan nombor bulat seterusnya.
Analisis teknikal ini dihasilkan dengan bantuan alat AI.
Strategi Dagangan Sekitar Sokongan Utama
Memandangkan situasi semasa AUD/JPY sekitar paras 111.00, kita berada pada titik keputusan yang kritikal. Pasangan ini sedang menguji bahagian bawah saluran menaik jangka panjangnya, satu isyarat teknikal yang sering mendahului pergerakan lebih rendah. Ini menunjukkan bahawa posisi yang bertaruh pada kesinambungan aliran menaik berdepan risiko segera.
Secara asas, tekanan semakin meningkat daripada kedua-dua sisi pasangan ini. Data terkini pada awal bulan ini menunjukkan inflasi Australia menyederhana kepada 3.2%, sekali gus mengurangkan keperluan segera untuk Reserve Bank of Australia mengekalkan pendirian hawkish. Sementara itu, perbincangan pasaran semakin kuat mengenai kemungkinan Bank of Japan memberi isyarat satu lagi kenaikan kadar kecil dalam mesyuarat April, yang akan mengukuhkan yen.
Perbezaan prospek bank pusat ini menyokong pergerakan menurun bagi pasangan tersebut. Bagi pedagang yang menjangkakan pecahan (breakdown), membeli opsyen put dengan harga mogok di bawah 110.50 boleh menjadi strategi untuk meraih manfaat daripada penurunan ke arah EMA 50 hari berhampiran 109.60. Menjual kontrak niaga hadapan (futures) ialah satu lagi cara langsung untuk mengambil posisi bagi potensi penurunan ini.
Namun, perlu diakui bahawa aliran menaik yang lebih luas masih kekal utuh dari sudut teknikal selagi harga bertahan di atas EMA 50 hari tersebut. Mengimbas kembali suku keempat 2025, kita melihat penurunan serupa di bawah 109.00 dibeli secara agresif, mengingatkan bahawa sentimen bearish boleh berlaku terlalu awal. Bacaan RSI seimbang berhampiran 50 ini juga menandakan keraguan, bukannya tekanan jualan secara menyeluruh.
Bagi mereka yang percaya sokongan akan kekal, satu strategi boleh melibatkan penjualan opsyen put dengan harga mogok sekitar 109.50, mengutip premium dengan jangkaan pasangan ini tidak akan jatuh sejauh itu. Sebagai alternatif, bull call spread boleh menawarkan kaedah kos rendah untuk bertaruh pada lantunan semula ke arah paras tinggi terkini berhampiran 113.00. Pendekatan ini akan mendapat manfaat jika ujian sokongan semasa hanyalah jeda sementara.
Mula berdagang sekarang – Klik di sini untuk membuat akaun sebenar VT Markets
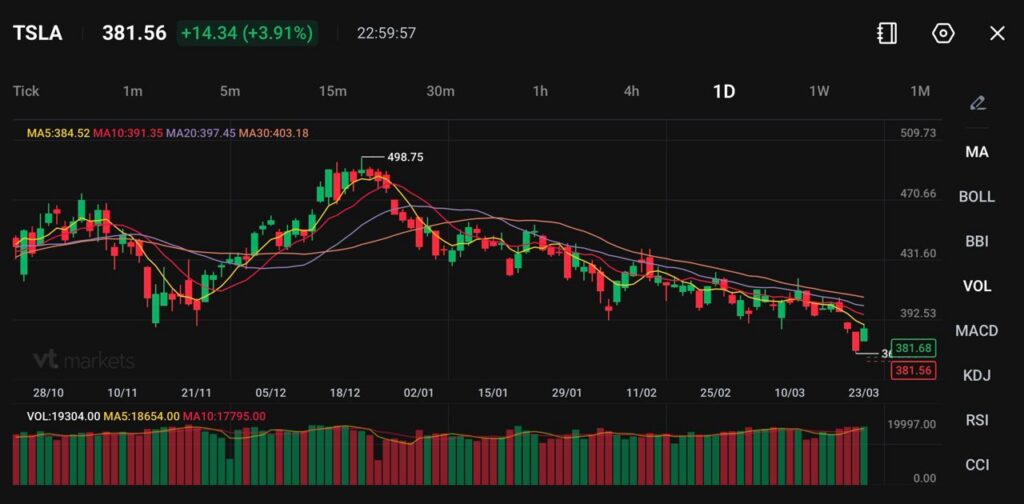
TSLA diniagakan sekitar 381.56, naik +14.34 (+3.91%), selepas pengumuman Terafab.
Tesla merancang perbelanjaan peralatan $20 bilion bagi 2026, selain pelaburan Terafab yang berasingan.
Pengeluaran disasarkan pada lewat 2027, dengan output volum dijangka pada 2028.
Saham Tesla meningkat selepas Elon Musk mendedahkan pelan untuk Terafab, sebuah kemudahan pembuatan semikonduktor yang diposisikan sebagai tonggak kepada ekosistem AI yang lebih luas.
Elon Musk said his Terafab project — a grand plan to eventually manufacture his own chips for robotics, artificial intelligence and space data centers — will be built in Austin and jointly run by Tesla and SpaceX https://t.co/c0bXI7mLZt
TSLA kini diniagakan sekitar 381.56, meningkat +3.91%, apabila pelabur memberi reaksi positif terhadap skala dan aspirasi projek tersebut.
Pengumuman itu menambah dimensi baharu kepada naratif Tesla, mengalihkan sebahagian cerita daripada kenderaan elektrik kepada infrastruktur bagi kecerdasan buatan.
Rali ini mencerminkan optimisme terhadap pertumbuhan jangka panjang, namun pergerakan harga jangka dekat berpotensi kekal tidak menentu apabila risiko pelaksanaan dinilai.
Perbelanjaan $20 Bilion Isyarat Pengembangan Agresif
Tesla merancang untuk memperuntukkan kira-kira $20 bilion bagi peralatan baharu pada 2026, peningkatan ketara daripada kurang $9 bilion pada 2025. Yang penting, perbelanjaan Terafab adalah tambahan kepada angka ini, membayangkan komitmen perbelanjaan modal yang lebih besar.
Tahap pelaburan ini menonjolkan hasrat Tesla untuk menguasai komponen kritikal dalam rantaian bekalan AI, khususnya semikonduktor.
Namun, skala tersebut turut menimbulkan persoalan mengenai pembiayaan, peruntukan modal, serta potensi tekanan ke atas margin.
Sokongan pelabur yang berterusan berkemungkinan bergantung pada kejelasan tentang pembiayaan dan pulangan pelaburan.
Terafab Menyasarkan Skala Tanpa Tandingan
Konsep Terafab berteras pada skala melampau. Musk menyasarkan pengeluaran cip yang mampu menyokong permintaan pengkomputeran satu terawatt, bersamaan kira-kira satu bilion cip Nvidia Blackwell setahun.
Satu terawatt bersamaan satu trilion watt, menegaskan sejauh mana projek ini melangkaui keupayaan pembuatan semikonduktor semasa.
Exclusive: Tesla is looking to buy equipment worth $2.9 billion for manufacturing solar panels and cells from Chinese suppliers including Suzhou Maxwell Technologies, as CEO Elon Musk aims to add 100 gigawatts of solar capacity in the United States https://t.co/dNXIOUNyNa
Pengeluaran awal disasarkan pada lewat 2027, dengan output skala penuh pada 2028. Garis masa ini agresif, memandangkan kemudahan semikonduktor lazimnya memerlukan sekitar tiga tahun dari pembinaan hingga pengeluaran.
Kelewatan merupakan risiko utama. Sebarang lanjutan garis masa boleh menekan sentimen dan penilaian.
Integrasi AI Meluaskan Skop Strategik Tesla
Terafab bukan projek berdiri sendiri. Ia membentuk sebahagian daripada ekosistem lebih luas yang melibatkan Tesla, xAI, dan SpaceX, susulan integrasi yang lebih rapat awal tahun ini.
Struktur ini mencadangkan model integrasi menegak, di mana satu kumpulan mereka bentuk sistem AI, mengeluarkan cip, menggunakannya dalam kenderaan dan robotik, serta memproses data melalui infrastruktur satelit.
Musk menyatakan bahawa sekitar 80% output cip Terafab berpotensi digunakan di angkasa, dengan SpaceX mengendalikan pengkomputeran AI.
Elon Musk’s bold vision for putting AI data centers in space, tapping into solar power and bypassing terrestrial worries such as electric grids and neighbors’ opposition, hinges on SpaceX’s ability to perfect its Starship booster. https://t.co/Oa04P3752U
Visi ini melangkaui strategi semikonduktor tradisional kepada model infrastruktur AI yang sepenuhnya bersepadu.
Walaupun konsepnya luas, pelaksanaan merentas pelbagai industri menambah kerumitan yang mungkin mengambil masa bertahun-tahun untuk diselesaikan.
Analisis Teknikal
Tesla (TSLA) diniagakan sekitar 381.56, meningkat kira-kira 3.91% dalam sesi ini, menunjukkan lantunan jangka pendek selepas aliran menurun berpanjangan sejak kemuncak 498.75. Walaupun berlaku pemulihan, struktur yang lebih luas masih mencerminkan tekanan menurun yang berterusan.
Dari sudut teknikal, Tesla kekal di bawah semua purata pergerakan utama, mengukuhkan trend menurun dominan. MA 5 hari (384.52) berada sedikit di atas harga semasa dan semakin mendatar, manakala 10 hari (391.35), 20 hari (397.45), dan 30 hari (403.18) semuanya menurun dan tersusun di atas harga. Penjajaran ini menunjukkan rali berkemungkinan terus berdepan tekanan jualan melainkan strukturnya berubah.
Paras utama untuk diperhatikan:
Sokongan:375 → 360 → 340
Rintangan:385 → 390–400 → 430
Lantunan semasa menghampiri rintangan segera sekitar 384–390, iaitu kawasan tumpuan purata pergerakan jangka pendek. Kegagalan untuk menembusi dan bertahan di atas zon ini berkemungkinan mengukuhkan aliran menurun yang sedang berlaku. Di bahagian bawah, 375 bertindak sebagai sokongan jangka dekat, dengan penembusan berpotensi membuka ruang kelemahan lanjut ke arah 360.
Volum kekal relatif stabil tanpa lonjakan ketara minat belian, yang menunjukkan pergerakan ini mungkin lebih kepada lantunan teknikal berbanding pembalikan trend.
Secara keseluruhan, Tesla kelihatan cuba menstabilkan diri selepas kejatuhan berpanjangan, namun trend kekal menurun selagi harga tidak dapat mengambil semula rantau 390–400. Pergerakan berterusan di atas zon itu akan menjadi isyarat pertama potensi perubahan momentum, manakala penolakan boleh membawa kepada tekanan penurunan berterusan dalam sesi-sesi akan datang.
Perkara Seterusnya Yang Perlu Diperhatikan Pedagang
Fasa seterusnya Tesla bergantung pada pelaksanaan dan komunikasi. Faktor utama termasuk:
Perincian tentang pembiayaan dan garis masa Terafab
Kemas kini mengenai integrasi dengan xAI dan SpaceX
Trend permintaan yang lebih luas bagi infrastruktur AI
Prestasi dan margin teras EV Tesla
Buat masa ini, pasaran bertindak balas terhadap visi dan skala, namun kenaikan yang mampan berkemungkinan memerlukan bukti yang lebih jelas bahawa pelaksanaan mampu seiring dengan aspirasi.
Soalan Lazim (FAQ)
Mengapa Saham Tesla Naik Selepas Pengumuman Terafab? Tesla meningkat apabila pelabur memberi reaksi positif terhadap pelan kilang cip Terafab, melihatnya sebagai pemacu pertumbuhan jangka panjang dalam AI dan infrastruktur semikonduktor.
Apa itu Terafab? Terafab ialah cadangan kemudahan pembuatan semikonduktor yang disokong oleh Tesla, xAI dan SpaceX, dengan sasaran menghasilkan cip pada skala yang belum pernah berlaku untuk aplikasi AI.
Berapa Banyak Tesla Merancang Untuk Melabur? Tesla merancang untuk membelanjakan kira-kira $20 bilion bagi peralatan pada 2026, meningkat daripada kurang $9 bilion pada 2025, dengan kos Terafab sebagai tambahan di atas jumlah tersebut.
Bila Terafab Akan Mula Menghasilkan Cip? Pengeluaran awal disasarkan pada lewat 2027, dengan output skala penuh dijangka pada 2028, walaupun garis masa ini dianggap agresif.
Apa Yang Membezakan Terafab Daripada Projek Cip Lain? Projek ini menyasarkan untuk menyokong permintaan pengkomputeran satu terawatt, bersamaan kira-kira satu bilion cip Nvidia Blackwell setahun, jauh melebihi norma industri semasa.
Mula berdagang sekarang – Klik di sini untuk membuat akaun sebenar VT Markets
GBP/JPY pulih daripada penurunan intrahari ke 212.30–212.25 dan bergerak ke bahagian atas julat harian sebelum sesi Eropah pada Selasa. Ia kemudian terbantut berhampiran 212.65–212.70, hampir tidak berubah pada hari itu, ketika pasaran menantikan bacaan awal (flash) PMI UK.
PMI memberikan gambaran bulanan aktiviti dalam sektor perkilangan dan perkhidmatan UK. Ia digunakan untuk menilai keadaan ekonomi dalam persekitaran risiko rantaian bekalan yang dikaitkan dengan konflik di Timur Tengah.
Percanggahan BoE-BoJ Dan Inflasi Dipacu Perang
Sokongan kepada pound datang daripada jangkaan bahawa Bank of England boleh menaikkan kadar seawal April, susulan kebimbangan inflasi yang dikaitkan dengan perang Iran. Yen melemah selepas CPI Nasional turun ke paras terendah sejak Mac 2022, sekali gus mengurangkan jangkaan kenaikan kadar segera oleh Bank of Japan.
Harga tenaga yang lebih tinggi susulan perang turut dilihat sebagai faktor yang membebankan pertumbuhan Jepun dan yen. Potensi campur tangan pihak berkuasa Jepun disebut sebagai faktor yang mengehadkan kenaikan lanjut GBP/JPY.
Pasangan ini telah melantun daripada sokongan SMA 100 hari berhampiran 207.25, kali terakhir diuji pada Februari. Pergerakan berterusan melepasi 213.00 dirujuk sebagai pencetus berpotensi untuk kenaikan seterusnya.
Composite PMI S&P Global berada dalam julat 0 hingga 100, dengan 50.0 menunjukkan tiada perubahan bulanan. Bacaan melebihi 50 mencadangkan pengembangan, manakala di bawah 50 menunjukkan penguncupan.
Imbas Kembali Mac 2025
Mengimbas kembali analisis pada waktu yang sama tahun lalu, pada Mac 2025, sentimen menaik untuk GBP/JPY adalah kukuh ketika ia menghampiri kawasan 212.70. Kepercayaan teras ketika itu ialah Bank of England yang lebih “hawkish” akan terus menyimpang daripada Bank of Japan yang “dovish”. Pandangan ini banyak bergantung pada ketakutan inflasi yang berpunca daripada konflik Timur Tengah pada ketika itu.
Kita mengingati pendirian “hawkish” Bank of England pada awal 2025, yang sememangnya membawa kepada kenaikan kadar pada April tahun tersebut. Namun, inflasi sejak itu telah menyejuk dengan ketara, dengan angka CPI UK terkini bagi Februari 2026 menunjukkan penurunan kepada 2.5%, dan Composite PMI S&P Global melemah kepada 51.5, menandakan pertumbuhan yang perlahan. Peralihan ini mendorong pasaran mengambil kira potensi pemotongan kadar lewat tahun ini, sekali gus mengehadkan kenaikan pound.
Sebaliknya, situasi di Jepun telah berubah daripada kelemahan berterusan yang dilihat pada awal 2025. Dengan inflasi teras kekal di atas sasaran 2% selama lapan belas bulan berturut-turut, Bank of Japan akhirnya beralih hala, menaikkan kadar dasar kepada 0.1% pada suku lalu. Ini menandakan peralihan ketara berbanding jangkaan “dovish” tahun lalu.
Kebimbangan pada 2025 mengenai campur tangan pihak berkuasa Jepun terbukti berasas, apabila beberapa pusingan campur tangan berlaku pada separuh kedua tahun itu ketika pasangan silang hampir menguji paras 215.00. Lonjakan harga tenaga yang dipacu perang itu juga reda lebih pantas daripada jangkaan, sekali gus mengurangkan sumber tekanan utama ke atas ekonomi Jepun. Ini mewujudkan pasaran dua hala yang lebih stabil berbanding kecenderungan menaik sehala tahun lalu.
Buka akaun langsung VT Markets anda dan mula berdagang sekarang.
Mula berdagang sekarang – Klik di sini untuk membuat akaun sebenar VT Markets
Ekuiti global melantun semula selepas Presiden AS Donald Trump memberi isyarat bahawa rundingan telah bermula dan mengumumkan jeda lima hari dalam serangan ke atas aset tenaga Iran. Pasaran Eropah memadamkan kerugian awal, manakala indeks AS ditutup lebih tinggi.
Kenaikan kemudiannya menyusut selepas pegawai Iran berkata tiada rundingan berlaku. Namun begitu, S&P 500 ditutup naik 1.2%, Russell 2000 meningkat 2.3%, dan Stoxx 600 menokok 0.6%.
Rotasi Ke Arah Sektor Kitaran
Pergerakan ini diterajui saham kitaran, dengan segmen yang berkait pertumbuhan seperti teknologi dan pengguna diskresionari mengatasi prestasi apabila hasil bon menurun. Niaga hadapan kemudiannya merosot ke wilayah negatif pada pagi berikutnya.
Hartanah tidak pulih walaupun hasil lebih rendah dan kekal antara sektor paling lemah selepas minggu yang hambar. Barangan keperluan pengguna juga gagal melantun, selepas susut lebih besar berbanding perindustrian sepanjang sebulan lalu.
Pergerakan harga menunjukkan kebimbangan kemelesetan berkurang, manakala jangkaan inflasi dan kadar faedah berubah sedikit. Artikel itu menyifatkan reaksi pasaran sebagai pembalikan dagangan yang sebelum ini terkait dengan risiko geopolitik.
Laporan ini dihasilkan menggunakan alat AI dan disemak oleh seorang editor.
Pengajaran Daripada Buku Panduan 2025
Tahun lalu pada 2025, pasaran menunjukkan bagaimana ia bertindak balas apabila harapan penyusutan ketegangan antara AS dan Iran timbul, sekali gus mencetuskan lantunan mendadak. Dinamik serupa boleh berlaku dalam beberapa minggu akan datang, kerana sebarang petanda pelonggaran ketegangan geopolitik sering mencetuskan rotasi pantas dalam pasaran. Indeks Volatiliti CBOE (VIX), yang lazimnya melonjak ketika konflik, secara sejarahnya turun lebih 15-20% pada minggu selepas pengumuman penyusutan ketegangan, menandakan kembalinya selera risiko dengan cepat.
Berdasarkan buku panduan 2025, reaksi segera ialah rali dalam sektor pertumbuhan kitaran seperti teknologi dan pengguna diskresionari. Pedagang derivatif wajar mempertimbangkan pembelian opsyen panggilan (call) ke atas Nasdaq 100 atau ETF teknologi tertentu untuk menangkap potensi kenaikan ini. Data dagangan terkini sudah menunjukkan volum opsyen bagi Invesco QQQ Trust meningkat hampir 25% pada hari-hari dengan aliran berita diplomatik yang positif.
Sama penting ialah meneliti apa yang ketinggalan semasa rali kelegaan 2025 itu. Hartanah dan barangan keperluan pengguna jauh ketinggalan, menandakan pasaran masih bimbang tentang inflasi dan kadar faedah. Dengan Indeks Harga Pengguna (CPI) teras terkini masih degil di atas sasaran bank pusat pada 3.1%, sektor-sektor ini kekal terdedah kepada kebimbangan kadar yang berpanjangan.
Mula berdagang sekarang – Klik di sini untuk membuat akaun sebenar VT Markets
AUD/USD jatuh ke sekitar 0.6980 pada awal dagangan Eropah pada Selasa, susut 0.45% pada hari tersebut dan di bawah 0.7000. Pergerakan ini menyusul peningkatan ketegangan di Timur Tengah, dengan AS menangguhkan tarikh akhir untuk Iran membuka semula Selat Hormuz selama lima hari.
AS berkata ia telah mengadakan “perbualan produktif” dengan Tehran, manakala Iran mengatakan tiada sebarang dialog. Risiko konflik AS-Iran yang berterusan boleh menyokong Dolar AS dan menekan AUD/USD.
Keputusan Kadar Australia Dan Reaksi Awal Pasaran
Di Australia, Reserve Bank of Australia (RBA) menaikkan Kadar Tunai Rasmi sebanyak 25 mata asas kepada 4.10% pada mesyuarat Mac. Ini merupakan kenaikan kedua berturut-turut tahun ini, selepas peningkatan 25 mata asas pada Februari.
Pada carta harian, harga susut dari kawasan 0.71 dan kini berada di bawah Jalur Bollinger pertengahan 20 hari berhampiran 0.7070. Jalur Bollinger semakin mendatar dan menyempit, manakala RSI berada pada pertengahan paras 40, di bawah garisan tengah.
Rintangan berada pada 0.7065, kemudian 0.7100, dengan 0.7150 di atasnya. Sokongan berada pada 0.6920, kemudian 0.6880, dengan EMA 100 hari berhampiran 0.6860, dan 0.6800 lebih rendah.
Mula berdagang sekarang – Klik di sini untuk membuat akaun sebenar VT Markets