Pasukan strategi FX global Scotiabank melaporkan pengukuhan luas Dolar AS, dengan pergerakan mata wang G10 kembali kepada corak yang dilihat pada peringkat awal konflik AS/Iran. Mereka menyifatkan sentimen risiko sebagai rapuh ketika pasaran menilai kemungkinan konflik berpanjangan, perubahan haluan bank pusat, serta penetapan semula (repricing) mendadak dalam hasil bon.
Laporan itu memetik serangan ke atas medan gas utama Iran dan kemudahan eksport LNG utama Qatar, sekali gus meningkatkan kebimbangan mengenai konflik yang menjadi lebih panjang serta tempoh pembaikan yang berlarutan. Hasil bon meningkat sejak beberapa hari kebelakangan ini, dengan pergerakan besar di UK, susulan sikap berhati-hati Fed, pendirian ECB yang hawkish, dan pusingan-U agresif oleh Bank of England.
Kekuatan Dolar Dan Peralihan Dasar
Bagi Rizab Persekutuan, jangkaan pelonggaran semakin pudar, dengan niaga hadapan fed funds meletakkan harga bagi perubahan dasar yang sangat kecil sama ada menaik atau menurun hingga September 2027. Dalam komoditi, harga minyak menunjukkan perbezaan, dengan WTI stabil sekitar pertengahan $90 setong manakala Brent melonjak menghampiri $100 setong apabila ketegangan kembali memuncak.
Kita melihat Dolar AS mengukuh secara meluas, didorong oleh konflik yang semakin memuncak dan peralihan yang jelas dalam dasar bank pusat. Indeks Dolar (DXY) telah menembusi 107.50, paras yang tidak kita lihat kekal sejak ketidaktentuan pasaran hujung 2025. Persekitaran ini memihak kepada strategi seperti membeli opsyen panggilan (call options) ke atas dolar atau kontrak niaga hadapan yang bertaruh pada kenaikan berterusan berbanding mata wang G10 lain.
Dengan sentimen risiko yang begitu rapuh, kami melihat peluang pada volatiliti itu sendiri. Indeks VIX, ukuran ketakutan pasaran, melonjak melepasi 22 minggu ini, peningkatan ketara daripada purata 15 pada suku terakhir 2025. Memandangkan niaga hadapan fed funds kini meletakkan harga bagi peluang perubahan kadar yang sangat kecil, pedagang boleh menggunakan opsyen seperti straddle pada indeks saham utama untuk meraih keuntungan daripada ayunan pasaran yang besar ke mana-mana arah.
Perbezaan harga minyak membuka peluang dagangan spread yang jelas untuk beberapa minggu akan datang. Premium minyak mentah Brent berbanding WTI telah melebar melebihi $5 setong, mencerminkan risiko geopolitik secara langsung terhadap bekalan global susulan serangan terbaru. Kami percaya pedagang wajar mempertimbangkan strategi long niaga hadapan Brent sambil short kontrak WTI untuk memanfaatkan kemungkinan spread ini melebar lagi jika ketegangan kekal tinggi.
Risiko Ekuiti Dan Lindung Nilai
Persekitaran dolar yang kukuh dan hasil yang telah ditetapkan semula dari segi sejarah mencabar untuk pasaran ekuiti, mengingatkan kita kepada penurunan semasa kitaran kenaikan kadar pada 2025. Sehubungan itu, pembelian opsyen jual (put options) pada indeks utama seperti S&P 500 menawarkan cara langsung untuk melindung nilai portfolio. Kedudukan ini boleh melindungi daripada potensi penurunan dalam jangka terdekat ketika pasaran menghadam risiko yang bertindih ini.
Mula berdagang sekarang – Klik di sini untuk membuat akaun sebenar VT Markets
Dolar Kanada sedikit lebih kukuh berbanding dolar AS dan mendahului mata wang G10 yang lain. Ini menyusuli prestasi mengatasi pasaran yang dilihat lebih awal semasa fasa awal konflik AS/Iran.
Pengecilan perbezaan hasil (yield spreads) disebut sebagai faktor utama. Mesyuarat Bank of Canada yang mencetuskan reaksi pasaran yang terhad turut dikaitkan dengan pergerakan tersebut.
Pasaran menilai kira-kira 60 mata asas (bps) pengetatan Bank of Canada menjelang hujung tahun. Sangat sedikit yang dinilai untuk dua mesyuarat seterusnya, yang menyebabkan mata wang itu terdedah kepada penetapan semula harga jika jangkaan dasar berubah.
Anggaran nilai saksama diletakkan pada awal paras 1.34, iaitu 1.3413, sejajar dengan pergerakan terkini dalam perbezaan hasil. USDCAD digambarkan gagal menembusi di atas julat setempat yang ditetapkan pada akhir Januari, dengan rintangan pada pertengahan 1.37.
Artikel itu menyatakan ia dihasilkan menggunakan alat kecerdasan buatan dan disemak oleh seorang editor. Ia juga menerangkan FXStreet Insights sebagai pasukan wartawan yang memilih pemerhatian pasaran dan menambah analisis daripada penyumbang dalaman dan luaran.
Dolar Kanada menunjukkan kekuatan ketara berbanding dolar AS, yang kami lihat sebagai isyarat untuk membuat posisi bagi penurunan lanjut USDCAD. Kekuatan ini disokong oleh pengecilan perbezaan kadar faedah antara Kanada dan Amerika Syarikat. Pasaran kini menjangkakan Bank of Canada akan menaikkan kadar kira-kira 0.60% sebelum akhir tahun.
Bagi menyokong pandangan ini, kami melihat bacaan CPI terkini Kanada bagi Februari 2026 pada 2.9%, sedikit di atas konsensus 2.7% dan mengukuhkan hujah untuk Bank of Canada yang lebih hawkish. Selain itu, harga minyak mentah WTI kekal kukuh di atas AS$85 setong, menyediakan latar sokongan kepada dolar Kanada yang berkait komoditi (loonie). Faktor-faktor ini mengukuhkan kepercayaan kami bahawa nilai saksama bagi USDCAD pada masa ini lebih hampir kepada paras 1.34.
Bagi pedagang derivatif, kegagalan berulang USDCAD untuk menembusi di atas pertengahan 1.37 memberikan peluang yang jelas. Kami percaya menjual opsyen panggilan (call) USDCAD dengan harga mogok (strike) sekitar 1.3750 atau 1.3800 bagi tempoh luput April dan Mei 2026 adalah strategi yang menarik. Ini membolehkan pedagang mengutip premium dengan bertaruh bahawa siling rintangan kukuh ini akan kekal dalam jangka terdekat.
Kami mengingati susun atur yang serupa pada suku ketiga 2025 apabila pengecilan perbezaan hasil turut mengehadkan kenaikan USDCAD dengan ketara. Dalam tempoh itu, pasangan ini berundur daripada paras yang hampir sama selama beberapa minggu. Preseden sejarah ini mencadangkan persekitaran semasa adalah positif untuk strategi yang mendapat manfaat daripada penurunan atau pergerakan mendatar kadar pertukaran USDCAD.
Mula berdagang sekarang – Klik di sini untuk membuat akaun sebenar VT Markets
EUR/GBP meningkat pada Jumaat selepas merosot sehari sebelumnya susulan keputusan dasar Bank Pusat Eropah (ECB) dan Bank of England (BoE). Ia didagangkan berhampiran 0.8647 dan kekal dalam julat sempit yang dilihat selama lebih seminggu.
Kedua-dua bank pusat mengekalkan kadar tidak berubah pada Khamis, dengan ECB pada 2% dan BoE pada 3.75%. Risiko inflasi dikaitkan dengan kenaikan harga minyak dan tenaga susulan perang AS-Israel dengan Iran.
Pendirian Dasar Dan Tinjauan Pertumbuhan
ECB berkata ia tidak terikat kepada laluan kadar yang ditetapkan dan akan mendasarkan keputusan pada risiko inflasi serta tinjauan. Unjurannya menunjukkan pertumbuhan 2026 pada 0.9% dalam senario asas, 0.6% dalam senario buruk, dan 0.4% dalam senario teruk.
Bagi 2026, ECB menjangka inflasi pada 2.6% dalam senario asas, 3.5% dalam senario buruk, dan 4.4% dalam senario teruk. BoE menaikkan pandangan inflasinya, dengan CPI purata sekitar 3% pada S2 2026, meningkat daripada 2.1% pada Februari.
Pasaran sepenuhnya mengambil kira kenaikan kadar ECB menjelang Julai dan satu lagi menjelang akhir tahun, dengan sebahagian turut menilai kemungkinan seawal April. Bagi BoE, pasaran menilai lebih daripada dua kenaikan tahun ini, dengan kira-kira 50% kebarangkalian kenaikan pada April.
Imbas Kembali Ke 2025
Mengimbas kembali 2025, kita dapat melihat pasaran terikat pada perlumbaan antara ECB dan BoE untuk menaikkan kadar di tengah kejutan tenaga yang besar. Silang EUR/GBP terperangkap dalam julat sempit sekitar 0.8650 apabila pedagang menilai bank pusat mana yang akan dipaksa bertindak lebih agresif. Ketidaktentuan ini mewujudkan ketegangan yang ketara dalam pasangan mata wang tersebut.
Laluan yang diambil sejak itu kini menjadi jauh lebih jelas. ECB sememangnya melaksanakan beberapa kenaikan kadar sepanjang 2025, membawa kadar utamanya ke 3.25%, dan anggaran pantas Eurostat bagi inflasi Februari 2026 kini telah menurun kepada 2.4%, jauh lebih hampir kepada sasaran. Ini mengesahkan pendekatan ECB yang ‘front-loaded’ dari tahun lalu.
Sebaliknya, UK mengalami kesan kejutan stagflasi yang lebih mendalam. BoE menaikkan kadar banknya kepada 4.75%, namun data CPI terkini daripada Office for National Statistics masih menunjukkan inflasi kekal tinggi pada 3.1%, manakala pertumbuhan KDNK S4 2025 disahkan pada -0.2%. Ekonomi UK kini membayar harga lebih tinggi dari segi pertumbuhan yang lebih lemah.
Perbezaan ini telah menolak EUR/GBP naik ke arah 0.8870, jauh di atas julat sempit tahun lalu. Dengan ECB kini dilihat mempunyai lebih banyak fleksibiliti dasar berbanding BoE, aliran menaik pada silang ini dilihat berpotensi berterusan. Kami percaya BoE berada dalam keadaan tersepit, tidak mampu menurunkan kadar berikutan inflasi tetapi teragak-agak untuk menaikkan lagi kerana ekonomi yang lemah.
Memandangkan tinjauan ini, kita wajar mempertimbangkan pembelian opsyen panggilan (call) EUR/GBP dengan harga strike melebihi 0.8900 untuk memanfaatkan potensi kenaikan selanjutnya. Volatiliti tersirat bagi pasangan ini telah menurun daripada paras tertinggi 2025, menjadikan opsyen relatif lebih murah ketika ini. Strategi ini membolehkan kita mendapat manfaat daripada kekuatan euro yang berterusan sambil menetapkan had risiko.
Kita juga boleh meneliti dagangan berasaskan volatiliti. Walaupun volatiliti keseluruhan lebih rendah, sebarang kejutan negatif daripada data ekonomi UK boleh mencetuskan lonjakan mendadak dalam pergerakan pound. Oleh itu, kita perlu berhati-hati untuk tidak menjual volatiliti GBP dan sebaliknya mempertimbangkan struktur yang mendapat manfaat daripada kenaikan beransur-ansur yang stabil dalam EUR/GBP.
Mula berdagang sekarang – Klik di sini untuk membuat akaun sebenar VT Markets
Christopher Waller berkata beliau bersedia untuk tidak bersetuju (dissent) hanya berdasarkan laporan pekerjaan, namun inflasi sejak itu menjadi kebimbangan yang lebih besar. Beliau berkata kini menjangkakan pertumbuhan tenaga buruh hampir sifar.
Beliau berkata pertumbuhan tenaga buruh hampir sifar mengubah paras pulang modal (breakeven) bagi pertumbuhan pekerjaan. Beliau menambah bahawa pertumbuhan pekerjaan sifar mungkin yang mengekalkan kadar pengangguran stabil, walaupun ia tidak kelihatan “normal”.
Harga Minyak Dan Inflasi Teras
Waller berkata jika minyak kekal tinggi selama berbulan-bulan, ia boleh meresap ke dalam inflasi teras. Beliau berkata kejutan minyak yang tinggi dan berterusan bukanlah sementara, dan ia tidak boleh diabaikan, maka pendekatan berhati-hati adalah wajar.
Beliau berkata mahu menunggu dan melihat bagaimana keadaan berkembang sebelum memutuskan mengenai pemotongan kadar faedah lewat tahun ini. Beliau juga berkata tidak berpendapat ada keperluan untuk mempertimbangkan kenaikan kadar faedah.
Waller berkata inflasi struktur mungkin hampir 2% sekarang, tetapi tarif mengekalkannya lebih tinggi. Beliau berkata jika kesan tarif tidak berundur menjelang separuh kedua tahun ini, keadaan akan menjadi rumit, walaupun penetapan harga pasaran belum menunjukkan jangkaan yang tidak lagi berlabuh (de-anchoring).
Beliau berkata harga petrol yang lebih tinggi boleh menjejaskan prospek pengguna, dan beberapa kejutan boleh mendorong firma mengurangkan tenaga kerja. Beliau juga berkata tiada sebab untuk menjadikan rizab bank terhad semata-mata untuk mengecilkan kunci kira-kira, dan cadangan mengenai permintaan rizab serta pengecilan kunci kira-kira wajar dikaji dan dibincangkan.
Implikasi Untuk Pasaran Dan Pedagang
Nampaknya haluan seterusnya adalah dalam mod menunggu, apabila inflasi kembali menjadi kebimbangan utama. Walaupun kami tidak menjangkakan kenaikan kadar faedah menjadi pilihan, prospek pemotongan kadar lewat tahun ini semakin pudar. Kita perlu menunggu dan melihat bagaimana data berkembang sebelum membuat sebarang keputusan dasar yang besar.
Laporan CPI Februari 2026 yang terkini, pada 3.4%, mengesahkan pendirian berhati-hati ini dan menyukarkan justifikasi untuk melonggarkan dasar. Dengan minyak mentah WTI kekal degil sekitar AS$95 setong berikutan ketegangan geopolitik yang berterusan, terdapat risiko nyata kos tenaga yang tinggi ini akan mula menolak naik inflasi teras. Kejutan minyak yang berlarutan seperti ini tidak boleh kita abaikan begitu sahaja.
Pandangan kami terhadap pasaran buruh juga berubah, kerana kami kini menjangkakan pertumbuhan tenaga buruh hampir sifar. Ini mengubah kiraan, bermakna walaupun laporan pekerjaan mendatar mungkin memadai untuk memastikan kadar pengangguran stabil pada paras semasa 3.8%. Ini menjadikan angka pekerjaan bulanan sebagai penunjuk yang jauh lebih sensitif terhadap potensi inflasi gaji.
Kami sedang mencapai sedikit kemajuan pada inflasi asas, tetapi apabila menoleh semula kepada keadaan pada 2025, jelas tarif daripada Akta Pemodenan Perdagangan (Trade Modernization Act) mengekalkan harga pada paras tinggi secara buatan. Jika tarif ini tidak berundur menjelang separuh kedua tahun ini seperti dijangka, ia akan mewujudkan situasi yang rumit. Jangkaan pasaran bahawa inflasi akan turun sangat bergantung pada andaian ini.
Mula berdagang sekarang – Klik di sini untuk membuat akaun sebenar VT Markets
Niaga hadapan E-Mini Dow Jones susut beberapa hari menjelang triple witching. Satu kawasan sokongan jangka pendek yang berpotensi ialah 45,780, iaitu pivot low dari Disember 2025.
Pivot low ialah titik di mana harga sebelum ini kembali meningkat selepas menguji sokongan. Apabila diuji semula, ia boleh bertindak sebagai sokongan sekali lagi dan berpotensi mencetuskan lantunan.
Paras Sokongan Utama Pada 45780
Jika 45,780 gagal bertahan, kawasan sokongan seterusnya adalah sekitar 45,286. Paras ini sepadan dengan pivot high terdahulu yang kemudian bertindak sebagai sokongan, dan ia berada di sepanjang trendline yang ditandai oleh pivot low yang lebih awal.
Ini membentuk corak rintangan-bertukar-sokongan, apabila siling lama menjadi lantai. Kawasan 45,286 menggabungkan beberapa titik rujukan teknikal, yang boleh menarik pembeli atau mencetuskan pembelian semula untuk menutup posisi jual (short covering).
Triple witching boleh meningkatkan volatiliti kerana opsyen, niaga hadapan dan kontrak indeks tamat tempoh pada masa yang sama. Ini boleh menggerakkan harga dengan lebih ketara ke mana-mana arah di sekitar paras seperti 45,780 dan 45,286.
Dengan tamat tempoh triple witching kini sudah berlalu, kita melihat pasaran menguji zon sokongan kritikal sekitar 45,780. Paras ini penting kerana ia menandakan pivot low dari Disember 2025, iaitu titik di mana pembeli sebelum ini masuk dengan kuat. Tekanan terkini hadir selepas laporan CPI Februari menunjukkan inflasi pada 3.4%, sedikit melebihi jangkaan dan mengekalkan Rizab Persekutuan dalam keadaan berjaga-jaga.
Pertimbangan Strategi Selepas Tamat Tempoh
Bagi pedagang derivatif, paras 45,780 ini memberikan peluang untuk menjual opsyen put mingguan dengan strike sekitar 45,500, mengutip premium berdasarkan jangkaan wujudnya lantai jangka pendek. Strategi ini mendapat manfaat daripada lantunan harga serta volatiliti yang tinggi, yang kita lihat meningkat apabila VIX naik ke 18.5 minggu lalu. Sebagai alternatif, membeli opsyen call jangka pendek boleh menjadi cara berisiko lebih rendah untuk memanfaatkan potensi lantunan pantas.
Jika penjual menolak pasaran menembusi paras pertama itu, kita melihat 45,286 sebagai kawasan yang lebih signifikan untuk menambah pendedahan posisi panjang. Zon ini merupakan contoh klasik rintangan terdahulu pada lewat 2025 yang kini bertindak sebagai lantai sokongan, diperkukuh oleh trendline menaik. Bacaan Philadelphia Fed Manufacturing Index yang lemah baru-baru ini menguatkan naratif bahawa jika pasaran jatuh sejauh ini, pembeli ketika susut (dip-buyers) mungkin melihatnya sebagai cadangan nilai yang lebih baik.
Buka akaun langsung VT Markets anda dan mula berdagang sekarang.
Mula berdagang sekarang – Klik di sini untuk membuat akaun sebenar VT Markets
GBP/USD jatuh pada Jumaat dan didagangkan berhampiran 1.3380 ketika laporan ini ditulis, susut 0.39% pada hari tersebut. Kejatuhan itu menyusuli lantunan kukuh pada Khamis selepas keputusan Bank of England.
Pergerakan lebih rendah berlaku apabila Dolar AS kembali mengukuh sedikit, walaupun pasaran lebih luas dipengaruhi oleh penetapan harga yang lebih ketat terhadap dasar monetari global. Ini mencetuskan penarikan balik pembetulan dalam pasangan tersebut.
Bank Of England Kekalkan Kadar
Bank of England mengekalkan kadar dasar tidak berubah pada 3.75%, selari dengan jangkaan. Namun, undian adalah sebulat suara 9-0 untuk kekal, berbanding ramalan perpecahan 7-2.
Keputusan terbaharu ini berbeza dengan keputusan hampir seimbang 5-4 sebelum ini. Bank menyatakan ia boleh bertindak jika inflasi kekal berterusan.
Implikasi Dagangan Untuk Sterling
Memandangkan perbezaan antara harapan pasaran terhadap pemotongan kadar dan sikap berhati-hati BoE yang kekal tegas, turun naik pound berkemungkinan meningkat. Pedagang derivatif boleh mempertimbangkan pembelian straddle atau strangle GBP/USD dengan tempoh luput dalam dua hingga tiga bulan akan datang bagi meraih manfaat daripada pergerakan harga yang ketara sekitar laporan inflasi dan mesyuarat BoE yang akan datang. Pasaran niaga hadapan kini menilai sekurang-kurangnya dua pemotongan kadar menjelang akhir tahun, pandangan yang kelihatan terlalu optimistik berdasarkan komen bank pusat.
Ini berbeza dengan situasi di Amerika Syarikat, di mana inflasi teras telah menurun dengan lebih meyakinkan kepada 2.5%, memberikan Rizab Persekutuan laluan yang lebih jelas untuk mula melonggarkan dasar. Percanggahan dasar ini sepatutnya menyediakan paras sokongan untuk pound berbanding dolar, menjadikan strategi bullish berisiko terhad lebih menarik. Oleh itu, pengambilan posisi melalui bull call spread GBP/USD boleh menjadi pendekatan berhemat untuk memanfaatkan potensi pengukuhan sterling jika BoE terus mengekalkan kadar lebih lama berbanding Fed.
Mula berdagang sekarang – Klik di sini untuk membuat akaun sebenar VT Markets
USD/JPY didagangkan berhampiran 158.70 pada Jumaat, meningkat 0.61% pada hari tersebut, melantun semula selepas kejatuhan mendadak pada Khamis. Pergerakan itu menyusuli pengukuhan Dolar AS selepas turun naik kebelakangan ini serta penilaian semula terhadap jangkaan dasar AS.
Dolar AS disokong oleh penetapan harga untuk tempoh jeda Rizab Persekutuan (Fed) yang lebih panjang. Fed mengekalkan kadar dalam julat 3.50%–3.75%, menyatakan ketidakpastian yang tinggi berkait ketegangan geopolitik, dan semakin kurang pegawai yang kini menjangkakan pemotongan kadar tahun ini.
Prospek Dasar Rizab Persekutuan
Bacaan CME FedWatch menunjukkan pasaran secara umumnya menjangkakan kadar kekal tidak berubah hingga hujung tahun. Indeks Dolar AS (DXY) turut melantun semula ke arah 99.50.
Tekanan pasaran tenaga dan ketegangan di Timur Tengah dikaitkan dengan permintaan yang lebih tinggi terhadap kecairan, yang menyokong Dolar. Kenaikan harga minyak turut dikaitkan dengan sokongan tambahan kepada Dolar AS.
Di Jepun, Bank of Japan (BoJ) mengekalkan pendirian hawkish, yang mengehadkan tekanan ke atas Yen. Gabenor Kazuo Ueda berkata kenaikan kadar masih berkemungkinan jika sebarang kelembapan yang dikaitkan dengan ketegangan Timur Tengah adalah bersifat sementara.
BoJ juga merujuk kepada ketidakpastian terhadap pertumbuhan susulan kenaikan kos tenaga. Ketegangan geopolitik yang melibatkan AS, Israel dan Iran terus mendorong pengelakan risiko, yang boleh menyokong Yen, walaupun jangkaan dasar AS mendominasi dalam tempoh terdekat.
Perbezaan Kadar Dan Kedudukan Pasaran
Kita melihat perbezaan kadar faedah antara AS dan Jepun menentukan hala tuju USD/JPY, menolaknya ke arah paras 159.00. Komitmen Rizab Persekutuan untuk mengekalkan kadar pada tahap tinggi merupakan pemacu utama di sebalik kekuatan dolar. Keadaan ini menunjukkan bahawa strategi menjual ketika penurunan (sell the dips) bagi pasangan ini kekal berdaya maju buat masa ini.
Kes untuk dolar yang kukuh disokong oleh data ekonomi yang mantap, yang kita lihat secara konsisten sepanjang tahun lalu. Sebagai contoh, laporan gaji bukan perladangan (non-farm payrolls) terkini bagi Februari 2026 menunjukkan pertambahan kukuh sebanyak 250,000 pekerjaan, manakala inflasi teras kekal degil pada 3.1%, jauh di atas sasaran Fed. Ketahanan ekonomi ini memberi Fed tiada sebab untuk mempertimbangkan pemotongan kadar, yang sepatutnya mengekalkan tekanan menaik ke atas pasangan ini.
Di pihak lain, kita perlu memantau Bank of Japan, yang telah memberi isyarat potensi kenaikan, satu perubahan besar sejak ia menamatkan kadar faedah negatif pada awal 2024. Inflasi teras Jepun sendiri bertahan sekitar 2.2%, memberikan bank pusat justifikasi untuk akhirnya mengetatkan dasarnya. Ancaman campur tangan inilah yang berkemungkinan menghalang pergerakan yang lebih meletup melepasi 160.00, paras yang pernah mencetuskan campur tangan sebelum ini.
Memandangkan kuasa yang bertentangan ini, pedagang opsyen wajar mempertimbangkan strategi yang mendapat manfaat daripada peningkatan volatiliti. Ketidakpastian geopolitik di Timur Tengah, digabungkan dengan harga minyak mentah WTI yang kekal kukuh sekitar $92 setong, sedang mewujudkan persekitaran yang sukar diramal. Membeli straddle atau strangle boleh menjadi cara berkesan untuk memanfaatkan potensi pergerakan mendadak ke mana-mana arah dalam beberapa minggu akan datang.
Mula berdagang sekarang – Klik di sini untuk membuat akaun sebenar VT Markets
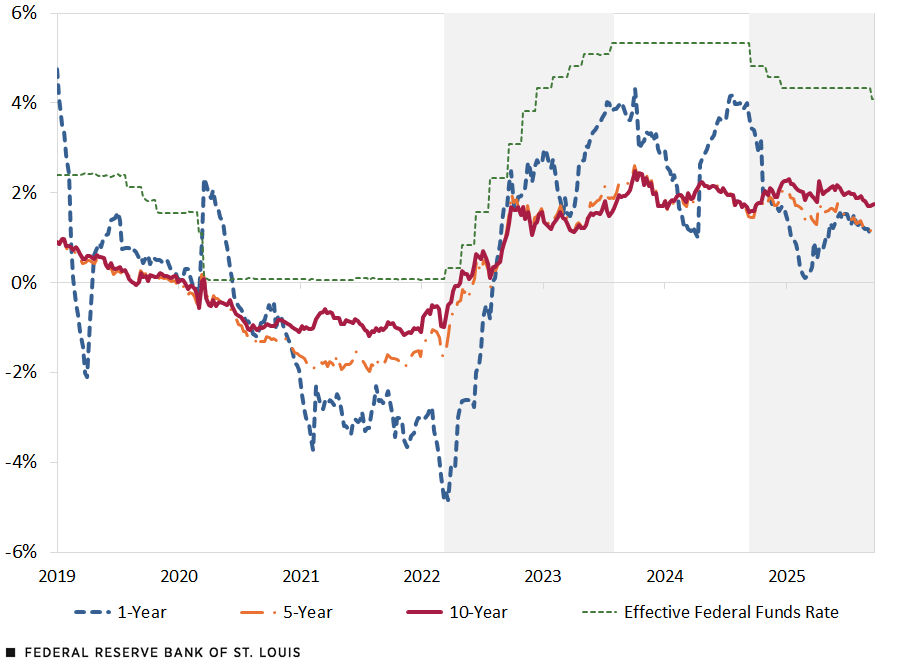
Kadar gadai janji didorong terutamanya oleh hasil Perbendaharaan AS, dengan tenor 10 tahun bertindak sebagai penanda aras utama dan bukannya kadar dasar Fed.
Pendirian Fed yang berhati-hati terhadap pemotongan kadar pada 2026, di tengah inflasi yang berterusan dan risiko dipacu tenaga, mengekalkan hasil jangka panjang—dan kadar gadai janji—pada paras tinggi.
Kadar gadai janji berperanan sebagai penunjuk awal bagi keadaan kewangan, mempengaruhi permintaan perumahan, perbelanjaan pengguna dan sentimen pasaran yang lebih luas.
Fed tidak menetapkan kadar gadai janji
Kadar gadai janji sering disalahfaham seolah-olah dikawal secara langsung oleh Rizab Persekutuan. Hakikatnya, hubungan itu bersifat tidak langsung dan dimediasi melalui pasaran kewangan.
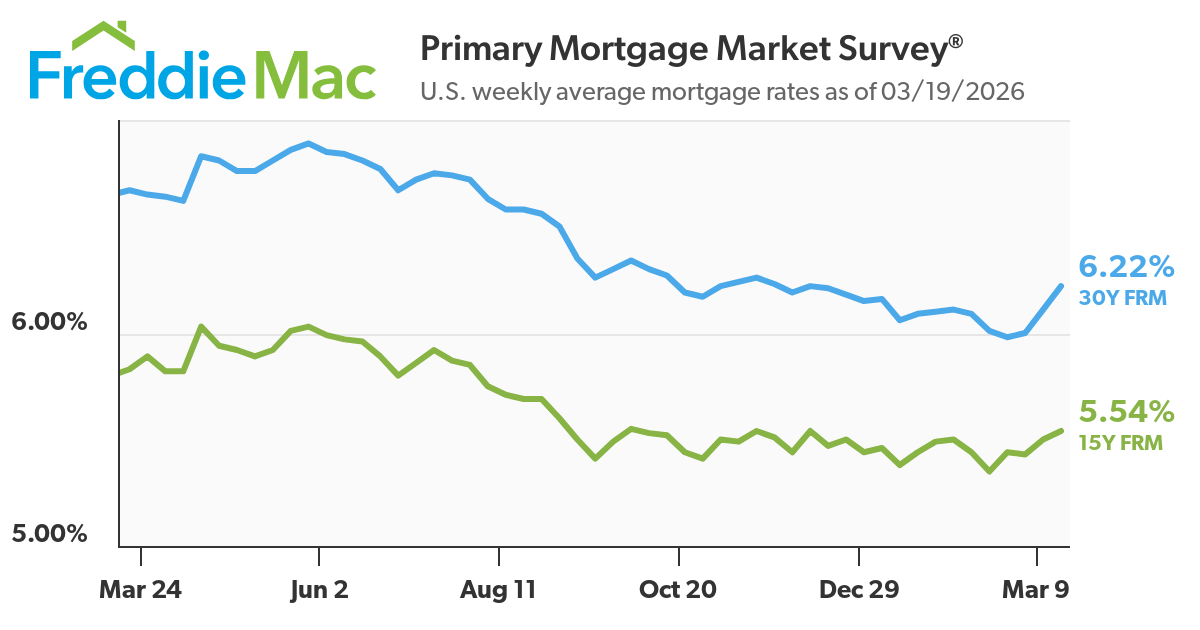
Setakat awal 2026, purata kadar gadai janji tetap AS 30 tahun berlegar sedikit di atas paras 6%—meningkat kepada sekitar 6.1% pada pertengahan Mac selepas seketika turun di bawah 6% pada Februari. Pergerakan ini bukan berpunca daripada perubahan kadar dasar Fed yang kekal tidak berubah, sebaliknya didorong oleh perubahan hasil bon dan jangkaan pasaran.
Mortgage rates rose for a third week, reaching a three-month high as wartime inflation fears drove up yields for the government bonds that guide home loans https://t.co/p7pXZwdBsL
Bagi pedagang, pembezaan ini penting. Kadar gadai janji bukan alat dasar; ia ialah harga modal jangka panjang yang ditentukan pasaran, mencerminkan jangkaan inflasi, prospek pertumbuhan dan premium risiko.
Tidak pasti tentang bon? Pelajari mengenainya di sini.
Pautan Utama: Hasil Perbendaharaan dan Kadar Gadai Janji
Kadar gadai janji menjejaki hasil Perbendaharaan AS 10 tahun kerana kedua-duanya mewakili kos pinjaman jangka panjang.
Secara sejarah, jurang antara kadar gadai janji 30 tahun dan hasil 10 tahun berada sekitar 150 hingga 300 mata asas, bergantung pada keadaan pasaran.
Contohnya:
Jika hasil 10 tahun sekitar 4.2%, kadar gadai janji mungkin dinilai sekitar 6.0%–6.5%
Semasa tempoh tekanan (cth. kitaran pengetatan 2022–2023), jurang melebar berikutan volatiliti dan penilaian semula risiko
SUMBER: Bloomberg dan FRED (Federal Reserve Economic Data).
NOTA: Data mingguan berdasarkan sekuriti Perbendaharaan terlindung inflasi. Data diperoleh pada 24 Sept. 2025.
Pemacu utama hubungan ini termasuk:
Jangkaan inflasi Jangkaan inflasi yang lebih tinggi menolak hasil ke atas, sekali gus menaikkan kadar gadai janji.
Premium tempoh Pelabur menuntut pampasan untuk memegang bon berdurasi panjang dalam persekitaran yang tidak menentu.
Volatiliti pasaran Dalam keadaan tidak stabil, pemberi pinjaman melebarkan jurang, meningkatkan kadar gadai janji melebihi apa yang dicadangkan oleh hasil semata-mata.
Bagi pedagang, ini menjadikan pasaran bon isyarat utama untuk diperhatikan. Baca tentang bagaimana kecairan mempengaruhi pergerakan pasaran bon dan struktur geopolitik di sini.
Mengapa Fed Masih Penting
Rizab Persekutuan mungkin tidak menetapkan kadar gadai janji, tetapi ia sememangnya membentuknya.
Fed menambat jangkaan mengenai inflasi, pertumbuhan dan dasar masa depan. Jangkaan tersebut mengalir terus ke pasaran bon, khususnya hasil Perbendaharaan AS 10 tahun, yang merupakan penanda aras utama bagi penentuan harga gadai janji.
Pada 2026, pendirian Fed telah mengalih pasaran daripada pelonggaran agresif kepada prospek yang lebih berhati-hati. Peralihan itu sahaja sudah memadai untuk mengekalkan kos pinjaman pada paras tinggi.
Apa yang Fed Isyaratkan pada 2026
Pemotongan kadar bergantung pada data Fed menjelaskan bahawa pelonggaran bergantung pada kemajuan inflasi yang berterusan, bukan ramalan semata-mata.
Kebimbangan inflasi yang berterusan Inflasi teras—terutamanya dalam perkhidmatan—kekal degil, mengehadkan ruang untuk pemotongan kadar yang pantas.
Kepekaan terhadap harga tenaga Kenaikan harga minyak dan risiko geopolitik mempengaruhi jangkaan inflasi, mengekalkan tekanan ke atas hasil.
Bagaimana Ini Mengalir ke Dalam Kadar Gadai Janji
Jangkaan pemotongan kadar yang tertangguh Pasaran menilai semula daripada beberapa kali pemotongan kepada laluan yang lebih perlahan. Ini mengekalkan hasil 10 tahun tinggi sekitar ~4.1%–4.3%.
Naratif “lebih tinggi untuk lebih lama” Walaupun tanpa kenaikan, ketiadaan pemotongan mengekalkan keadaan kewangan ketat dan kos pinjaman tinggi.
Pengetatan kuantitatif (QT) Fed meneruskan pengecilan kunci kira-kira, mengurangkan permintaan untuk Perbendaharaan dan sekuriti bersandarkan gadai janji—lalu menolak hasil lebih tinggi.
Apa yang Ditunjukkan Data
Hasil Perbendaharaan AS 10 tahun kekal di atas 4% dalam beberapa minggu kebelakangan ini
Kadar gadai janji tetap 30 tahun melantun semula kepada sekitar ~6.1% pada Mac, selepas turun di bawah 6% pada Februari
Jurang antara hasil dan kadar gadai janji kekal tinggi, mencerminkan risiko dan volatiliti pasaran
Mengapa Ini Penting untuk Pasaran
Nada Fed menggerakkan hasil—walaupun tanpa tindakan Peralihan komunikasi yang lebih hawkish boleh menolak hasil lebih tinggi serta-merta.
Kadar gadai janji mengikut jangkaan, bukan keputusan Pasaran menilai dasar masa depan, bukan kadar semasa.
Perumahan menjadi saluran transmisi Kadar gadai janji yang lebih tinggi mengetatkan keadaan kewangan, memberi kesan kepada penggunaan dan pertumbuhan.
Kadar Gadai Janji sebagai Isyarat Makro
Kadar gadai janji berfungsi sebagai penunjuk masa nyata bagi keadaan kewangan.
Apabila kadar meningkat:
Kemampuan memiliki rumah merosot Bayaran bulanan meningkat dengan ketara. Kenaikan 1% pada kadar gadai janji boleh meningkatkan bayaran bulanan ratusan dolar bagi pinjaman standard.
Jumlah transaksi perlahan Jualan rumah sedia ada dan permohonan gadai janji lazimnya menurun.
“Kesan kunci kadar” (rate lock-in effect) semakin ketara Pemilik rumah yang memegang gadai janji bawah 3% daripada tahun-tahun sebelumnya enggan menjual, seterusnya mengetatkan bekalan.
Apabila kadar menurun:
Aktiviti pembiayaan semula meningkat
Permintaan pembeli rumah bertambah baik
Sektor berkaitan perumahan stabil
Sebagai contoh, pada awal 2026, apabila kadar seketika turun di bawah 6%, jualan rumah yang masih dalam proses (pending home sales) mencatat lantunan sederhana, menonjolkan betapa sensitifnya permintaan perumahan walaupun terhadap pergerakan kadar yang kecil.
Sales of newly built homes in January dropped 17.6% month over month to a seasonally adjusted, annualized pace of 587,000 units, according to the U.S. Census Bureau. That is the slowest pace since 2022.
Penilaian semula jangkaan Fed Pasaran beralih daripada menjangka beberapa kali pemotongan kepada kitaran pelonggaran yang lebih beransur-ansur, sekali gus menyokong hasil yang lebih tinggi.
Permintaan perumahan bersifat struktur Walaupun kos pinjaman lebih tinggi, permintaan demografi dan bekalan rumah yang terhad menghalang pasaran daripada merosot secara mendadak.
Premium tempoh yang meningkat Pelabur menuntut pampasan lebih tinggi untuk memegang hutang jangka panjang di tengah ketidakpastian fiskal dan penerbitan kerajaan yang besar.
Secara keseluruhan, faktor-faktor ini menjelaskan mengapa kadar gadai janji kekal relatif tinggi walaupun tiada kenaikan kadar baharu.
Apa yang Pedagang Patut Pantau
Untuk menjangka pergerakan kadar gadai janji, pedagang perlu memantau gabungan penunjuk makro dan pasaran:
Hasil Perbendaharaan AS 10 tahun (pemacu utama) Pergerakan berterusan melepasi paras penting (cth. 4.2%–4.5%) lazimnya membawa kepada kadar gadai janji yang lebih tinggi.
Data inflasi (CPI, PCE) Kejutan menaik lazimnya menolak hasil lebih tinggi dan melengahkan pemotongan kadar.
Komunikasi Rizab Persekutuan Perubahan nada, khususnya mengenai inflasi atau pasaran buruh, boleh menilai semula jangkaan dengan pantas.
Terbitan data perumahan Permohonan gadai janji, permit pembinaan dan jualan rumah memberikan isyarat permintaan masa nyata.
Harga minyak dan tenaga Kos tenaga yang meningkat boleh mempengaruhi jangkaan inflasi, secara tidak langsung menaikkan hasil.
Kesimpulan
Kadar gadai janji paling tepat difahami sebagai cerminan pasaran bon, bukannya hasil langsung dasar Rizab Persekutuan.
Pada 2026, gabungan inflasi yang berterusan, pemesejan bank pusat yang berhati-hati dan premium tempoh yang tinggi mengekalkan kos pinjaman pada paras relatif tinggi. Bagi pedagang, kadar gadai janji menawarkan lensa berguna terhadap keadaan kewangan: menghubungkan jangkaan dasar, tingkah laku pengguna dan sentimen pasaran.
Memahami hubungan ini penting untuk menavigasi kedua-dua trend perumahan dan pergerakan pasaran yang didorong faktor makro yang lebih luas.
Intipati Pedagang
Adakah kadar gadai janji mengikut kadar Rizab Persekutuan?
Tidak secara langsung. Kadar gadai janji lebih berkait rapat dengan hasil Perbendaharaan jangka panjang, walaupun dasar Fed mempengaruhi hasil tersebut melalui jangkaan.
Mengapa kadar gadai janji naik walaupun Fed berhenti seketika?
Kerana hasil bon meningkat akibat kebimbangan inflasi dan perubahan jangkaan terhadap pemotongan kadar pada masa hadapan.
Apakah jurang antara hasil Perbendaharaan dan kadar gadai janji?
Kebiasaannya antara 150 hingga 300 mata asas, bergantung pada keadaan pasaran dan faktor risiko.
Adakah kadar gadai janji akan turun jika Fed memotong kadar?
Tidak semestinya. Kadar gadai janji hanya akan turun dengan ketara jika hasil jangka panjang menurun, yang bergantung pada jangkaan inflasi dan pertumbuhan.
Mula berdagang sekarang – Klik di sini untuk membuat akaun sebenar VT Markets
Indeks Harga Rumah Baharu Kanada susut 2.1% tahun ke tahun pada Februari.
Ini berbanding penurunan 2.3% tahun ke tahun dalam bacaan sebelumnya.
Pasaran Perumahan Menemui Paras Dasar
Data harga rumah baharu bagi Februari menunjukkan penyusutan tahun ke tahun memperlahankan kepada -2.1%, satu penambahbaikan berbanding bacaan sebelumnya. Ini merupakan isyarat paling jelas setakat ini bahawa pembetulan pasaran perumahan yang kita alami sepanjang 2025 sedang mencari titik dasar. Kita kini wajar membuat penyesuaian kedudukan bagi perubahan sentimen Bank of Canada, kerana tekanan untuk pemotongan kadar faedah yang lebih mendalam berkemungkinan berkurang.
Penstabilan perumahan ini mencadangkan volatiliti kadar faedah mungkin menurun, dengan bank pusat berpotensi mengekalkan kadar dasar tidak berubah sepanjang suku akan datang. Kita telah melihat pasaran niaga hadapan sudah mengurangkan kebarangkalian pemotongan kadar pada Mei, dan data ini akan mengukuhkan trend tersebut. Justeru, kita patut mempertimbangkan strategi yang mendapat manfaat daripada persekitaran hasil jangka pendek yang stabil atau sedikit meningkat.
Bagi pedagang pertukaran asing, pendirian Bank of Canada yang kurang dovish mengukuhkan dolar Kanada, khususnya berbanding dolar AS. Kita boleh menjangkakan pasangan CAD/USD memperoleh semula sokongan, terutama kerana ia kekal stabil walaupun kelemahan harga minyak kebelakangan ini. Membeli opsyen panggilan (call) ke atas CAD bagi suku kedua kelihatan sebagai dagangan dengan nisbah risiko-ganjaran yang menarik.
Data ini jelas positif untuk ekuiti kewangan dan hartanah Kanada yang telah berada di bawah tekanan. Kita patut meneliti pembelian opsyen panggilan (call) ke atas bank-bank utama Kanada dan beberapa REIT kediaman terpilih, kerana pasaran perumahan yang stabil secara langsung memperbaiki prospek pendapatan mereka. Volatiliti tersirat bagi nama-nama ini relatif tertekan, menawarkan titik kemasukan yang menarik untuk posisi bullish.
Sokongan fundamental bagi pembentukan paras dasar perumahan semakin kukuh, dengan angka imigresen S4 2025 daripada Statistics Canada menunjukkan pertumbuhan populasi terus jauh mengatasi penawaran perumahan. Kita melihat corak yang sama dalam pasaran 2023, apabila penyusutan harga yang semakin perlahan menjadi petunjuk awal kepada reli dalam aset sensitif perumahan. Preseden sejarah ini menunjukkan pasaran semasa mengikuti skrip pemulihan yang biasa.
Kedudukan Untuk Suku Akan Datang
Mula berdagang sekarang – Klik di sini untuk membuat akaun sebenar VT Markets
Indeks Harga Perumahan Baharu Canada meningkat sebanyak 0.3% bulan ke bulan pada Februari. Ramalan sebelum ini adalah penurunan 0.3%.
Ini merupakan perbezaan 0.6 mata peratusan berbanding jangkaan. Data ini dilaporkan secara bulan ke bulan.
Angka perumahan yang secara mengejut ini kukuh mencabar pandangan bahawa Bank of Canada akan menurunkan kadar faedah dalam masa terdekat. Kita melihat penetapan semula harga serta-merta dalam derivatif yang menjejaki jangkaan kadar faedah, seperti niaga hadapan Canadian Overnight Repo Rate Average. Pedagang perlu menjangkakan pertaruhan terhadap penurunan kadar sebelum musim panas 2026 akan cepat dileraikan.
Data ini sepatutnya memberikan sokongan kukuh kepada dolar Kanada, khususnya berbanding dolar AS. Jika menoleh semula ke 2025, kita melihat CAD melemah apabila ekonomi kita menunjukkan tanda-tanda perlahan lebih pantas berbanding A.S. Kini, dengan pasaran swap berkemungkinan menyingkirkan sekurang-kurangnya satu penurunan kadar penuh untuk tahun ini daripada harga, kita wajar mempertimbangkan untuk membeli opsyen panggilan CAD atau menjual niaga hadapan USD/CAD bagi memposisikan diri untuk pengukuhan “loonie”.
Mula berdagang sekarang – Klik di sini untuk membuat akaun sebenar VT Markets