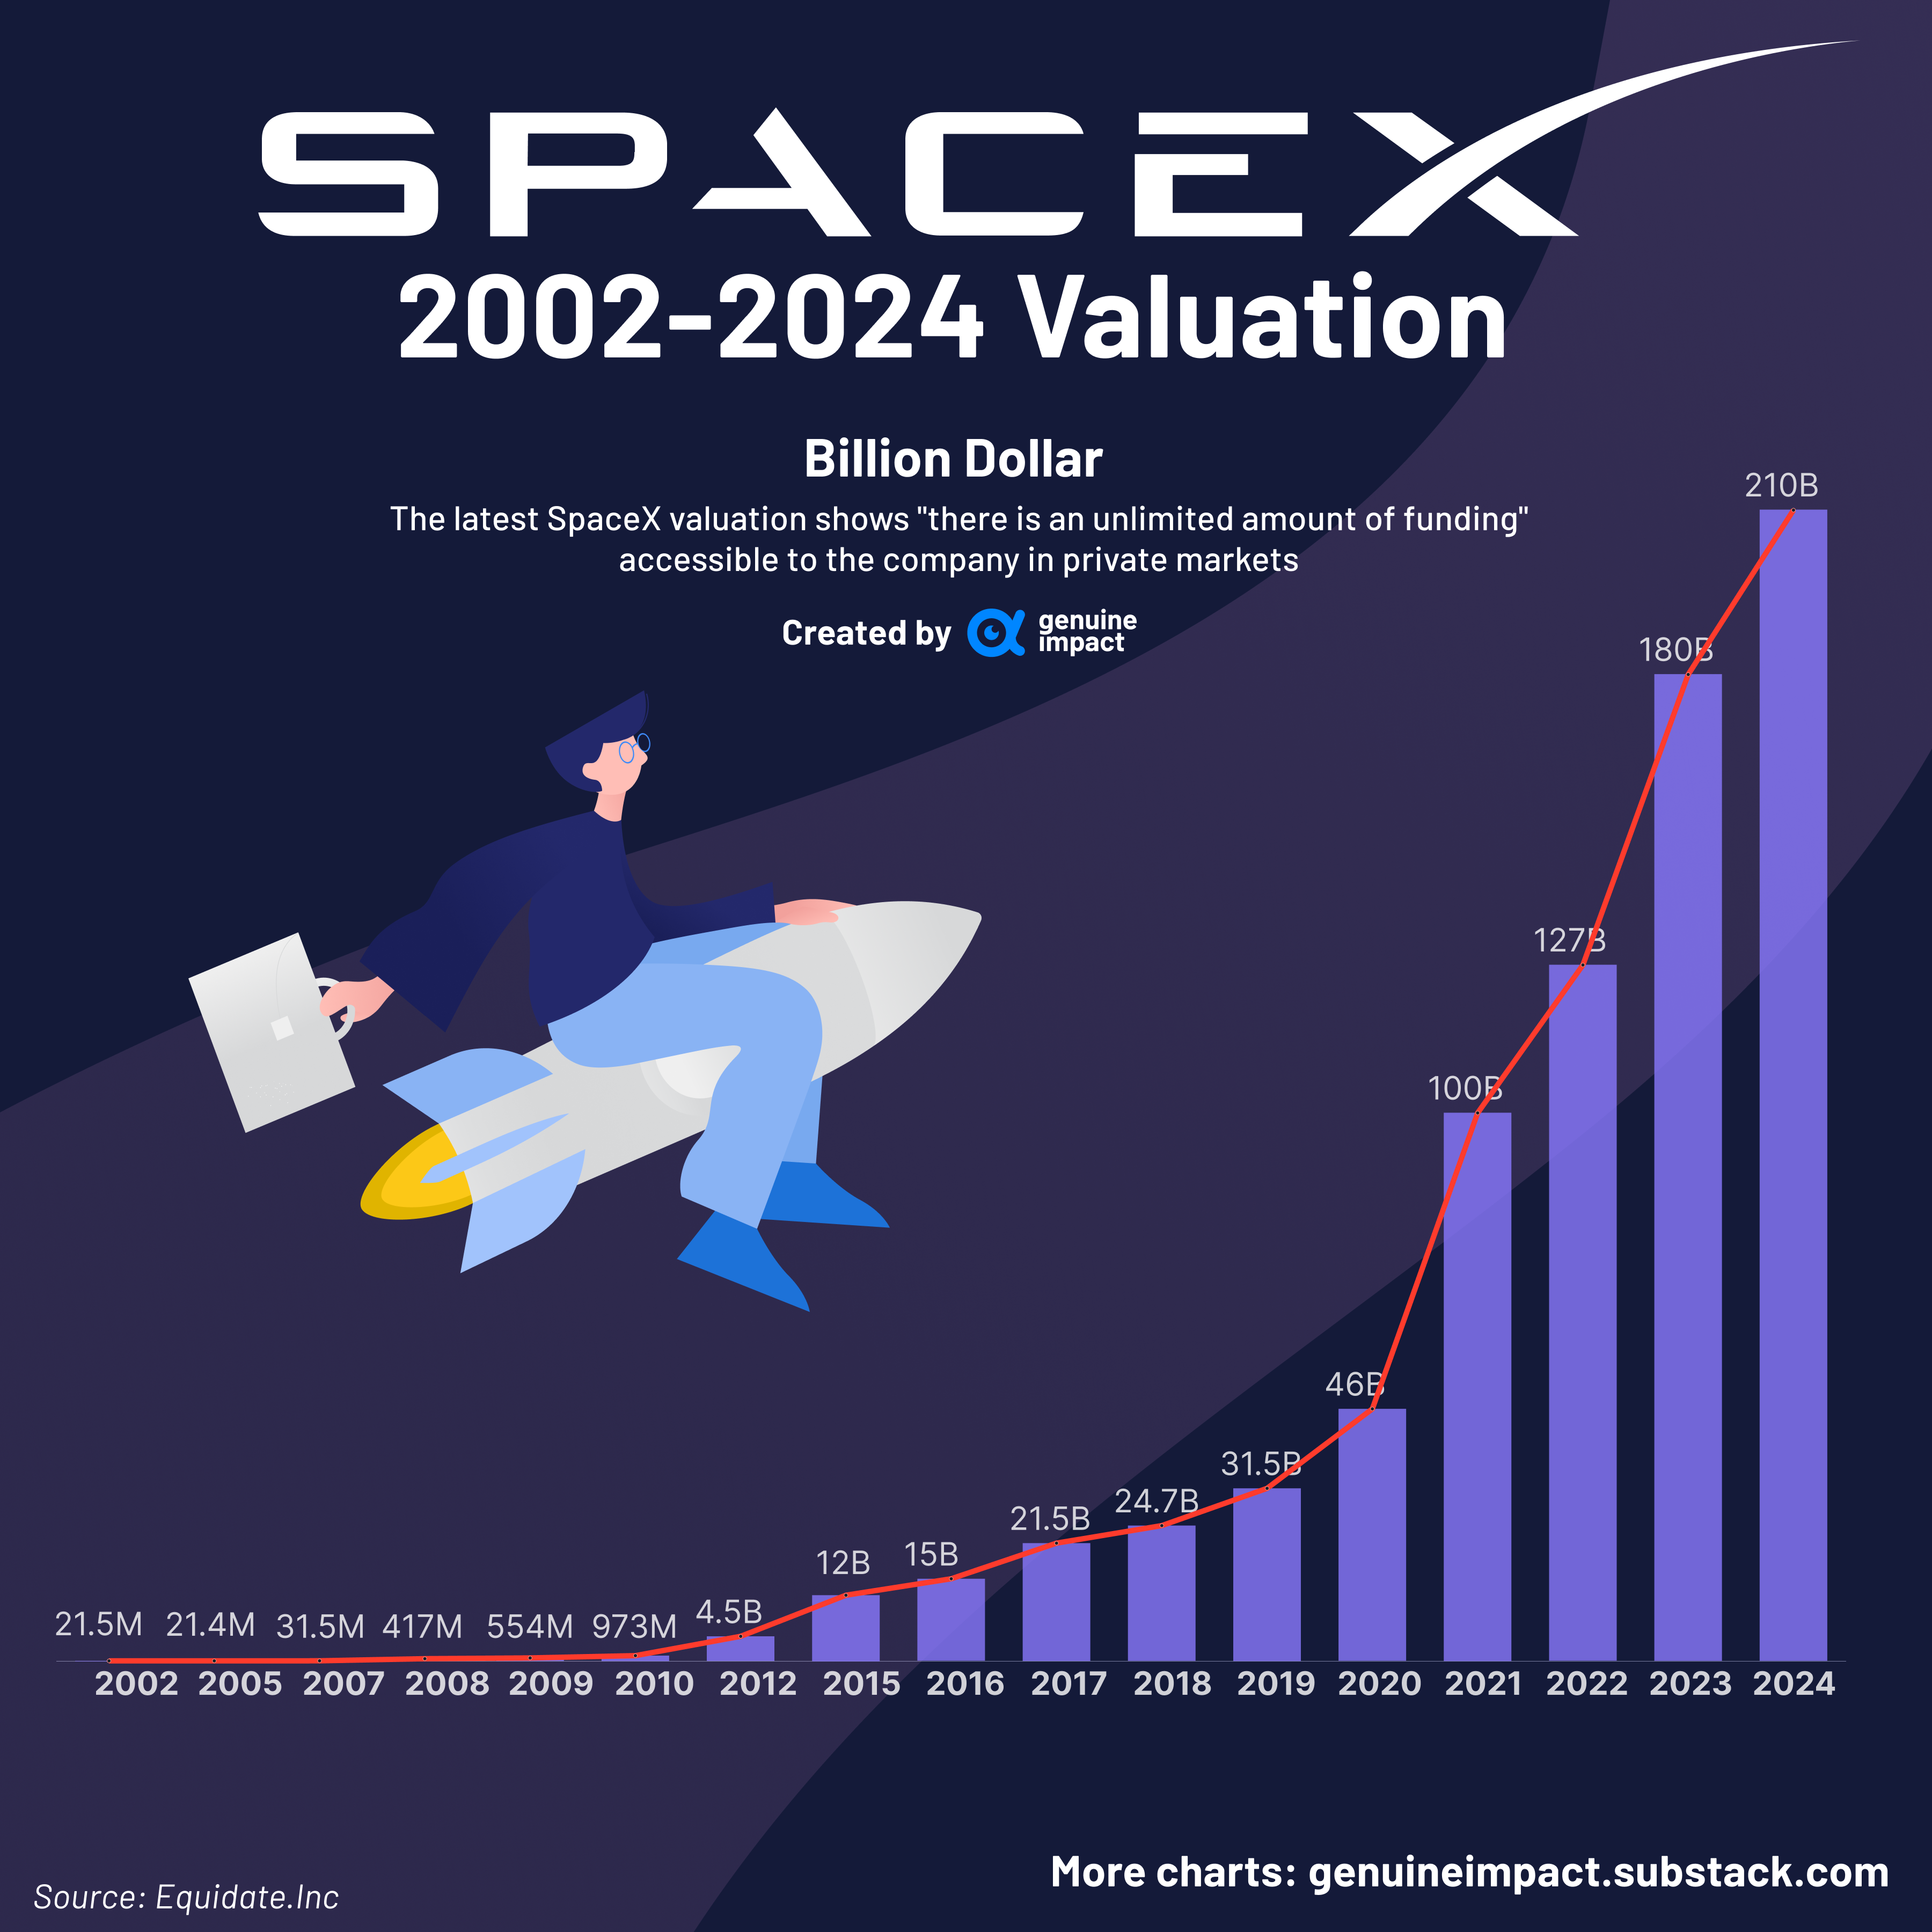
随着SpaceX估值与影响力快速上升,市场对SpaceX IPO的兴趣也升温。作为全球最有价值的私人公司(privately held company,指股权由创办人、员工与私募投资者持有、未在交易所买卖)之一,SpaceX处在多个热门主题的交汇点——太空探索、卫星基础设施(指卫星网络与地面站等“硬体+系统”)、下一代科技。
SpaceX is aiming to file its initial public offering prospectus with regulators later this week or next week, The Information reported, citing a person with direct knowledge of the plans https://t.co/ZUOEpEYYRVpic.twitter.com/VtU9SiDhYf
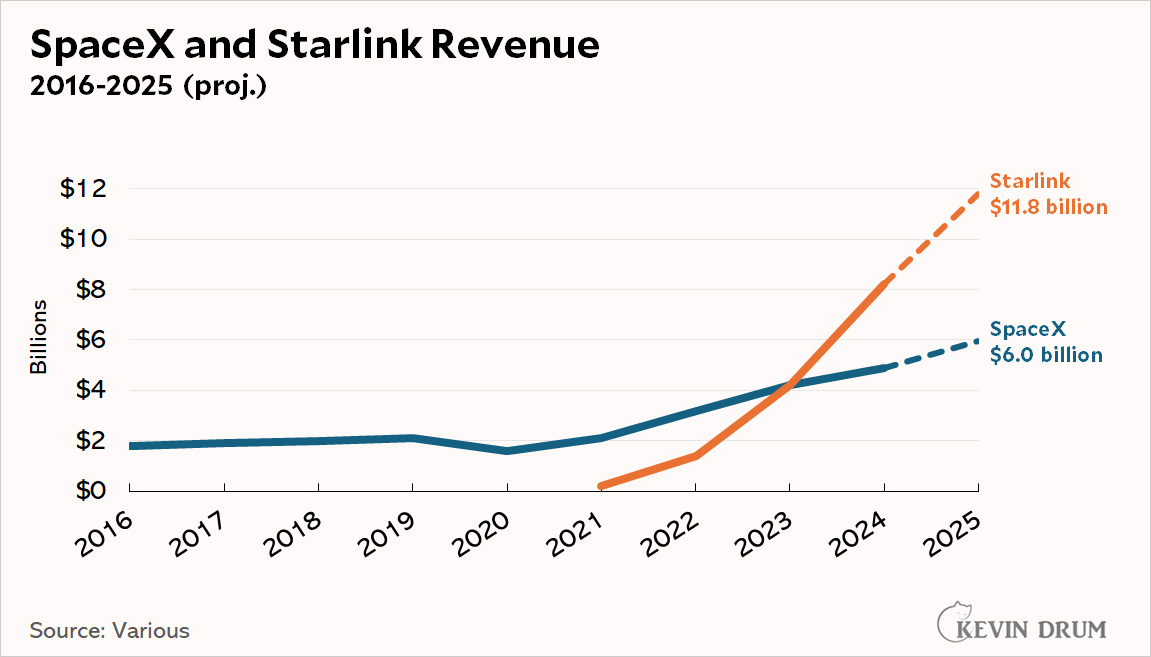
Starlink已不只是概念项目。根据其2025年进度报告,公司表示当年新增超过460万名活跃用户,并把服务扩展到额外35个国家与地区;同时也表示“Direct to Cell”(手机直连卫星服务,指手机在无地面讯号处可直接连接卫星)已在美国与纽西兰商业化上线,由超过400颗卫星组成的卫星群(constellation,指大量卫星组成的网络)提供支持。
AST SpaceMobile launched its largest-ever satellite from India, the first in a series of deployments to help the company compete against Elon Musk’s SpaceX in delivering space-based connectivity to mobile phones https://t.co/mzhCJLXRDc
美国堪萨斯城联邦储备银行(Kansas City Federal Reserve,简称“堪萨斯城联储”)的制造业活动指数在3月升至11,上一次读数为10。
堪萨斯城联储制造业指数报11,略高于市场预期的10,说明该地区制造业活动正在扩大,力度比预期略强。单独来看,这个数据对市场的直接影响不算大,但与“经济仍具韧性”(即增长没有明显转弱)的整体趋势一致。
对美联储政策的含义
这项数据公布的时间点较敏感,尤其是在最新美国消费者物价指数(CPI,衡量一篮子商品与服务价格变化的通胀指标)显示通胀仍偏“黏性”(即通胀下降速度慢、容易反复)并维持在2.9%之后。它让美国联邦储备委员会(Federal Reserve,简称“美联储”,负责制定利率等货币政策)更有理由延后降息。因此,未来几周应更谨慎对待那些依赖短期利率下跌的交易仓位(短期利率通常指1-2年以内的利率水平,对融资成本与估值影响较大)。
2024年下半年也出现过类似情况:经济数据持续稳健,使降息时间表一再后移。当时美国2年期国债收益率(2-year Treasury yield,反映市场对未来两年利率与通胀预期的关键指标)稳在约4.2%,对成长股(主要依靠未来盈利增长、对利率更敏感的股票)形成压力。若市场开始降低对年中降息的押注,短端债券收益率(front-end bond yields,指短期限债券的收益率,如2年期及更短)可能再次承压走高(即收益率上行)。
就股票指数衍生品(equity index derivatives,以股指为标的的合约,如期货与期权)而言,这带来偏复杂的信号:利率担忧仍在,可能限制上行空间。在这份数据未显示经济出现重大冲击的情况下,隐含波动率(implied volatility,期权价格反推的未来波动预期)可能继续缓慢下行。这样的环境更可能有利于卖出期权时间价值(selling premium,卖方通过收取权利金获利,但承担价格大幅波动风险),例如在SPX(标普500指数期权标的)上使用“铁秃鹰策略”(iron condor,同时卖出看涨与看跌价差组合,适用于区间震荡行情),以捕捉区间盘整带来的收益。