重点
标普500下跌1.74% ,指数期货正尝试反弹。特朗普把行动推迟10天 ,短期风险情绪缓和。
美债收益率与能源价格走高,继续推升滞胀担忧 (经济放慢但物价仍上涨)。
周五美国股指期货小幅走高,标普500在上一交易日下跌1.74%后 尝试止跌。
此前主要指数遭遇抛售,道琼斯指数跌1.01%,纳斯达克指数跌2.38% ,科技股走弱是主要拖累。
盘中美国国债收益率走高,压低股票估值,尤其影响成长板块(更看重未来利润的公司)。
由于收益率上行与宏观风险仍在,反弹可能不稳。
地缘局势延后带来短暂喘息
市场情绪获得一定缓解,因为美国总统特朗普把可能针对伊朗能源设施的打击期限延后10天 。
这意味着谈判仍在继续,短期升级风险下降。
此外,特朗普称伊朗允许10艘油轮通过霍尔木兹海峡
不过,伊朗已拒绝美国的15点方案 ,并提出自身条件,包括对海峡通行的掌控权,使紧张局势仍未解决。
若缺乏局势降温的明确信号,纾困式反弹可能难持久。
收益率与能源价格上扬,加深滞胀担忧
市场的整体反应反映出对滞胀的担心升温。
能源价格大涨推高通胀预期;同时美国国债收益率走高,让融资环境更紧(借钱成本更高)。
这对股市不利:一方面折现率上升(用来把未来利润换算成今天价值的利率),另一方面也威胁经济增长。
对利率变化更敏感的科技股在上一交易日领跌。
若收益率持续走高,股市反弹空间可能受限,尤其是对利率敏感的板块。
技术面显示下行压力仍在
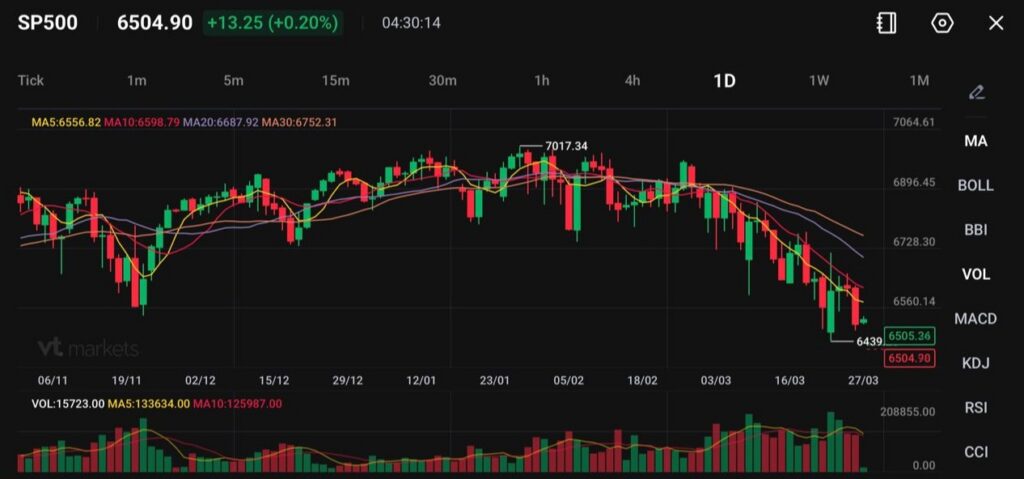
标普500(SP500) 现约在6505 附近交易,前一波急跌把价格打到约6439低点 后,正尝试小幅反弹。整体形态已从横盘整理转为短期明确下跌趋势 ,目前反弹更像技术性回抽,而非新一轮强势上攻。
趋势结构与动能
价格已跌破所有关键移动平均线 (均线:用过去一段时间的平均价格来观察趋势):
MA5:6556 MA10:6598 MA20:6687 MA30:6752
各条均线已向下倾斜并形成偏空排列 (短期均线在下、长期均线在上),显示下行压力持续。近期K线出现更低的高点与更低的低点 ,属于典型的延续下跌走势。
当前反弹正在测试短期均线下方,特别是MA5与MA10区间(6550–6600) ,该区域现更像动态阻力 (会随时间变化的阻力位)。
下跌时成交量放大,反弹时成交量回落,说明买盘仍偏谨慎 。
关键价位
近端阻力: 6550 → 6600更强阻力: 6685 → 6750支撑: 6439 → 6400跌破关键位: 6400以下,可能打开6300区间
6439低点 是短期重要支撑。若有效跌破,跌势可能加快。
上行方面,价格需先站回6600 ,随后收复6685(MA20附近) ,市场情绪才可能回到偏中性。
价格行为观察
此前从7017高点 回落后,走势出现结构转变 。原本的横盘已转为派发 (大资金在高位逐步卖出),随后出现跌破。
近期反弹特征包括:
这更像空头回抽 (下跌后的反弹),而非趋势反转。
接下来观察重点
关注价格在6550–6600 的表现:
若在此遇阻回落: 可能继续下探6439,甚至测试6400若突破并站稳6600: 可能出现空头回补推动的上冲(空头回补:做空者买回平仓)至6685
同时留意:
美国国债收益率 (收益率越高,通常越压抑股市估值)美元指数(USDX)强弱 (美元走强往往不利风险资产,如股票)
谨慎看法
短线在6600下方 仍偏空,反弹可能遭遇卖压。只有价格收复并站稳20日均线(约6685) ,动能才可能转强。否则,结构仍偏向高点下移 ,支撑区将持续承压。
交易者接下来该关注什么
市场仍受地缘政治与宏观因素牵引,重点包括:
美伊谈判进展
美国国债收益率变化
油价是否稳定,以及霍尔木兹海峡的供应运输是否顺畅
科技股表现
目前标普500正尝试企稳,但“地缘风险缓和”与“融资环境收紧”之间的拉锯仍很关键。
常见问题(FAQs) 为什么标普500最近大跌?
标普500下跌1.74% ,主要受美国国债收益率上升、油价走高,以及滞胀担忧升温影响。
是什么带动美国股指期货反弹?
期货走高,原因之一是特朗普把可能针对伊朗的行动推迟10天 ,短期地缘政治担忧下降。
油价上涨如何影响美国股市?
油价上涨会推高通胀风险,增加企业成本,也可能让央行维持较紧的政策(例如较高利率)。
为什么美国国债收益率对股市重要?
收益率上升会抬高借贷成本,并降低未来盈利的“现值”(把未来利润折算到今天的价值),从而压低股价估值。
为什么科技股跌幅更大?
科技股对利率更敏感,因此当收益率走高时,板块更容易出现更强的抛售。
什么是滞胀风险?为什么重要?
滞胀是“经济增长放慢 + 通胀上升”的组合,对股市和央行决策都更棘手。
这波反弹能持续吗?
若收益率无法稳定、地缘紧张不降温,反弹可能不稳。
立即开始交易 – 点击这里 创建您的 VT Markets 真实账户