On Monday, the U.K. markets were closed for a bank holiday, while U.S. markets were closed for Memorial Day. European stocks had a turbulent week, with the Stoxx 600 index hitting an eight-week low but recovering some losses on Friday due to a rally in tech stocks, driven by Nvidia’s impressive results.
In the U.S., political leaders are working to secure bipartisan support for the debt ceiling bill in Congress before the June 5 deadline to prevent a federal default. The U.S. House of Representatives could vote on the bill as early as Wednesday, followed by the Senate later in the week. Market concerns are expected to ease if the debt ceiling deal is approved, allowing investors to shift their focus to the economic outlook and interest rates.
The Federal Reserve, European Central Bank, and Bank of England were anticipated to pause rate hikes and assess when to change direction, but recent data has complicated the situation for all three institutions. In Asia-Pacific markets, there was a mixed performance, with Japan’s Nikkei 225 reaching its highest levels since July 1990.
Over the weekend, President Joe Biden and House Majority Leader Kevin McCarthy reached an agreement to raise the debt ceiling and avoid a default. The legislation will be voted on by Congress as early as Wednesday. Both Republican and Democratic support is crucial for the bill to pass. The agreement came just before the “X date” on June 5, which was the earliest potential default date signalled by the Treasury Department. The prolonged negotiations between the White House and congressional leaders had concerned investors, who were already dealing with inflation and a banking crisis.
Investors will also focus on May jobs data to be released on Friday, as well as the April Job Openings and Labor Turnover Survey from the Bureau of Labor Statistics on Wednesday. Additionally, corporate earnings from HP Inc. and Salesforce are expected on Tuesday and Wednesday, respectively.
Major Pair Movement
On Monday, the US markets remained closed in observance of Memorial Day, resulting in a subdued atmosphere in the currency market. With limited trading activity, volatility was relatively low. The Dollar Index managed to register a slight rise of 0.05%, indicating a modest strengthening of the US dollar compared to a basket of other major currencies.
Among the currency pairs, the EURUSD experienced a slight decrease of 0.08%, reflecting a slight weakening of the euro against the US dollar. Surprisingly, the GBPUSD pair showed a rise of 0.13%, despite the closure of the UK market. This suggests that market participants may have responded to other factors, such as economic news or geopolitical developments. Meanwhile, the USDJPY pair saw a minor decline of 0.10%, signaling a marginal decrease in the value of the US dollar compared to the Japanese yen. Conversely, the AUDUSD pair demonstrated an upward movement, rising by 0.26%, indicating a relative strengthening of the Australian dollar against its US counterpart.
In terms of commodities, gold remained relatively stable, exhibiting a marginal increase of 0.05%. The price of gold often serves as a safe-haven asset during uncertain times, and its modest rise may reflect investors seeking stability amid the subdued market conditions. On the other hand, USOUSD (WTI), which represents the price of West Texas Intermediate crude oil, experienced a decline of 0.16%. This dip could be attributed to various factors, including global supply and demand dynamics, geopolitical tensions, or market sentiment regarding the energy sector. Overall, with the closure of US markets and limited trading activity, the currency and commodity markets displayed muted movements on Memorial Day.
Picks of the Day Analysis
EUR/USD (4 Hours)
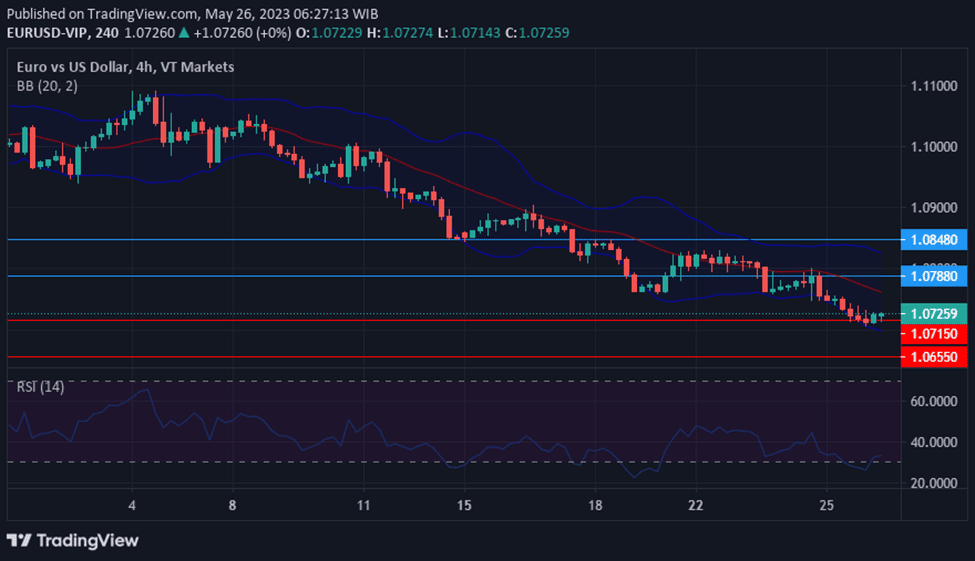
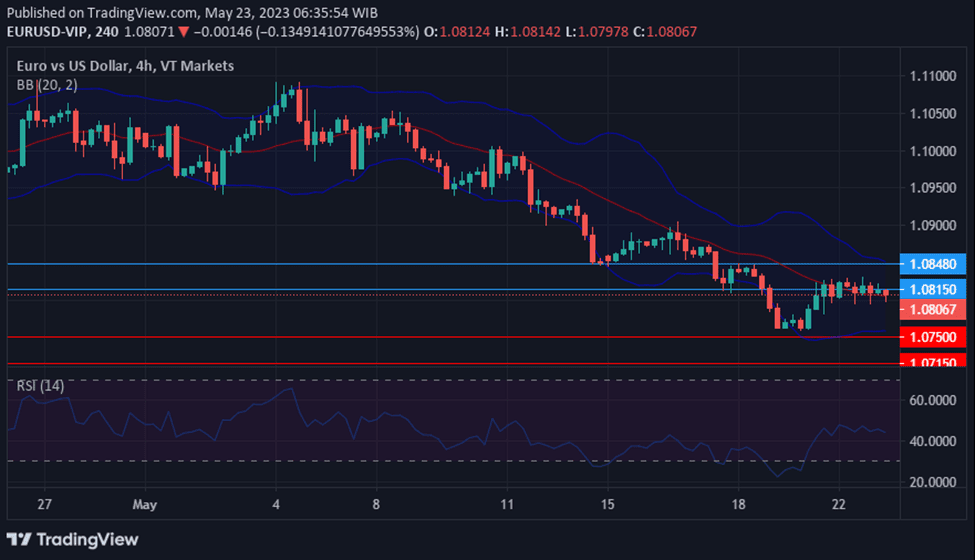
EUR/USD weakens against US Dollar amidst data anticipation and market focus on Debt limit suspension.
The EUR/USD pair maintained its position above the previous week’s lows but experienced another daily loss, closing at its lowest level since March 17. Despite staying above 1.0700 and avoiding new monthly lows, the euro weakened against the US dollar during the European session and declined against the pound. The currency lagged other major currencies on Monday, failing to break its negative trend against the greenback. The focus shifted to Spain’s upcoming release of the preliminary Consumer Price Index (CPI) report for May, which holds significance for European Central Bank (ECB) officials and market expectations. Meanwhile, the US dollar posted mixed results, with a slight gain of less than 0.1% against a basket of currencies, reaching its highest close in two months above 104.20.
As market expectations shift from a pause to a potential 25-basis-point increase at the next Federal Open Market Committee (FOMC) meeting, any decline in the US dollar is expected to be limited. With US markets closed for Memorial Day, Monday saw subdued trading activity, as market participants analyzed the weekend’s agreement in Washington to suspend the debt limit, while awaiting Congressional approval.
Attention also turned to Friday’s US consumer inflation data and the upcoming release of key economic reports throughout the week, including housing data and consumer confidence on Tuesday, as well as the ADP employment report on Thursday and Nonfarm Payrolls on Friday.
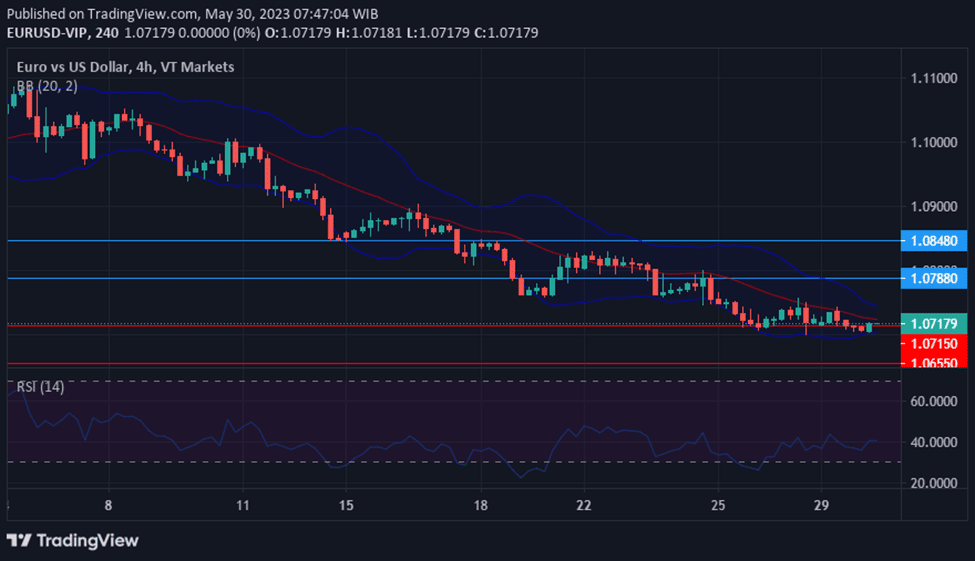
According to technical analysis, the EUR/USD pair is experiencing a slow movement on Monday due to holidays in the UK and US markets. This has resulted in a narrower range between the upper and lower bands of the Bollinger Bands.
It is anticipated that the EUR/USD will make a modest upward move today, aiming to reach the middle and upper bands of the Bollinger Bands. The Relative Strength Index (RSI) is currently at 40, suggesting that the bearish sentiment for the EUR/USD may be easing for today.
Resistance: 1.0788, 1.0848
Support: 1.0715, 1.0655
XAU/USD (4 Hours)
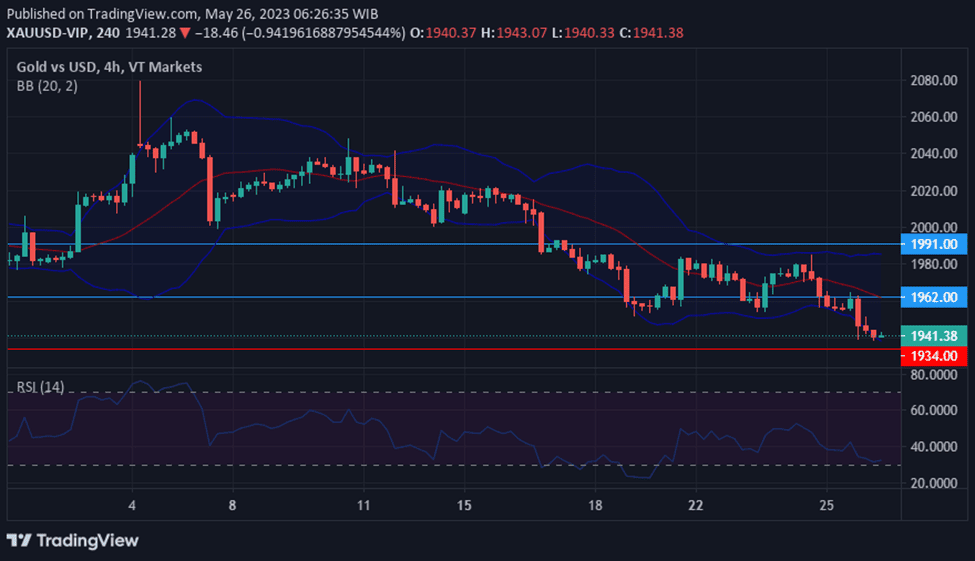
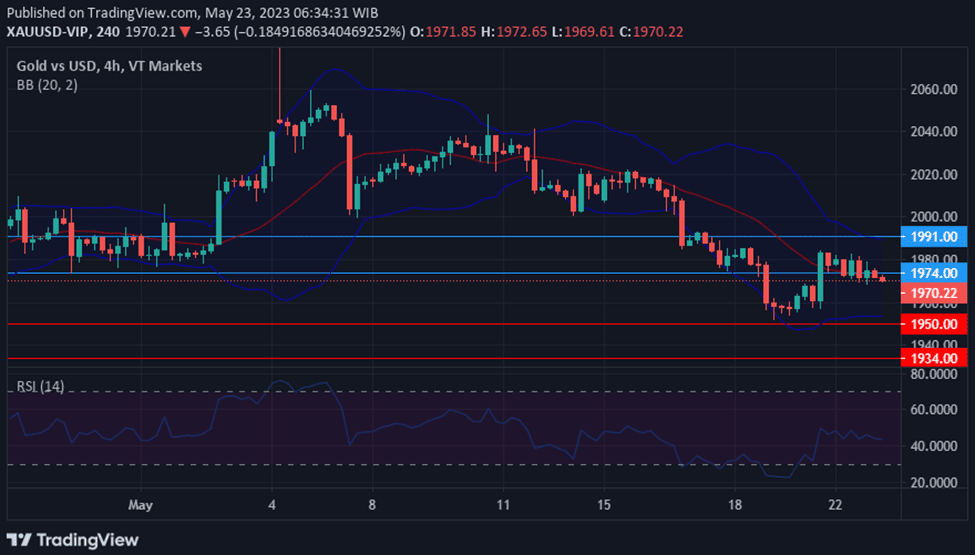
Gold (XAU/USD)holds steady amid optimism over US Debt Ceiling agreement.
Gold prices (XAU/USD) remained steady at $1,943 per troy ounce on Monday, unaffected by holidays in Europe and the United States. Investor optimism prevailed at the start of the week following an agreement on the debt ceiling reached between US President Joe Biden and House Speaker Kevin McCarthy. However, the deal still requires approval from Congress, and concerns persist due to the limited time remaining before the deadline set by Treasury Secretary Janet Yellen on June 1.
Despite the holiday-induced low trading volumes, stock futures rose, reflecting the positive market sentiment and dampening the appeal of safe-haven assets like gold. With no significant events to monitor at the beginning of the week, the macroeconomic calendar lacks substantial releases, although noteworthy data is expected in the coming days.
On Tuesday, the US will publish the CB Consumer Confidence report, while Germany and the Eurozone will release preliminary estimates of their May Harmonized Index of Consumer Prices (HICP) in the following days. Furthermore, the US will unveil the ADP Survey on private job creation ahead of the Nonfarm Payrolls report scheduled for Friday. These figures hold significance for policymakers and could fuel speculation about future decisions by central banks.
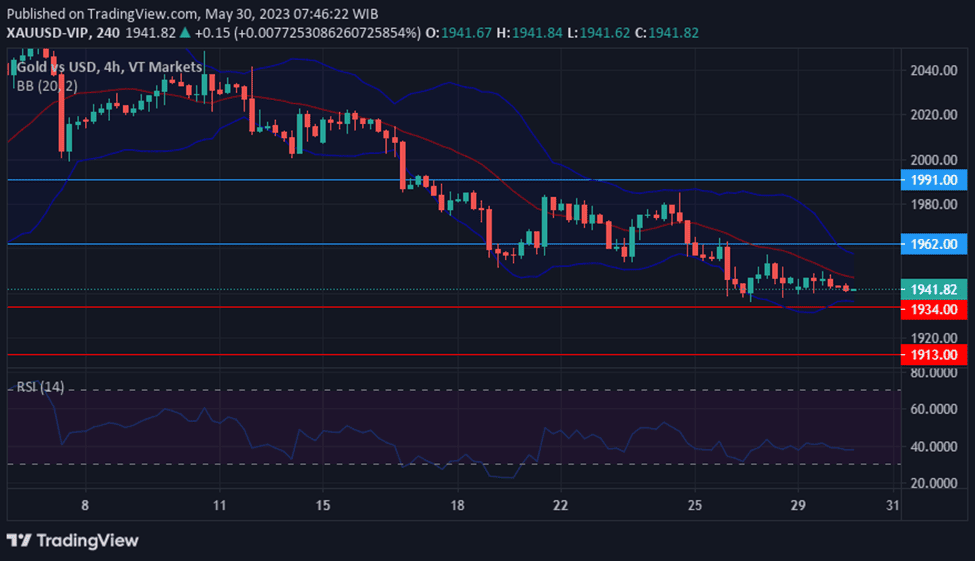
According to technical analysis, the XAU/USD is moving slower on Monday due to the US market holiday. There is a possibility that the XAU/USD will attempt to move higher and reach the middle and upper bands of the Bollinger Bands today. Currently, the Relative Strength Index (RSI) stands at 38, indicating that the XAU/USD is in a neutral position.
This week’s key economic indicators, including the US Jobs Report and Canada’s Gross Domestic Product, are in the spotlight for the financial sector. These fundamental reports are crucial for traders to navigate the markets and make informed decisions. Stay tuned for the latest updates.
Australia Consumer Price Index (31 May 2023)
The monthly Consumer Price Index in Australia increased 6.3% in the year to March 2023, slowing from a 6.8% rise in the year to February 2023.
The data for April 2023 will be released on 31 May, with analysts expecting a further slowdown, dropping to 6%.
Canada Gross Domestic Product (31 May 2023)
The Canadian economic activity in February edged up by 0.1%, following a 0.6% expansion in January.
For March 2023 data, set to be released on 31 May, analysts expect a 0.1% decline.
US JOLTS Job Openings (31 May 2023)
The number of job openings in the US dropped by 384,000 to 9.6 million in March 2023, the lowest level since April 2021.
Data for April 2023 will be released on 31 May, with analysts expecting another drop to 9.2 million.
US ADP Non-Farm Employment Change (1 June 2023)
Private businesses in the US created 296,000 jobs in April 2023, a significant increase compared to the downwardly revised figure of 142,000 in March 2023.
May 2023 data will be released on 1 June, with analysts anticipating a job creation figure of around 200,000.
US ISM Manufacturing PMI (1 June 2023)
The ISM Manufacturing PMI in the US rose to 47.1 in April 2023, up from a three-year low of 46.3 in the previous month.
Analysts predict that the index for May 2023, scheduled for release on 1 June, will be at 48.
US Jobs Report (2 June 2023)
The US Non-Farm Employment Change unexpectedly increased by 253,000 jobs in April 2023, outperforming the expected 180,000 and coming after a downwardly revised 165,000 in March. Concurrently, the unemployment rate in April 2023 dropped to 3.4%, matching a 50-year low previously seen in January.
For May 2023 data, scheduled for release on 2 June, analysts anticipate that Non-Farm Employment will see an addition of 180,000 jobs, with the unemployment rate projected at 3.5%.
On Thursday, the S&P 500 and Nasdaq Composite experienced gains driven by positive quarterly results from Nvidia, leading to a surge in technology stocks. The Nasdaq rose by 1.71% to close at 12,698.09, while the S&P 500 increased by 0.88% to finish at 4,151.28. However, the Dow Jones Industrial Average declined slightly by 0.11% to close below its 200-day moving average at 32,764.65.
Nvidia’s shares soared by 24.4% after the company reported better-than-expected revenue guidance and strong performance in the previous quarter. The increasing demand for Nvidia’s chips in artificial intelligence applications contributed to its success. Following these results, several analysts raised their price targets for Nvidia, bringing the company’s market capitalization close to $1 trillion. Other semiconductor and artificial intelligence stocks, such as Advanced Micro Devices, Taiwan Semiconductor, Alphabet, and Microsoft, also experienced notable gains.
Despite the positive market performance, concerns about market breadth persisted, with some companies and sectors driving the market higher while others struggled. Additionally, negotiations to raise the U.S. debt ceiling continued, causing some uncertainty in the market. Talks between congressional leaders and President Joe Biden showed progress, but concerns remained as the default deadline approached. Fitch Ratings put the U.S.’ AAA long-term foreign-currency issuer default rating on a negative watch, citing the risk of missed payments on government obligations.
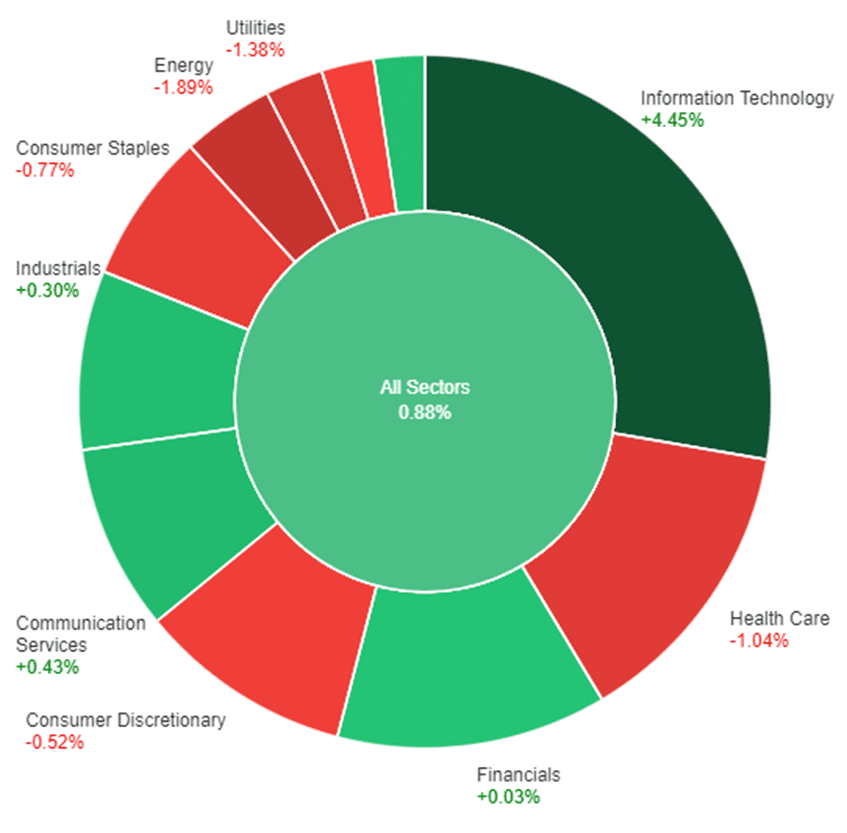
On Thursday, the overall market experienced a positive price change of 0.88%. The Information Technology sector performed exceptionally well, with a significant increase of 4.45%. Communication Services also saw a modest gain of 0.43%, followed by Industrials and Real Estate sectors, which both experienced slight increases of 0.30% and 0.28%, respectively. The Financials sector showed minimal growth with a 0.03% increase.
However, several sectors experienced declines on Thursday. The Materials sector saw a decrease of 0.38%, while the Consumer Discretionary sector suffered a larger decline of 0.52%. The Consumer Staples sector had a notable drop of 0.77%. The Health Care sector experienced a significant decrease of 1.04%, and Utilities and Energy sectors had the largest declines, with decreases of 1.38% and 1.89%, respectively.
Major Pair Movement
On Thursday, the dollar index performed strongly, supported by haven buying due to ongoing uncertainties surrounding U.S. debt ceiling negotiations. Additionally, positive U.S. economic data, including tight initial jobless claims, upbeat GDP, and core PCE data, have raised expectations of a Federal Reserve interest rate hike in July. This has diminished the previously anticipated rate cuts for the end of the year. While a resolution to the debt ceiling issue was expected by Friday afternoon, U.S. Treasury Bill rates remained elevated.
In the currency markets, the euro lost 0.2% against the dollar, primarily driven by the strength of the dollar due to rising interest rate expectations. The dollar’s safe-haven status remained intact as credit agencies warned of a possible downgrade of the U.S. sovereign rating.
USD/JPY broke above a key Fibonacci resistance level, reaching a high of 139.96, benefiting from widening U.S.-Japan rate differentials. The Bank of Japan’s Governor commented on potential adjustments to the Yield Curve Control (YCC) program, focusing on shorter maturities, but it had limited impact on the rising USD/JPY trend.
Meanwhile, GBP/USD experienced a slight decline of 0.33% as weak UK CBI data and concerns over fading UK economic performance overshadowed rising UK rates. Gold prices fell by 0.75% to $1,942 as speculators lightened their gold hedges in anticipation of a potential debt ceiling deal and took advantage of higher yields.
Bitcoin remained relatively flat at $26.4k, finding support near the lower 30-day Bolli band around $25.7k, while a close below the 50% Fibonacci level at $25.3k could potentially lead to a further decline towards the 200-day moving average at $22.7k.
Picks of the Day Analysis
EUR/USD (4 Hours)
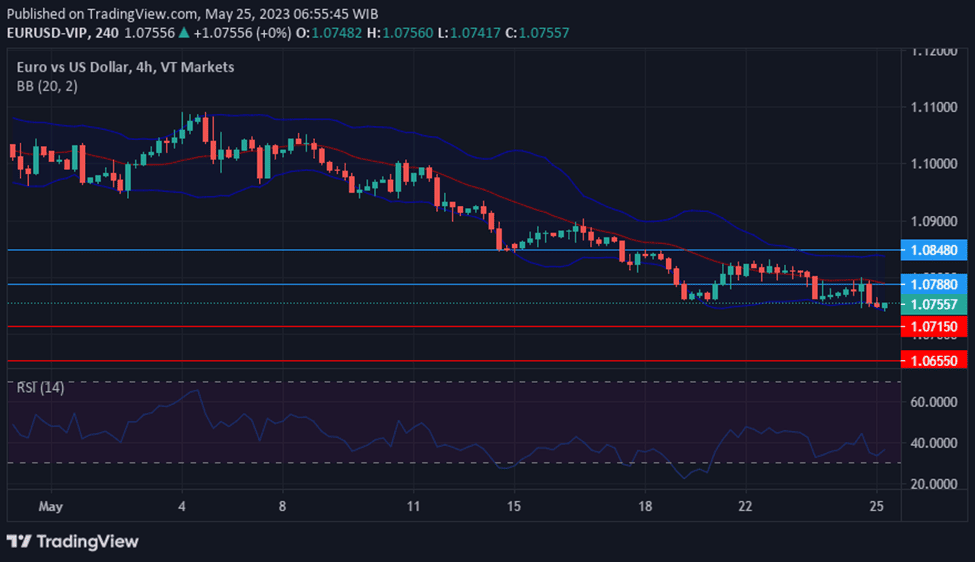
EUR/USD Hits Two-Month Low as US Debt Ceiling Uncertainty Fuels Dollar Strength
The EUR/USD pair reached a two-month low on Thursday, trading around 1.0720 as the US dollar continued to exhibit strength due to concerns over the unresolved US debt ceiling negotiations. The absence of a deal on extending the debt ceiling created a negative sentiment, and House Speaker Kevin McCarthy’s update during the day indicated that a deal had not yet been reached.
The US data released on Thursday, including an upward revision of Q1 GDP growth to 1.3% and better-than-expected Initial Jobless Claims, further boosted the USD ahead of the Wall Street opening. Meanwhile, the Euro faced additional pressure as Germany reported a downward revision of Q1 GDP to -0.3% quarter-on-quarter. On Friday, the US is scheduled to release relevant figures, such as April Durable Goods Orders and the Personal Consumption Expenditures Price Index. No significant macroeconomic data is expected from the EU.
According to technical analysis, the EUR/USD pair is continuing to move slowly lower and has reached our support level, which is also exerting pressure on the lower band of the Bollinger Bands. It is expected that the EUR/USD will attempt a slight upward movement today and reach the middle band of the Bollinger Bands. The Relative Strength Index (RSI) is currently at 33, back above the oversold area, indicating that the bearish sentiment for the EUR/USD may be easing for today.
Resistance: 1.0788, 1.0848
Support: 1.0715, 1.0655
XAU/USD (4 Hours)
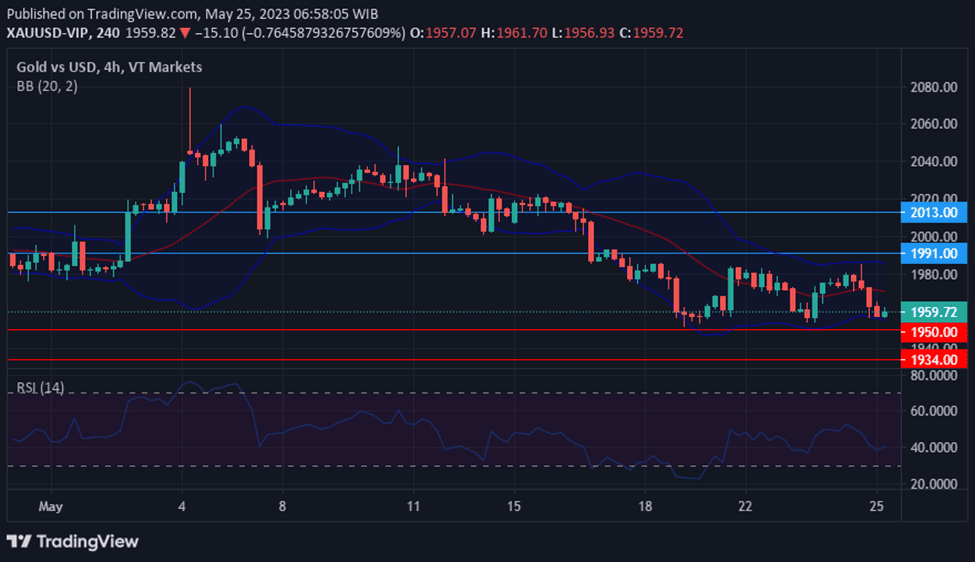
Gold (XAU/USD)Breaks Key Retracement Level as US Dollar Gains Support from Upbeat Economic Data and Debt Ceiling Concerns Persist
Gold prices (XAU/USD) broke below the 50% retracement level of the March/May rally, reaching a low of $1,930.20 during European trading hours. Although it bounced from that level, it is struggling to recover above it. The US Dollar found support due to a negative market sentiment and positive macroeconomic figures in the United States. The country revised its Q1 economic growth upward to 1.3% according to the GDP report, indicating a potential avoidance of recession but also raising the possibility of rate hikes to control inflation.
The strength of the US currency led to stock markets remaining subdued, as concerns about the US debt-ceiling limit persisted. Negotiations between President Joe Biden and top Republicans continue, with the opposition demanding spending cuts for an extension of the debt ceiling. Progress has been made, but a deal is unlikely to be reached today, according to House Speaker Kevin McCarthy.
According to technical analysis, the XAU/USD is moving lower on Thursday and exerting pressure on the lower band of the Bollinger Bands. There is a possibility that the XAU/USD will attempt to move higher and reach the middle band of the Bollinger Bands today. Currently, the Relative Strength Index (RSI) stands at 34, indicating that the XAU/USD is in a neutral but still bearish stance.
The Dow Jones Industrial Average extended its decline for the fourth consecutive day amidst mounting concerns over a potential default as U.S. lawmakers struggled to reach an agreement on the country’s debt ceiling. The Dow dropped 255.59 points, or 0.77%, closing at 32,799.92, while the S&P 500 and Nasdaq Composite also experienced losses. House Speaker Kevin McCarthy blamed Democrats for delayed negotiations on spending caps and expressed hope for progress. Treasury Secretary Janet Yellen warned of a “highly likely” default in early June, leading to stress in financial markets. The market remained cautious due to overbought conditions and growing fears about an unfavorable debt ceiling outcome.
Despite the Federal Reserve’s minutes indicating uncertainty about raising rates in June, stocks continued to hover near their lows. Investors were selling amid heightened fears, leading to a “pullback mode” in the market. The ongoing earnings season saw surprises as Kohl’s and Abercrombie & Fitch reported unexpected profits, resulting in significant stock increases. Semiconductor giant Nvidia’s results were eagerly anticipated after the closing bell. With June 1 approaching, the market remained apprehensive, awaiting further data releases and developments surrounding the debt ceiling negotiations.
Data by Bloomberg
On Wednesday, all sectors of the market experienced a decline, with the overall market decreasing by 0.73%. The energy sector was the only one to see a slight increase of 0.52%. The sectors that suffered the most significant losses were real estate (-2.21%), financials (-1.31%), and industrials (-1.27%). Other sectors that experienced declines include materials (-1.12%), health care (-0.66%), consumer staples (-0.65%), utilities (-0.63%), information technology (-0.62%), communication services (-0.60%), and consumer discretionary (-0.23%).
Major Pair Movement
The USD index reached a two-month high of 103.91 due to ongoing uncertainty surrounding the U.S. debt ceiling and rising geopolitical tensions between China and Russia, which increased risk aversion in the market. The dollar held onto its gains as the Federal Reserve Governor Christopher Waller made relatively hawkish comments, expressing concerns about inflation and stating that his decision on whether to raise interest rates in June would depend on upcoming data. The Fed minutes from their May meeting provided no new insights for near-term policy direction, although some participants believed additional policy tightening might be necessary if the economy followed their outlook.
In currency markets, the euro weakened slightly against the dollar, while EUR/GBP saw some buying activity despite higher-than-expected UK inflation. USD/JPY broke above recent resistance levels but retreated from its peak as the Fed minutes failed to provide fresh momentum for expectations of higher U.S. rates. GBP/USD continued its decline amid broader risk-off sentiment related to the debt ceiling crisis, and the UK inflation miss raised doubts about the government’s ability to manage inflation as forecast. In the cryptocurrency market, Bitcoin experienced a 3.5% drop to $26.3k, influenced by the outlook of higher interest rates from the Fed, with support levels at risk of being breached.
Picks of the Day Analysis
EUR/USD (4 Hours)
EUR/USD Continues Downward Trend as US Dollar Strengthens Amid Uncertainty
The EUR/USD pair declined for the second consecutive day, marking its lowest daily close in two months, as a stronger US Dollar remained the dominant factor. The Greenback was supported by higher Treasury yields and risk aversion, causing the pair to retreat towards 1.0750 after a brief recovery during the European session. In economic news, the German IFO Business Climate Index dropped to 91.7 in May, falling short of market expectations. The Euro remained unaffected by the report.
Meanwhile, the Federal Open Market Committee (FOMC) minutes revealed a division among officials regarding future interest rates, with uncertainty surrounding the need for further policy tightening. Market sentiment worsened due to a bleak growth outlook and ongoing debt-ceiling negotiations in Washington. On the horizon, upcoming economic reports in the US include Jobless Claims.
According to technical analysis, the EUR/USD pair is currently experiencing a minor consolidation and attempting to break its lowest price, putting pressure on the lower band of the Bollinger Bands. It is expected that the EUR/USD will continue to consolidate and gradually decline. The Relative Strength Index (RSI) is currently at 36, indicating bearish sentiment for the EUR/USD.
Resistance: 1.0788, 1.0848
Support: 1.0715, 1.0655
XAU/USD (4 Hours)
Gold (XAU/USD)Pressured as Risk Aversion and Fed Uncertainty Weigh on Markets
Gold prices (XAU/USD) encountered downward pressure on Wednesday as risk aversion gripped financial markets, leading to a dip in XAU/USD. The cautious sentiment benefited the US Dollar, pushing the price of gold toward daily lows around $1,956. The market unease was fueled by United States House Speaker Kevin McCarthy’s comments, highlighting significant differences in debt ceiling extension talks with President Joe Biden, focusing on spending cuts and opposition to tax hikes. McCarthy, however, expressed optimism about avoiding a default and eventually reaching a deal. Additionally, uncertainty surrounding the Federal Reserve’s future monetary policy further dampened sentiment, as investors eagerly awaited the release of the FOMC meeting minutes for insights. Recent hawkish comments from policymakers regarding possible rate hikes added to the prevailing cautious mood in the market.
According to technical analysis, XAU/USD is moving lower on Wednesday and attempting to reach the lowest price of the week while approaching the lower band of the Bollinger Bands. There is a possibility that XAU/USD will continue to fluctuate between the support and resistance levels. Currently, the Relative Strength Index (RSI) stands at 40, indicating that XAU/USD is in a neutral but bearish position.
Stocks experienced a decline on Tuesday as discussions regarding the debt ceiling continued with minimal signs of advancement. The S&P 500 dropped 1.12% to settle at 4,145.58, while the Nasdaq Composite pulled back 1.26% to close at 12,560.25. The Dow Jones Industrial Average also lost 0.69%, or 231.07 points, finishing at 33,055.51. The lack of significant updates on the negotiations left some traders concerned about the lawmakers’ ability to make progress as hoped. Investors have been closely watching the debt-limit negotiations, seeking more certainty as the June 1 X-date, projected by Treasury Secretary Janet Yellen, approaches. Despite the ongoing uncertainty, market stability has impressed experts like Mohamed El-Erian, the chief economic advisor at Allianz, who noted that the S&P 500 remains fairly priced.
While there is an expectation that lawmakers will eventually reach a resolution regarding the debt ceiling, caution prevails due to persistent recession fears and uncertainty surrounding the Federal Reserve’s next rate move. Sandi Bragar, the chief client officer at Aspiriant, emphasized the need for caution, stating that although many investors are eager to participate in the current market conditions, it may not be the time for excessive enthusiasm. Meanwhile, notable stock movements included Apple’s 1.5% decline following the announcement of a multibillion-dollar chip production deal with Broadcom, and Yelp’s 5.7% increase as an activist investor called for the company to explore a sale.
Data by Bloomberg
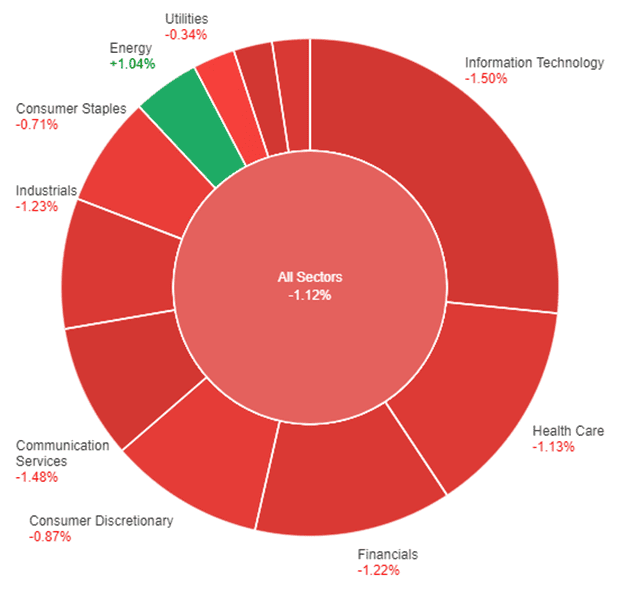
On Tuesday, the stock market saw a general decline across all sectors, with the overall market dropping by 1.12%. The energy sector, however, experienced a slight increase of 1.04%. The utilities sector decreased by 0.34%, while consumer staples and consumer discretionary sectors declined by 0.71% and 0.87%, respectively. The health care sector faced a larger decline of 1.13%. Financials and industrials both experienced decreases of 1.22% and 1.23%, respectively. Real estate and communication services sectors saw larger declines of 1.28% and 1.48%, while the information technology sector had the largest decline at 1.50%. The materials sector also faced a significant decline of 1.54% on Tuesday.
Major Pair Movement
On Tuesday, the market focus was on the EUR/USD, which traded lower due to concerns about slower economic growth, leading to increased demand for safe-haven assets. The divergence between the rate paths of the Federal Reserve (Fed) and the European Central Bank (ECB), along with contrasting data from the United States and the euro zone, contributed to the pair’s decline. The euro zone’s composite PMI for May decreased to 53.3, with a deeper contraction in the manufacturing component at 44.6. In contrast, the U.S. Philly Fed services index improved to -16.0, showing growth in the new orders component. This mixed data caused investors to adjust their expectations for the Fed and ECB rate paths, with rate cuts now priced in for both central banks in the Eurodollar and Euribor rates markets.
Consequently, the USD Index rose slightly by 0.27%, and the dollar’s yield advantage increased, reflected in the widening U.S.-German 2-year spreads. In other major pairs, GBP/USD was slightly lower by 0.17%, AUD/USD fell by 0.57%, and today we are expecting the RBNZ rate statement. The market remains attentive to the developments in central bank policies and economic data, as they continue to impact currency pairs. Traders will closely watch the upcoming RBNZ rate statement for any indications of potential changes in interest rates or monetary policy.
Picks of the Day Analysis
EUR/USD (4 Hours)
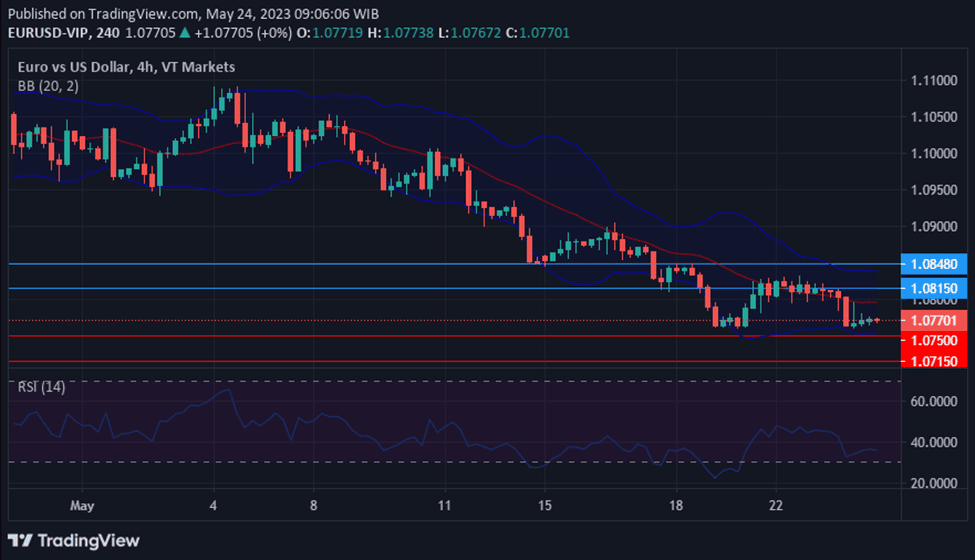
EUR/USD Slides as Dollar Strengthens Amid Weak Eurozone Data: Market Focus on Upcoming Releases and US Debt Ceiling Negotiation
The EUR/USD continued to fall after a brief recovery, reaching last week’s lows around 1.0760. The euro remains weak compared to the US dollar due to a stronger dollar and disappointing data from the Eurozone. The European Central Bank’s hawkish statements did not provide much support as economic indicators, such as the Manufacturing index, came below expectations. In contrast, the US dollar remained strong, supported by risk aversion, and mixed economic data. Market participants are eagerly awaiting upcoming economic releases from the Eurozone, as well as the FOMC minutes and ongoing debt-ceiling negotiations in the US.
According to technical analysis, the EUR/USD pair is currently undergoing a minor consolidation near its lowest price and close to the lower band of the Bollinger Bands. It is expected that the EUR/USD will remain in a consolidation phase throughout the day. The Relative Strength Index (RSI) is currently at 36, indicating bearish sentiment for the EUR/USD.
Resistance: 1.0815, 1.0848
Support: 1.0750, 1.0715
XAU/USD (4 Hours)
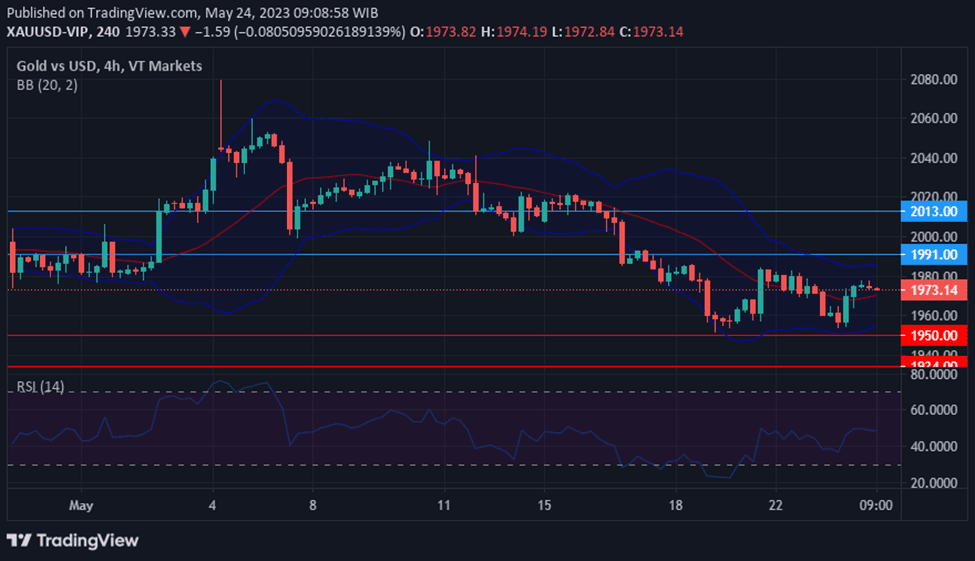
Gold (XAU/USD)Prices Recover Slightly as Market Concerns and Fed’s Mixed Messages Weigh on Investor Sentiment
Gold prices (XAU/USD) initially dropped to $1,954.22 during European trading due to concerns in the market favoring the US Dollar. However, gold managed to recover slightly and is currently trading at around $1,972, showing minimal change for the second consecutive day. The financial markets are exhibiting risk aversion due to lackluster macroeconomic data and uncertainty surrounding the Federal Reserve’s future actions. While the Fed had taken a cautious approach in raising rates earlier in May, recent statements from various Fed members have surprised investors with a more hawkish stance, suggesting the possibility of one or even two more rate hikes. The release of the FOMC meeting minutes on Wednesday is anticipated to provide further insight into monetary policy plans. Additionally, S&P Global’s preliminary estimates indicate that the US services sector experienced faster growth than expected, while manufacturing output contracted to a three-month low. Europe demonstrated a similar pattern, with accelerating services output but contracting industrial activity.
According to technical analysis, XAU/USD experienced a small upward movement on Tuesday and successfully reached our resistance level. It settled around the middle band of the Bollinger Bands. There is a possibility that XAU/USD could continue moving higher and attempt to reach the upper band of the Bollinger Bands. Currently, the Relative Strength Index (RSI) is at 48, indicating that XAU/USD has returned to a neutral position.
On Monday, the S&P 500 index experienced minimal change as investors awaited a crucial debt ceiling meeting and officials worked to prevent a default. The index slightly increased by 0.02% to close at 4,192.63, while the Dow Jones Industrial Average fell by 0.42% to end at 33,286.58. In contrast, the Nasdaq Composite rose by 0.5% to settle at 12,720.78, reaching its highest closing and intraday levels since August. President Joe Biden and House Speaker Kevin McCarthy were scheduled to hold talks concerning the debt ceiling, with only 10 days remaining before a potential U.S. default. Negotiations faced hurdles due to disagreements over government spending cuts and tax increases.
Despite uncertainties in Washington and concerns about inflation, the stock market continued to rise, particularly driven by technology stocks, resulting in a winning week for major averages. The S&P 500 approached the 4,200 level, but market analysts emphasized the need for broader market participation to sustain the rally in the long term. Sylvia Jablonski, CEO at Defiance ETFs, suggested that stronger market breadth might come after the Federal Reserve’s June meeting. Economic data for the week included the second reading for first-quarter GDP on Thursday and the release of the Fed’s preferred inflation measure, the personal consumption expenditures gauge, on Friday. Additionally, investors awaited the Fed minutes from the May meeting, which could provide insights into the central bank’s stance on potential interest rate hikes. Notable upcoming reports included earnings announcements from Zoom Video, Lowe’s, and Dick’s Sporting Goods, signaling the winding down of the first-quarter earnings season.
Data by Bloomberg
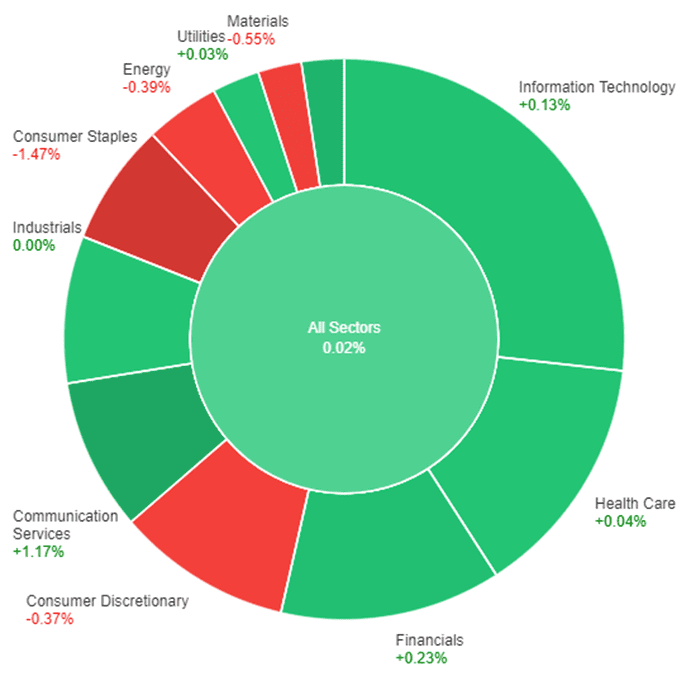
On Monday, the overall market showed a slight increase of 0.02%. Among the sectors, Communication Services performed the best, with a gain of 1.17%, followed by Real Estate, which rose by 0.67%. Financials experienced a modest increase of 0.23%, while Information Technology and Health Care sectors saw smaller gains of 0.13% and 0.04% respectively. Utilities and Industrials sectors remained relatively stable with minimal changes at 0.03% and 0.00% respectively. However, Consumer Discretionary, Energy, Materials, and Consumer Staples sectors all recorded declines, with Consumer Staples suffering the most significant loss at 1.47%.
Major Pair Movement
The US dollar index experienced a rise after comments from Minneapolis Fed President Neel Kashkari and St. Louis Fed President James Bullard suggested a hawkish stance. Kashkari indicated the possibility of interest rates exceeding 6%, while Bullard mentioned the potential for additional rate hikes in 2023. However, San Francisco Fed President Mary Daly took a more cautious approach, awaiting further data and suggesting that tighter credit conditions may be equivalent to one or two rate hikes. Atlanta Fed President Raphael Bostic expressed comfort in observing the economy’s performance given the significant tightening measures implemented thus far. Traders remained cautious due to ongoing debt ceiling negotiations aiming to prevent a US default before the June 1 deadline.
The EUR/USD pair experienced a slight dip, while front-end futures rates saw a modest increase in December 2023 rate cut expectations. USD/JPY rose as US-Japan yield expectations were influenced by the tighter Fed rate outlook. GBP/USD declined, influenced by the hawkish expectations of the Fed, as traders adjusted their positions ahead of important data releases. Bitcoin traded at $26.8k with minimal movement, while gold and silver prices experienced declines due to higher US yields impacting precious metals.
Picks of the Day Analysis
EUR/USD (4 Hours)
EUR/USD Holds Steady Amid Central Bank Talks and Debt Limit Negotiations
The EUR/USD remained steady at 1.0800 level after recovering from a month-low, but the overall sentiment remains negative. The focus shifted to central bank discussions and negotiations around the US debt limit. Federal Reserve officials expressed a hawkish stance, suggesting the need for higher interest rates. The market expects a potential rate hike in June, but chances are around 25%. The release of FOMC minutes and the Core Personal Consumption Expenditures Price Index will be crucial for monetary policy expectations. Additionally, attention is on resolving the debt limit crisis. Increased volatility is expected as European PMI numbers are released, providing insight into economic performance in May. The market anticipates another rate hike from the European Central Bank, although consensus on future actions is starting to waver.
According to technical analysis, the EUR/USD pair is currently experiencing a slight upward movement from its lowest price, returning to hover around the middle band of the Bollinger Bands. It is anticipated that the EUR/USD will maintain a consolidation phase during the early session before adjusting its movement based on key events, namely the Flash Manufacturing and Services PMI reports scheduled for today. The Relative Strength Index (RSI) currently stands at 44, indicating that the EUR/USD has returned to a neutral position.
Resistance: 1.0815, 1.0848
Support: 1.0750, 1.0715
XAU/USD (4 Hours)
Gold (XAU/USD)Under Pressure as Markets Await Catalysts and Monitor US Debt-Ceiling Talks and Fed’s Rate Hike Signals
Spot gold (XAU/USD) is experiencing slight downward pressure as it trades at around $1,975 per troy ounce, although it remains at the higher end of Friday’s trading range. The market is eagerly awaiting a new catalyst while keeping an eye on US debt-ceiling negotiations, as a potential default on June 1 looms. Discussions are ongoing but no significant agreements have been reached yet. Tensions are also rising ahead of the release of the FOMC Meeting Minutes next Wednesday, accompanied by statements from several Federal Reserve speakers. James Bullard believes the central bank will raise the policy rate further with at least two more 25 basis points hikes, while Neel Kashkari sees it as a close call and is willing to maintain rates to assess past rate increases’ effects. Mary Daly suggests that tighter credit conditions could be equivalent to one or two rate hikes and emphasizes the need for data-dependent decision-making. Financial markets predict that the US central bank will avoid raising rates in June and July due to concerns over potential harm to the financial system.
According to technical analysis, on Monday, XAU/USD made a slight upward movement but was unable to maintain its position and dropped below our resistance level, settling around the middle band of the Bollinger Bands. There is a chance that XAU/USD might undergo a modest downward movement and attempt to reach the lower band of the Bollinger Bands. Currently, the Relative Strength Index (RSI) is at 43, signaling that XAU/USD has returned to a neutral stance.
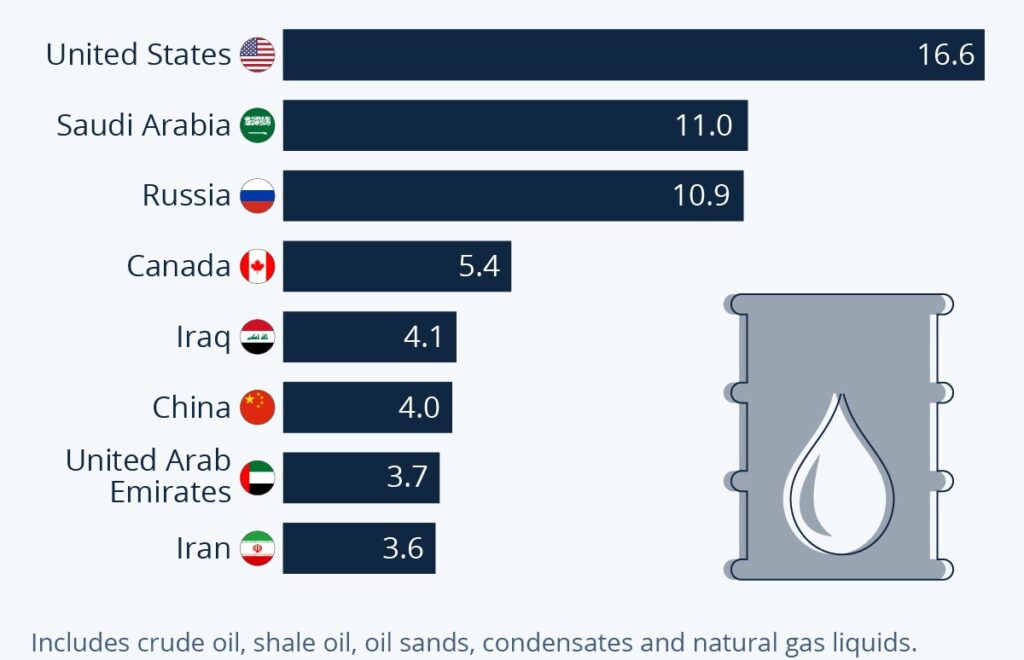
The oil and gas industry encompasses different types of oil, such as crude oil, no-lead gasoline, natural gas, and heating oils. Among these, crude oil remains the largest and most widely traded sector, sourced from various points of origin worldwide.
Due to its extensive trading volume and diverse sources, crude oil is susceptible to geographic, political, and economic factors that make its market highly volatile. This volatility presents both risks and opportunities for traders interested in capitalising on the oil market.
The world’s biggest oil producers (2021) in million barrels per day. source: statista.com, BP
Understanding Oil CFDs
CFDs are derivative financial products that allow traders to gain exposure to a market, such as oil, without owning the underlying asset.
Unlike physical trading, oil CFDs derive their profitability from speculating on price fluctuations rather than the buying and selling of the actual commodity.
Successful trading of oil CFDs requires a deep understanding of market trends, factors driving price movements, and the ability to predict market dynamics.
What Are Oil CFDs?
Oil CFDs enable traders to access the expansive oil market through leverage, offering increased exposure without the need to possess the physical asset.
This increased exposure can diversify investment portfolios and reduce overall risk. Oil CFDs serve as conduits for trading in oil spot prices, oil futures, and oil options.
The most commonly traded benchmarks for crude oil CFDs are West Texas Intermediate (WTI) and Brent Crude Oil.
Differentiating WTI and Brent Crude Oil
When trading oil CFDs, it is important to familiarise yourself with the two primary types of crude oil in the global market: WTI Crude Oil and Brent Crude Oil.
These crude oils are rated based on their density and sulphur content, which impacts their quality and refining costs.
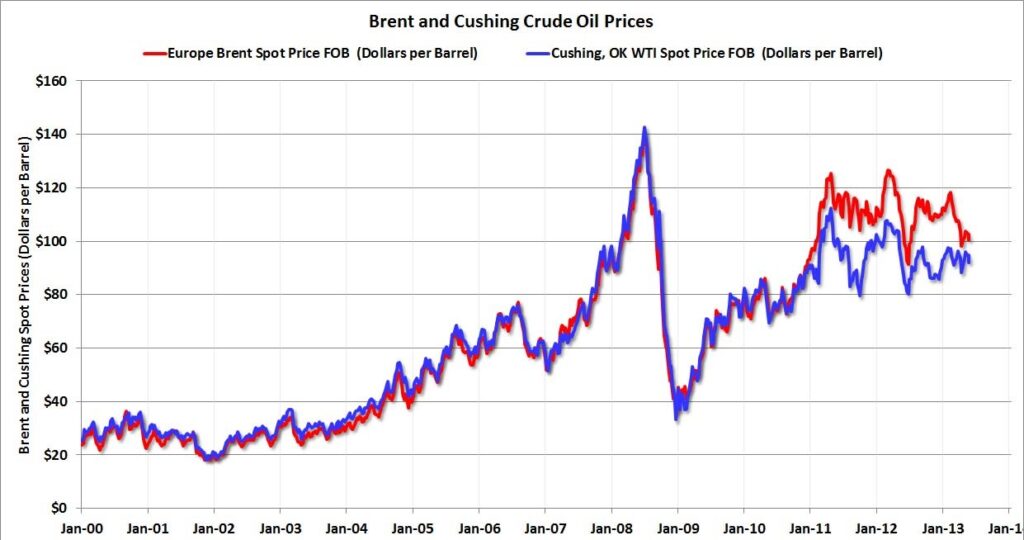
Brent Crude Oil
Sourced from oil drilling in the North Sea
Responsible for setting the price of two-thirds of the world’s traded crude oil supplies
Defined as a light crude oil, but not as light as WTI Crude Oil
Typically refined in Northwest Europe
Brent Crude Oil CFDs are traded over a five-day work week
Brent can be particularly vulnerable to crises and instability because it is relatively more widespread
WTI Crude Oil
Sourced from land based oil fields in Texas, Louisiana and North Dakota
One of the two main benchmarks for pricing of global oil markets, along with Brent Crude
Graded as ‘Texas light sweet’ oil, both lighter and sweeter than Brent Crude
Typically refined in Texas and Oklahoma
Land-based drilling can make shipping and transport of WTI Crude Oil more expensive
International events and instability have less of an effect on price
Traded on the New York Mercantile Exchange (NYMEX)
source: calculatedriskblog
Trading Oil CFDs: Key Steps
To start trading oil CFDs, it is essential to follow a structured approach:
Step 1. Familiarise Yourself with Live Trading
Choose whether you want to trade WTI Crude Oil, Brent Crude Oil, or both. Practice using a demo account to become familiar with trading tools, indicators, and executing trades in a risk-free environment.
Step 2. Create Your Oil CFD Trading Account
Once comfortable with the trading environment, open a live trading account, download the trading platform, and deposit funds to start trading.
Step 3. Manage Your Risk
Establish risk management strategies, including the use of stop-loss orders and limit-close orders, to control potential losses.
Step 4. Study the Market
Deepen your understanding of the oil market through comprehensive research, including fundamental and technical analysis. Stay updated with breaking news and monitor long-term performance to identify patterns.
Step 5. Formulate a Strategy
Determine whether you prefer short-term or long-term trading strategies and select an approach that aligns with your portfolio and goals.
Step 6. Consider Diversification
Explore other CFD markets and assets to diversify your trading portfolio and mitigate risk.
Step 7. Monitor and Adjust
Continuously monitor your trades, adapt your strategy as needed, and make informed decisions based on the market conditions.
Trading Oil CFD Futures
In addition to trading spot prices, oil CFDs also provide access to oil futures. Oil CFD futures are over-the-counter derivatives based on future contracts. These contracts allow traders to speculate on the future price of oil at a predetermined date. Trading oil CFD futures involves understanding the intricacies of futures markets, contract expiration, and factors that influence their prices.
source: U.S. Energy Information Administration, Refintiv (Mar 2022)
Pros and Cons of Oil CFDs
As with any trading method, oil CFDs have their own advantages and disadvantages, which you’ll need to weigh up before you get started.
Pros:
Trading oil CFDs requires you to trade with leverage, which means traders only have to place a percentage margin of the full trade value as a deposit. This can give you increased exposure in oil markets and has the potential to maximise your profits.
Oil CFDs give you the chance to gain full exposure to the oil market without needing to take possession of any physical assets.
Trading oil CFDs can be thrilling for investors who want to challenge themselves in volatile markets.
This volatility also opens up more potential opportunities for traders to make a profit.
Cons:
It’s worth noting that oil CFD trading is not permitted in the US and is taxed, unlike other methods such as crude oil spread betting.
Leveraged trading can maximise your profits, but it can also amplify your losses. You should bear this in mind and have a strategy in place for mitigating the risks involved with trading oil CFDs.
The oil market is volatile and requires close monitoring as well as detailed knowledge of your chosen market if you want to trade oil CFDs.
Learn with VT Markets
VT Markets is a provider of comprehensive trading services, offering demo trading accounts using the popular MetaTrader platforms. These demo accounts enable traders to experience realistic trading environments, access powerful trading tools, analyse market trends, and receive professional support. By leveraging these resources, traders can develop their trading style and gain confidence in trading oil CFDs effectively.
Summary:
Crude oil is the largest and most volatile sector in the oil and gas industry, influenced by geographic, political, and economic factors.
Oil CFDs are derivative financial products that allow traders to speculate on oil price fluctuations without owning the physical asset.
Oil CFDs provide increased exposure and can diversify investment portfolios, with commonly traded benchmarks being WTI and Brent Crude Oil.
WTI Crude Oil is sourced from land-based oil fields in the US, while Brent Crude Oil comes from drilling in the North Sea.
Trading oil CFDs involves steps such as familiarising oneself with live trading, creating a trading account, managing risks, studying the market, formulating a strategy, considering diversification, and monitoring and adjusting trades.
The financial sector is poised to closely monitor significant economic releases this week, with particular attention on RBNZ Rate Statement and FOMC Meeting Minutes. These essential reports play a critical role in guiding traders through the markets and enabling them to make well-informed decisions.
Germany, UK and US Flash Manufacturing PMI (23 May)
In April 2023, Germany’s Manufacturing PMI experienced a slight upward revision to 44.5, marking the sector’s poorest performance since May 2020. Meanwhile, the UK Manufacturing PMI was adjusted higher to 47.8, and the US Flash Manufacturing PMI saw a downward revision to 50.2, compared to March’s reading of 49.2.
For May 2023 data, due on 23 May, analysts predict German Manufacturing PMI at 43.6, UK’s at 48.8, and US’s at 50.3.
EU, UK and US Flash Services PMI (23 May)
In April 2023, US Services PMI was revised to 53.6, the year’s largest expansion, while Germany’s reached 56, its fastest growth in a year. The UK Services PMI rose to 55.9, highlighting continuous sector expansion throughout the year.
For May 2023 data, set to be released on 23 May, analysts forecast Germany’s Flash Services PMI at 56.6, UK’s at 54.3, and US’s at 53.
Reserve Bank of New Zealand Rate Statement (24 May)
During its April meeting, the Reserve Bank of New Zealand increased its official cash rate by 50bps to 5.25%, reaching its highest level since December 2008.
For the upcoming meeting on 24 May, analysts predict that the RBNZ will implement an additional 25bps hike, raising the rate to 5.5%.
UK Consumer Price Index (24 May)
The consumer price inflation rate in the UK eased to 10.1% year-on-year in March 2023 from 10.4% in February 2023.
As for the year-on-year CPI data set to be released on 24 May, analysts anticipate a further decline, projecting it to drop to 8.5%.
US FOMC Meeting Minutes (24 May)
The Fed implemented a 25bps increase in its funds rate during its meeting on 3 May, adjusting it to a range of 5%-5.25%. This adjustment represents the 10th hike.
Analysts await the release of the next FOMC Meeting Minutes on 24 May, where they expect to find indications from the Fed about the ongoing tightening cycle. They anticipate the removal of a statement sentence that suggests the need for further policy firming.
US Core PCE Price Index (26 May)
US Core PCE prices, excluding food and energy, experienced a 0.3% month-over-month increase in March 2023, maintaining the same growth rate as the previous month.
The data for April 2023 is set to be released on 26 May, with analysts expecting the same growth rate as March 2023 at 0.3%.
Copper is a widely used hard commodity that finds applications in various sectors, including technology, construction, plumbing, and wiring. While it may be less expensive compared to precious metals like silver and gold, copper’s exceptional properties as a conductor of heat and electricity make it an attractive asset for trading.
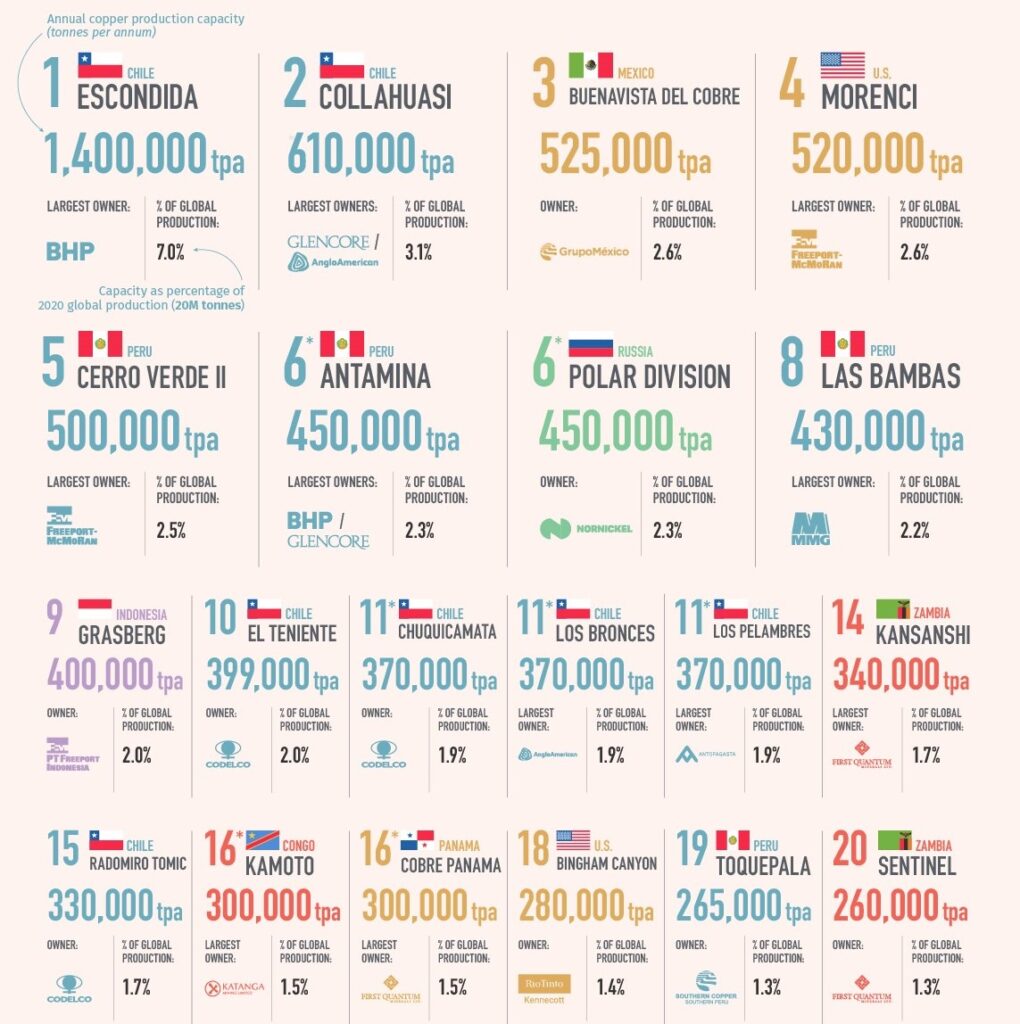
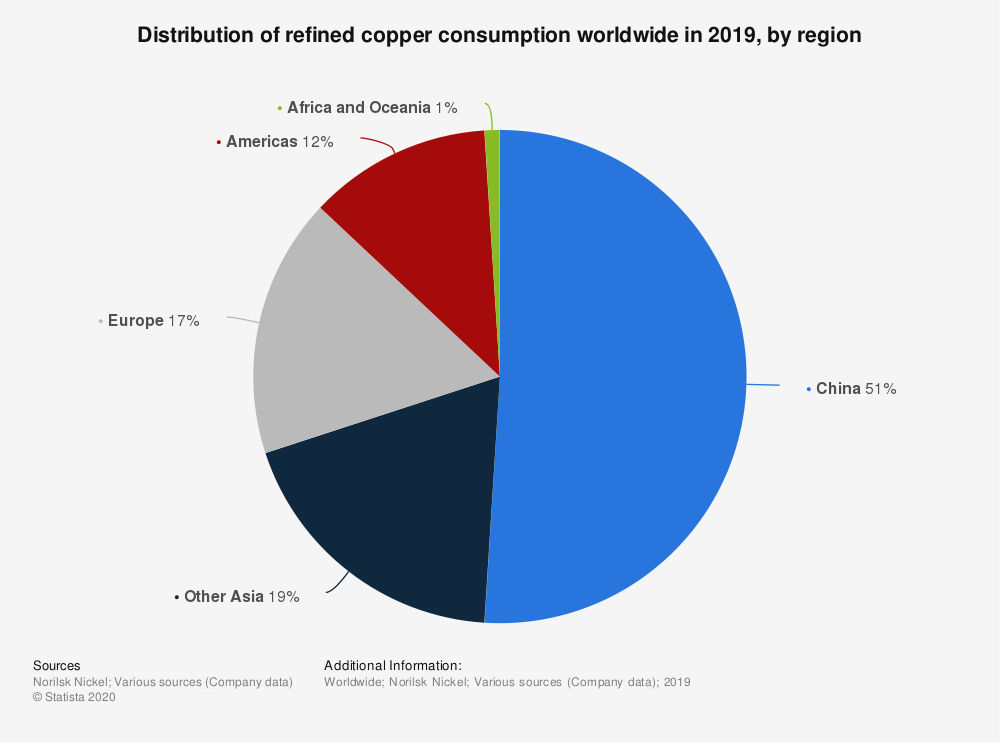
Major copper production is concentrated in South America, with Chile and Peru being the primary producers, followed by China as the world’s leading producer of refined copper. However, the global supply of copper can be easily disrupted due to its diverse geographic origins and the involvement of developing countries as key suppliers. This vulnerability, combined with high demand from various industries, contributes to the highly liquid and volatile nature of the copper market.
The Largest Copper Mines in the World by Capacity by elements.visualcapitalist.com
What is Copper Trading?
Copper trading capitalises on the market’s volatility and liquidity, offering opportunities for profit through speculation and price fluctuations. However, it’s crucial for traders to be aware of the factors that influence copper prices.
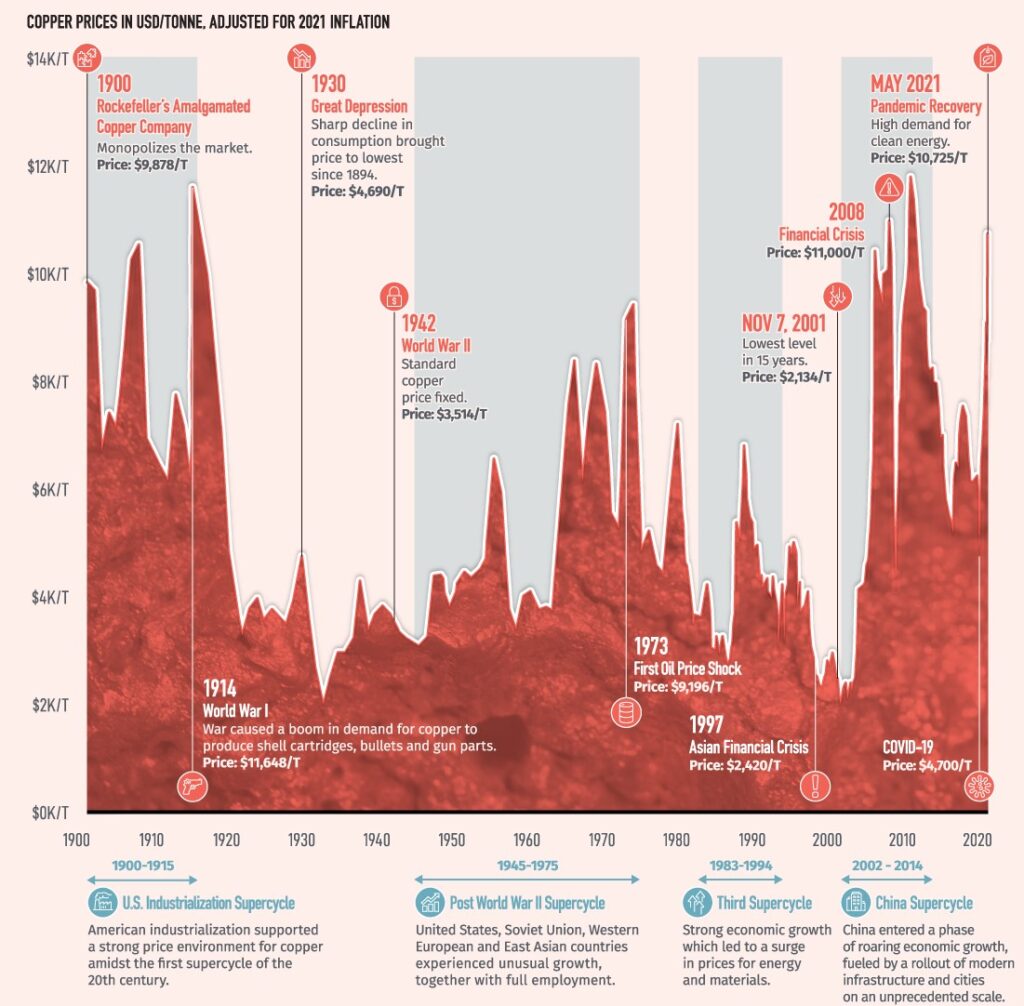
Copper serves as a reliable indicator of global economic health due to its strong connection to infrastructure development. During periods of economic growth, investments in major infrastructure projects drive up the demand for copper. Conversely, economic downturns often result in a decline in copper prices as construction and infrastructure projects are put on hold.
In addition to global economic trends, several other factors impact copper trading prices:
Supply disruptions: Since most copper production comes from developing countries, political, social, or economic upheavals in these regions can quickly disrupt global supply chains. Changes in labour laws or nationalization efforts, as observed in Bolivia in 2006, can lead to significant price fluctuations.
Emerging markets: The rise of new markets with substantial investments in infrastructure development drives increased demand for copper. As these emerging markets experience growth, copper prices tend to rise. Conversely, when growth slows down, copper prices can predictably decline.
Material substitutions: The market rarely tolerates a continuous rise in copper prices. As copper becomes more expensive, manufacturers and investors seek cheaper alternatives to reduce costs. Substitutes like aluminium, nickel, and lead are utilized until copper prices become more affordable. Traders should be cautious of potential shifts in demand caused by material substitutions.
US housing market: The sheer scale of the US housing market plays a pivotal role in copper demand. Copper is extensively used in electrical wiring and plumbing for housing construction. Therefore, when the US housing market experiences growth, copper demand follows suit.
source: Winton, USGS, University of Wisconsin, Forbes, U.S. Federal Reserve, Roskill
Advantages of Trading Copper
Traders choose to invest in copper for several reasons:
Safe haven investment: Copper is considered a physical commodity that retains its value even during economic downturns. Consequently, it is often viewed as a safe haven investment alongside assets like gold.
Portfolio diversification: Adding copper to an equity-focused portfolio helps diversify holdings and reduce overall volatility. By including a commodity like copper, traders can benefit from a more balanced investment approach.
Inflation hedge: Copper’s value is not tied to any specific currency, allowing it to retain its worth in the face of inflation. Many traders utilize copper as a hedge against inflation, protecting their portfolios from the eroding effects of rising prices.
Speculation opportunities: The liquidity and volatility of the copper market create opportunities for traders to profit through copper CFDs (Contracts for Difference). While high speculation can yield substantial rewards, it also carries inherent risks.
Getting Started with Copper Trading in Four Steps
If you are interested in trading copper, follow these four steps to get started:
Step 1. Select the CopperAsset
While copper bullion and coins can be traded, most copper trading occurs through futures contracts, CFDs, and ETFs. You can choose from various copper futures markets, such as COMEX copper on the New York Mercantile Exchange or LME copper on the London Metal Exchange. Consider the trading hours of different exchanges when monitoring your positions.
Step 2. Choose YourTradingMethod
Copper futures typically involve physical delivery, which may not suit all traders. Derivative products like copper CFDs provide an alternative by allowing traders to speculate on the price difference between opening and closing positions without owning the underlying asset. Copper CFDs offer leverage, enabling traders to trade with a fraction of the total asset value and potentially amplify both profits and losses.
Step 3. Establish a RiskManagementStrategy
Given the potential for magnified losses in leveraged trading, it’s essential to have a risk management strategy in place. Utilise tools like stop-loss orders and limit close orders to automatically close positions when they reach predetermined thresholds for acceptable losses or profits.
Step 4. Open YourFirstCopperTrade
Download a powerful trading platform like MetaTrader 4 or its upgraded version, MT5, to execute trades quickly and gain a transparent view of the market.
sources: Norilsk Nickel, Various sources (Company Data), Statista 2020
Understanding Different Copper Markets
The strategies employed in copper trading depend on the type of market you are dealing with. Generally, two types of markets exist: trending and consolidating.
Trending markets are characterized by significant price fluctuations and volatility. These markets align with the beginning and end of copper market cycles, where increased demand or the completion of large infrastructure projects impact prices.
Consolidating markets, on the other hand, exhibit more stability. They indicate a balance between supply and demand and tend to keep prices within defined support and resistance levels. Despite the relative stability, consolidating markets still offer traders opportunities for profits through short-term movements.
Start Trading Copper with VT Markets
VT Markets provides a comprehensive trading environment for copper and a wide range of other instruments across various asset classes. Backed by advanced trading tools, in-depth analysis, expert advisors, and technical signals, VT Markets enables traders to open and close copper trading positions effectively.
Whether you are a seasoned trader or just beginning your trading journey, VT Markets offers exceptional client services and the necessary resources to support your portfolio building and trading aspirations.
Summary:
Copper is a widely used commodity with applications in various sectors, known for its conductivity properties.
Major copper production is concentrated in South America, primarily Chile and Peru, followed by China.
Copper trading takes advantage of market volatility and liquidity, with prices influenced by factors such as global economic trends, supply disruptions, emerging markets, material substitutions, and the US housing market.
Advantages of trading copper include its safe haven status, portfolio diversification, inflation hedge, and speculation opportunities.
Different copper markets include trending markets (with significant price fluctuations) and consolidating markets (with more stability).
Getting started with copper trading involves selecting a copper asset, choosing a trading method (such as futures contracts or CFDs), establishing a risk management strategy, and using a trading platform like MetaTrader.