U.S. equities bounced back as the Initial Jobless Claims showed higher than the previous number, which is a sign that the inflationary pressures are still around, and the Fed may keep rates higher. On Friday, the data releases include producer prices and the University of Michigan’s consumer sentiment reading will be the turning point for the stock market of this week. The Dow Jones Industrial Average has raised 0.55% to close at 33781.48. The S&P 500 raised 0.75% to close at 3963.51.
The tech-heavy Nasdaq Composite raised 1.13% to close at 11082. The Dow rose was due to tech rebounded, shrugging off a climb in Treasury yields as investors looked ahead to data due Friday expected to show a further easing in inflation. Treasury yields rose, U.S. 10-year treasury yield sits at around 3.485%. The policy-sensitive 2-year treasury yield sits at 4.315%.
This Friday, after US shares, posted their first gain this month, with traders awaiting key inflation figures in China and the US. Oil rose at the open in Asia after tapping a fresh one-year low in a volatile session on Thursday.

The CPI, PPI, NFP, and Pre-Fed sentiment keeps DXY bulls hopeful even as downbeat US data since mid of November, risk-on mood favour bears. The dollar remained lower versus its major counterparts as the geopolitics-driven appetite for haven investments faded. The Australian and New Zealand dollars held gains from overnight in early Asian trading. However, the greenback’s gauge versus the six major currencies braces for the first weekly gain in three ahead of the key US consumer-centric data.

Main Pairs Movement
The US dollar’s consecutive losses since Wednesday, the release of U.S. Initial Jobless Claims on Thursday adds another resistance on the hawkish side, though the number was too high and overestimated, it is still higher than the previous, which is taken as negative/bearish for the USD. Meanwhile, the consensus is for China’s inflation indexes to have headed down last month, though the market investors expect a pickup as the economy reopens.
EUR/USD continues its strength and keeps winning, and this pair is eying more upside towards a weekly high at 1.0600 amid a cheerful market mood. EUR/USD is eying more upside towards a weekly high at 1.0600 amid a cheerful market mood and looking for stability at this point.
The Gold price extends a three-day uptrend, thanks to the firmer sentiment, and downbeat United States statistics weighed on the US Dollar. Not only due to the Fed policy and statement, China is one of the world’s key Gold consumers, with its new rules about coronavirus, but the China Consumer Price Index (CPI) is also looking optimistic, the gold price is with the scheduled top-tier readings from China and the United States.
Technical Analysis
EURUSD (4-Hour Chart)

EURUSD continued its rallying trend from a low of 1.0458 this week to a high of 1.0563 on the day. The rising trend came from the diminishing expectations for the Fed to keep raising interest rates at the same aggressive pace. Weekly initial jobless claims rose to 230K, as expected, continuing claims, however, jumped to 1.671M, exceeding the forecast of 1.6M. The initial jobless claims reports showed signs that the labour market is slowing down. The European Central Bank is set to announce interest rate decisions next week and is expected to fight against stubbornly high inflation. “At the next week’s meeting, we expect the ECB to deliver a 50bp rate hike with a hawkish twist. Specially, we expect the ECB to present key principles of the end to reinvestments under the Asset Purchase Program process and an open-ended wording for more rate hikes to come. This will be a compromise, which we believe will be palatable to both hawks and doves.” analysts at Danske Bank said.
While on the front side of the daily trendline, EUR/USD bulls are firming from near 1.0480 support and are taking on resistance around 1.0570. A break there opens the risk of a move in EUR/USD beyond 1.0600. A move in EUR/USD below the trendline, however, will expose supports near 1.0490 and 1.0440 and open prospects of a deeper correction towards 1.0400. Bulls are defending the downside at around 1.0490, with little chance of a bearish breakout at the time. The following support positions will head south to around 1.031.
Resistance: 1.06
Support: 1.031, 1.0265
GBPUSD (4-Hour Chart)

GBPUSD has extended its gains from the previous trading day and traded higher again throughout Thursday’s trading. Cable is expected to ebb around the 1.2 price region ahead of next week’s major monetary policy decisions by the two central banks. The Fed FOMC will announce its interest rate decision during the late American trading session on the 14th; whereas, the Bank of England will announce their interest rate decision during the late European trading session on the 15th. Both countries also have CPI data scheduled to be released next week. U.S. equities have turned positive throughout Thursday’s trading, thus allowing the Dollar to retreat slightly and pushing the British Pound higher against the Greenback.
On the technical side, GBPUSD continues to float slightly below our previously estimated resistance level of 1.23. Near term support level for the pair remains at 1.177. Any upside or downside shock from the BoE or FOMC next week could quickly destroy the recovery path of Cable, which began around late September. RSI for the pair sits at 63.36, as of writing. On the four-hour chart, GBPUSD currently trades above its 50, 100, and 200-day SMA.
Resistance: 1.2400, 1.2600
Support: 1.2154, 1.1927, 1.1765
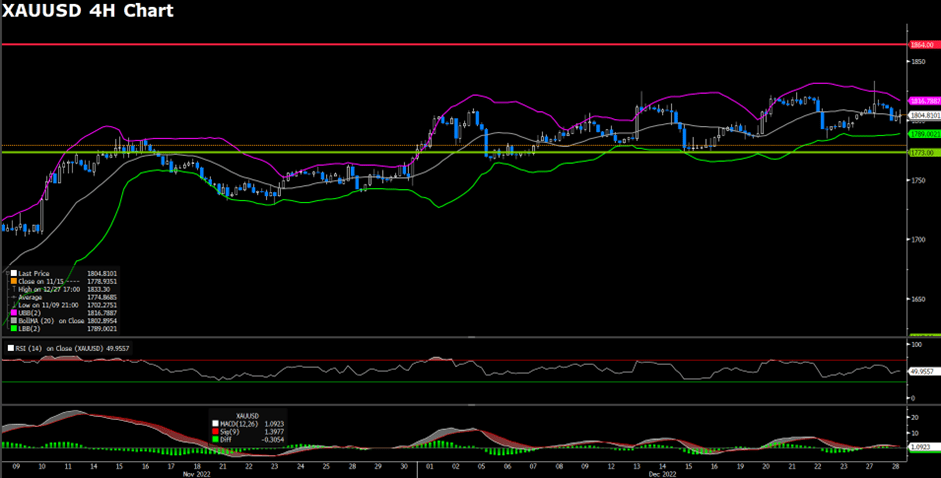
XAUUSD (4-Hour Chart)

Gold has entered its third straight day of gains amid a broadly weaker U.S. Dollar. Risk on sentiment across equity markets on Thursday weighed on the U.S. Greenback and allowed the Dollar-denominated Gold to climb higher. Sideways trading of the precious metal is expected for the yellow metal as market participants will be heavily invested in next week’s FOMC interest rate decision and how the decision will impact the Greenback. Geopolitical tensions around the world continue to buoy Gold at above the $1700 per ounce price level. Despite winter nearing, Russia’s invasion of Ukraine shows no signs of slowing down. The Kremlin has engaged in a 1-to-1 prisoner swap with the U.S. government to regain one of the more influential arms dealers—Victor Bout.
On the technical side, XAUUSD currently hovers slightly below our previously estimated short-term resistance level of $1800 per ounce. The short-term support level for Gold settles around the 61.8% Fibonacci retracement level of $1783 per ounce. RSI for the pair sits at 56.78, as of writing. On the four-hour chart, XAUUSD currently trades above its 50, 100, and 200-day SMA.
Resistance: $1800
Support: $1766, $1735
Economic Data
| Currency | Data | Time (GMT + 8) | Forecast |
| EUR | ECB President Lagarde Speaks | 02:00 | – |
| USD | PPI (Nov) | 21:30 | 0.2% |