US Dollar burden from Fed scaling back monetary tightening

US stocks rallied on Friday, regaining upside momentum and ended a turbulent week with a sizable gain as the economic data suggested that the Federal Reserve’s battle against inflation is making progress. Investors have already priced in a 0.75% hike by the Fed in December, but the increasing rumours about the possibility of scaling down monetary tightening in December are weighing on the US dollar and providing support to the equity markets. The market now expects that the Federal Reserve might start softening its monetary tightening pace over the next months.

On the economic data side, the US annual Core PCE inflation rose to 5.1% every year in September, which came slightly lower than market expectations of 5.2%. In the Eurozone, estimations for further tightening by the European Central Bank are warranted as the inflation in Germany for October increased by 10.4% YoY and came in higher than market expectations. Some ECB speakers also commented that interest rates are still low and the ECB will decide on interest rate increases, meeting by meeting.

The benchmarks, S&P 500 and Dow Jones Industrial Average both advanced on Friday as the S&P 500 notched their longest weekly rising streak since August amid gains in big-tech companies including Microsoft Corp. and Google parent Alphabet Inc. The S&P 500 was up 2.5% daily and the Dow Jones Industrial Average also advanced higher with a 2.6% gain for the day. Ten out of eleven sectors in the S&P 500 stayed in positive territory as the Information Technology sector and the Communication Services sector are the best performing among all groups, rising 4.52% and 2.98%, respectively. The Nasdaq 100 climbed the most with a 3.2% gain on Friday and the MSCI World index was down 0.3% for the day.

Main Pairs Movement

The US dollar edged higher on Friday, touching a daily high above the 111.0 mark but then failed to preserve its upside during the US trading session amid further action warranted by the Fed. The core Personal Consumption Expenditure (PCE) jumped above August’s figures, which further justified the case for the Fed’s 75 bps interest-rate hike at the November meeting and acted as a tailwind for the safe-haven greenback.

GBP/USD advanced on Friday with a 0.43% gain after the cable refreshed its daily high above the 1.161 mark as the rumours of Fed pivoting are keeping USD bulls on a leash. On the UK front, Prime Minister Rishi Sunak and Chancellor Jeremy Hunt are working on reducing the piled debt of the UK to bring financial stability. Meanwhile, EUR/USD was nearly unchanged on Friday and rebounded slightly after retreating from a daily high near the 1.000 mark amid renewed US dollar weakness. The pair was up almost 0.03% for the day.

Gold declined with a 1.11% loss for the day after refreshing its daily low near the $1,640 level during the US trading session, as the Core PCE data underpinned the US dollar and exerted bearish pressure on the precious metal. Meanwhile, WTI Oil retreated lower with a 1.32% loss for the day after dropping to a daily low of around $87.4 area. But the EU’s oil embargo should lend support to oil prices.

Technical Analysis

EURUSD (4-Hour Chart)

The EURUSD was little changed on Friday and continued to trade above 0.9950 at the moment of writing, as the dollar struggles to gather positive traction ahead of the weekend. The latest data from the US showed that core PCE inflation rose at a slightly softer pace than expected in September and that Pending Home Sales declined by 10.2%. Apart from that, EURUSD has reversed its direction to the downside as investors assess the European Central Bank’s (ECB) monetary policy decisions and communication.  As widely expected, the ECB raised its key rate by 75 basis points (bps) following the October policy meeting. The ECB president Christine Lagarde did not provide any details regarding a potential quantitative tightening move during the press conference, and she avoided committing to a specific size of a rate hike in December. On the data side, although the German Gross Domestic Product expanded at an annual rate of 1.2% in the third quarter, more than the expected 0.8%, it failed to underpin the European currency.

From the technical perspective, the four-hour scale RSI indicator 52 figured as of writing and turned weak compared to days ago, suggesting the bullish momentum has been lost and is ready to get into the consolidation phase. As for the Bollinger Bands, the pair dropped below the 20-period moving average and priced at a lower area, indicating the pair has no clear pressure direction and would put into sideways in the near term.

Resistance:  1.0093, 1.0198

Support: 0.9857, 0.9749, 0.9661, 0.9554

GBPUSD (4-Hour Chart)

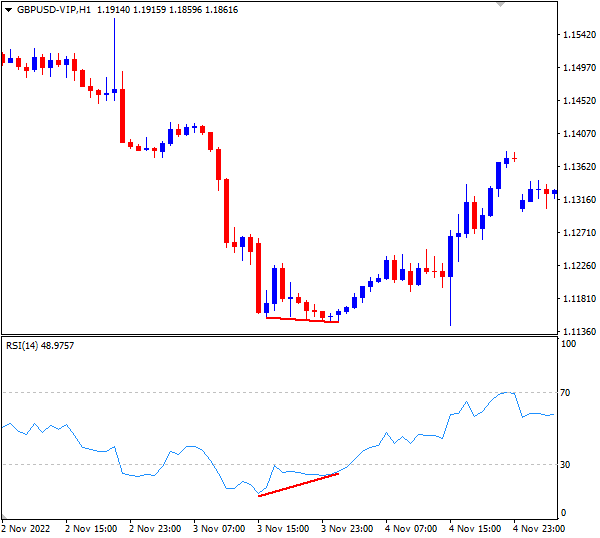
The GBPUSD edged higher above the 1.1550 area in the second half of the day on Friday as the US dollar lost on the softer-than-expected Core PCE inflation and disappointing Pending Home Sales data for September.  The US Bureau of Economic Analysis’s report showed that US Core PCE Price Index declined from the previous 0.6% to 0.5% monthly rate in September, slightly softer than the market expected. However, the Pending Home Sales data for September reads -10.2%, far from the -5.0% forecast. These figures improved market mood and acted as a tailwind to help the pound hold its ground. Meanwhile, the European Central Bank (ECB) President Christine Lagarde’s dovish tone in the press conference following the bank’s decision to raise key rates by 75bps helped the British pound capture some of the capital outflows out of the euro.

From the technical perspective, the four-hour scale RSI indicator 59 figured as of writing, suggesting the upside traction was weaker as RSI fell from near 70. As for Bollinger Bands, the pair was priced just above the 20-period moving average and the gap between upper and lower bands get closer, signalling the positive movement turned. Hence, we think GBPUSD would slightly edge higher and challenge the resistance of the 1.1639 level in the short term.

Resistance: 1.1639, 1.1738

Support: 1.1250, 1.1071, 1.0953, 1.0392

XAUUSD (4-Hour Chart)

Gold price records a fresh three-day low spurred by a strong US Dollar. XAUUSD had a further decline and now was trading at the $ 1643 mark as stubbornly high US inflation was reported namely the Core Personal Consumption Expenditures (PCE), the Federal Reserve’s favourite gauge of inflation, which increased more than estimates, bolstering the US dollar.  Under the backdrop, the so-called Fed pivot narrative could be discarded as inflation remains at its extremely high level and salaries are rising, despite the Federal Reserve’s effort to tame the runaway inflation. Furthermore, US Treasury yields, namely the 10-year benchmark rate, recover five basis points up at 3.973% and Wall Street holds to gains amidst a decent earnings season, keeping US equities in the green, which undermined the non-yields yellow metal situation. The market participants turn to the next week’s Federal Reserve Open Market Committee (FOMC), in which most analysts expect the Fed to hike rates by 75bps, as reported by the CME FedWatch Tool, with speculations at an 84.5% chance.

From the technical perspective, the four-hour scale RSI indicator 39 figured as of writing, suggesting the gold amid heavy selling pressure which would persist until RSI fell to 30, an oversold region. As for Bollinger Bands, the pair was pricing around the lower band and the size between upper and lower bands remained unchanged, signalling that bearish momentum slow its pace. Therefore, we think XAUUSD would move downward to test the $1626 support, if failed, then a rebound could be expected.

Resistance: 1675, 1700, 1726

Support: 1626, 1616, 1600

Economic Data

CurrencyDataTime (GMT + 8)Forecast
AUDRetail Sales (MoM)08:300.6%
CNYManufacturing PMI (Oct)09:3050.0
EURCPI (YoY)(Oct)18:009.8%

GDP expanded more than expected, signalling decreasing inflation

U.S. equities were mixed throughout yesterday’s trading. The Dow Jones Industrial Average gained 0.61% to close at 32033.28. The S&P 500 lost 0.61% to close at 3807.3. The tech-heavy Nasdaq Composite plunged 1.63% to close at 10792.68. The Dow Jones Industrial Average was able to close higher on Thursday after new data showed third quarter GDP grew faster than expected and hinted at waning inflation, encouraging some dip buying. Better-than-expected corporate earnings from McDonald’s and Honeywell led the Dow higher. The technology sector continues to take show signs of weakness as Amazon reported Q3 earnings, which came in below consensus estimates; furthermore, Amazon has lowered its Q4 forward guidance to a forecasted 2% growth instead of the 8%, projected during the earlier part of the year.

Apple delivered fiscal 2022 fourth-quarter earnings on Thursday as well. The tech giant delivered an earnings beat. Q4 EPS came in at $1.29, compared to the $1.27 analyst estimate. Revenue for Q4 was up 8.1%, year over year. Despite delivering a surprising earnings beat, Apple did not guide on its first fiscal quarter, which ends in December and contains Apple’s biggest sales season of the year. Apple’s CEO, Tim Cook, has also cited the volatile foreign exchange market, which saw the Dollar soaring against all currencies, as a headwind that significantly reduced Apple’s Q4 performance.

The benchmark 10-year treasury yield has continued to retreat below 4%. The index was last seen trading at 3.922%.

U.S. GDP(QoQ) of Q3, 2022 will be announced on Thursday, Oct 27, given the persistently challenging environment, with historically high energy costs and rapidly rising interest rates, as the very high inflation, especially in food and household costs, we have less optimistic about GDP forecast.

Main Pairs Movement

The Dollar index rose 0.06% throughout yesterday’s trading. The better-than-expected U.S. Q3 GDP provided a boost to the U.S. Greenback. However, the initial jobless claims figures, which came in below market consensus at 217K, countered some of the gains as market participants interpreted the figure as a sign of a slowdown in the economy.

EURUSD lost 1.15% throughout yesterday’s trading. The ECB announced a 75 basis point interest rate hike on all three of its leading rates, but the accompanying economic outlook, provided by the ECB, weighed on the Euro.

GBPUSD lost 0.48% throughout yesterday’s trading. Higher demand for the Dollar worked against the Pound. Cable was last seen trading just below the 1.16 level.

Gold dropped 0.11% throughout yesterday’s trading. The non-yielding metal fared worse against the rising Dollar as short-term interest rate expectations continue to rise.

Technical Analysis

EURUSD (4-Hour Chart)

The EURUSD gathered extra downside traction below parity in the early US trading session after having reached its highest level since mid-September at around 1.0100 during the Asian trading hours.  The selling bias in the single currency grabbed extra impulse and forced EURUSD to break below the key parity level on Thursday. Apart from that, European Central Bank (ECB) walked the talk and hiked rates by 75 bps at its event on Thursday, as widely anticipated.  The ECB reiterated that it intends to keep raising rates to endure inflation returns to the bank’s 2% target, and added that it will reinvest principal payments from maturing securities at least until the end of 2024. In the meantime, price action around the European currency is expected to closely follow dollar dynamics and the Fed-ECB divergence. However, the resurgence of speculation around a potential Fed’s pivot seems to have removed some strength from the latter.

From the technical perspective, the four-hour scale RSI indicator fell back from above 70 levels and 55 as of writing, suggesting the pair confronted some selling pressure. As for the Bollinger Bands, EURUSD dropped from the upper band to near the 20-period moving average level, signalling the pair was dragged lower by a heavy downside traction

Resistance:  1.0098, 1.0191

Support: 0.9753, 0.9667, 0.9549

GBPUSD (4-Hour Chart)

The GBP/USD pair has reversed its direction and edged lower below 1.1600 in the US trading session as investors adopted a cautious stance, the greenback stays resilient against its rivals as a safe haven and causing the pair to stay on the back foot. The US dollar makes a solid comeback and rebounds swiftly from over a one-month low touched earlier this Thursday, which exerts some downward pressure on the pounds. The critical factors helping revive demand for the USD are a goodish pickup in the US Treasury bond yields and better-than-expected US GDP reports. The US Bureau of Economic Analysis reported that the world’s largest economy grew by 2.6% annualized pace during the third quarter, beating estimates pointing to a reading of 2.4%. In addition, the US weekly Jobless Claims rose from 214K to 217K during the week ended October 21, though was better than market expectations for 220K. In the domestic, the optimism over the appointment of the new UK Prime Minister Rishi Sunak acts as a tailwind for the British pound.

From the technical perspective, the four-hour scale RSI indicator fell from 70 to 63 on Thursday, suggesting the short-term correction might have begun or the cable price would get into the consolidation phase. As for the Bollinger Bands, the GBPUSD wandered in a small range from 1.1550 to 1.1655 after falling back from the upper band, signalling the pair now had no clear direction. Therefore, we think the pounds need to break through the 1.1655 resistance and persist in the rallied traction, or a strong follow-through selling could be expected.

Resistance: 1.1714, 1.1853

Support: 1.1439, 1.1276, 1.1131

XAUUSD (4-Hour Chart)

The XAUUSD fluctuate in a relatively tight range at around the $1660 mark in the second half of the day on Thursday, as the US dollar gains positive traction despite falling US Treasury yields. Gold was priced at $1,661 marks as of writing. The DXY index rebounded from its lowest level since September 20, which acts as a headwind for the dollar-denominated metal.  On the data side, the release of the US Advance Q3 GDP, which exceeds estimates, with the economy growing by 2.6%, above 2.4% estimates, entering into positive territory, following Q1 and Q2 contractions. The readings capped the upside room for the yellow metal and might comfort Fed officials, which forced investors to trim their bets for less aggressive rate hikes.  In the Eurozone, the European Central Bank (ECB) added another 75 bps rate hike to the deposit rate, which stands at 1.50%. The ECB president, Christine Lagarde, commented that the central bank would be data-dependent and take policy decisions “meeting by meeting”, which bolstered the US dollar.

From the technical perspective, the RSI indicator fell from nearly 70 to 53 as of writing, suggesting the gold was surrounded by negative traction. As for the Bollinger bands, the yellow metal was supported by a 20-period moving average and the gap between the upper and lower bands get closer, implying the XAUUSD’s bearish momentum would persist if drop below $1640 support or would put into a sideway in the near-term.

Resistance: 1675, 1700, 1726

Support: 1642, 1616, 1600

Economic Data

CurrencyDataTime (GMT + 8)Forecast
JPYBOJ Monetary Policy StatementTentative 
JPYBOJ Outlook Report (YoY)Tentative 
JPYBOJ Press ConferenceTentative 
EURGerman GDP (QoQ) (Q316:00-0.2%
RUBInterest Rate Decision (Oct)18:307.50%
EURGerman CPI (YoY)20:0010.1%
USDCore PCE Price Index (MoM) (Sep)20:300.5%
CADGDP (MoM) (Aug)20:300.1%
USDPending Home Sales (MoM) (Sep)22:00-5.0%
EURECB President Lagarde Speaks22:15 

服务器升级维护通知

尊敬的用户:

您好!

VT Markets 致力于为客户提供更快速且稳定的交易环境,我们将于周末进行服务器 (MT4/MT5) 升级维护。

维护时段: 2022 年 10 月 29 日 (星期六) 07:00 至 11:00

上述时段采用 GMT+8 时区

请您务必留意下列事项:

1. 周末服务器报价将会暂停,客户将无法于维护期间建立新仓位或是关闭既有持仓。

2. 维护前后的市场价格可能发生跳空,在跳空范围内的挂单或止损/止盈设置将在维护结束后的市场价格成交。

3. 客户后台相关功能将可能会于维护期间受到影响。

4. 具体维护完毕与开盘时间请依据MT4/MT5软件为准。

望您谅解因此次升级维护为您所带来的不便,我们将继续为您提供更优质的服务。

如您有任何疑问,我们的团队将十分乐意为您解答。
请留言或发邮件至 [email protected] 或联系在线客服。

ECB expected to raise 75bps

U.S. equities rose for the third consecutive session. The Dow Jones Industrial Average rose 0.01% to close at 31839.11. The S&P 500 dropped 0.74% to close at 3830.6. The tech-heavy Nasdaq Composite dropped 2.04% to close at 10970.99. The knock-on effect from the tightened grip of  Chinese President Xi in China continues, and the U.S. stock, Greenback goes and short-term treasury goes lower. U.S. 10-year treasury yield continues to retreat to around 4%. The yield was last seen trading at 4.015%. The policy-sensitive 2-year treasury yield sits at 4.422%.

The ECB Monetary Policy Decision Statement released today will have a strike on Euro with the dovish hike, since the rumour says there will be a 75 bps raise, it may cause a signal to loosen policy and an opportunity for DXY. If the ECB is hawkish about the inflationary outlook of the economy and rises the interest rates it is positive for the EUR.

The US GDP(Q3) comes up today will represent the overall economic activities after the adjustment of inflation, it is predicted there will be a 2.4% growth rate, and if the result is lower than estimates, the DXY may be undermined and this might be the case given the overall trends of high inflation and rising interest rates weighing on investor confidence.

U.S. GDP(QoQ) of Q3, 2022 will be announced on Thursday, Oct 27, given the persistently challenging environment, with historically high energy costs and rapidly rising interest rates, as the very high inflation, especially in food and household costs, we have less optimistic about GDP forecast.

Main Pairs Movement

The Dollar index dropped 0.03% throughout yesterday’s trading. The U.S. Greenback faced strong selling pressure with the drop of Treasury yields fell on Wednesday along with the dollar, which was under pressure against major peers, also the up-day for the S&P 500  leaves the DXY vulnerable. The optimism in the Europe market and the higher stocks, lift European currencies, both leading DXY to a sensitive market.

EURUSD gained 0.02% throughout yesterday’s trading. The shared currency kept going higher and came to its highest in Oct, it is expected to remain in the grip of bulls ahead of the interest rate decision by the European Central Bank which may announce a rate hike by 75 basis points.

GBPUSD gained 0.05% throughout yesterday’s trading. With its latest Prime Minister, Rishi Sunak being appointed, IMF and the British are positive about the economic stability and the decline of the debt.

Gold dropped 0.02% throughout yesterday’s trading. The non-yielding metal took advance against the Dollar as treasury yields retreated.

Technical Analysis

EURUSD (4-Hour Chart)

The EUR/USD pair regained parity on Wednesday, surging to a fresh one-month high above 1.0075 as the Fed expects to slow the pace of its aggressive interest rate hike policy. The dollar’s sell-off picked pace without a clear catalyst, although easing US Treasury yields and gains among stock markets added to the greenback’s weakness. Moreover, tepid US data and mounting speculation the US Federal Reserve will slow the pace of quantitative tightening added to the bearish picture for the US dollar. The US will publish the preliminary estimate of its Q3 Gross Domestic Product, expected to show that the economy grew at an annualized pace of 2.4% in the three months to September. Domestic, the European Central Bank will announce its monetary policy decision, with the central bank seen pulling the trigger by 75bps for a second consecutive meeting.

From the technical perspective, the RSI indicator 74 figured as of writing, suggesting that the pair is amid strong bullish momentum, and investors should be aware of any pullback until the RSI get out of the overbought zone. As for the Bollinger Bands, the EURUSD was priced above the upper band and the gap between upper and lower bands became larger. We think it is a signal that the strong upside tendency would persist in the near term unless the price fell below 0.9990 support.

Resistance:  1.0201, 1.0356

Support: 0.9990, 0.9853, 0.9753, 0.9667

GBPUSD (4-Hour Chart)

The GBP/USD pair surged higher on Wednesday, being surrounded by heavy bullish momentum and touched a fresh six-week high above the 1.1600 mark as investors scaled back their expectations for a more aggressive policy tightening by the Fed. At the time of writing, the cable stays in positive territory with a 1.23% gain for the day. Investors are reassessing the Fed’s policy outlook following a batch of disappointing macroeconomic data releases, which weighed heavily on the benchmark 10-year US Treasury bond yield and helped the GBP/USD pair to find demand. The weaker US macro data this week have pointed to signs of a slowdown in the US economy and might force the Fed to soften its hawkish stance. For the British pound, the appointment of Rishi Sunak as the new British PM continues to underpin the GBP/USD pair as he pledges to fix mistakes by the Truss administration and boosts investors’ confidence.

For the technical aspect, the RSI indicator is 70 figures as of writing, suggesting that the pair could make a downward correction in the short term as the RSI climbed above 70. As for the Bollinger Bands, the price moved out of the upper band, therefore a strong continuation of the uptrend can be expected. In conclusion, we think the market will be bullish as the pair could extend its rally to the next resistance at the 1.1714 mark. A sustained strength beyond that level might trigger a short-covering rally and allow the GBP/USD pair to reclaim the 1.1800 mark.

Resistance: 1.1714, 1.1853

Support: 1.1439, 1.1276, 1.1131

XAUUSD (4-Hour Chart)

The XAUUSD gains strong positive traction on Wednesday and rallied to a nearly two-week high, around the $1675 mark region during the first half of the European session. The intraday bullish movement is exclusively sponsored by the heavily offered tone surrounding the US dollar, which tends to benefit the dollar-denominated metal. The US dollar hits a one-month low amid diminishing odds for a more aggressive policy tightening by the Fed. The dismal US macro data released on Tuesday pointed to deteriorating growth in the world’s largest economy and might force the US central bank to soften its hawkish stance. Moreover, the US treasury bond yields had a further decline during the early US session, which continued to weigh on the buck and underpinned the non-yielding yellow metal. However, Fed is still expected to raise interest rates shortly to tame the runaway inflation. Apart from Fed, other major central banks are also likely to deliver a jumbo rate hike at the upcoming policy meetings. This might hold back the traders from placing aggressive bullish bets around gold.

From the technical perspective, the RSI indicator  60 figured as of writing, implying that the yellow metal was moving up amid an upbeat market mood. The bullish momentum would persist until the RSI hit above 70, the overbought zone. As for the Bollinger Bands, the XAUUSD was pricing around the upper band and the gap between upper and lower bands became closer, indicating that the price would continue with low volatility.

Resistance: 1675, 1700, 1730

Support: 1642, 1622, 1616

Economic Data

CurrencyDataTime (GMT + 8)Forecast
JPYBOJ Outlook Report (YoY)11:00 
EURDeposit Facility Rate (Oct)20:151.50%
EURECB Marginal Lending Facility20:15 
EURECB Monetary Policy Statement20:15 
EURECB Interest Rate Decision (Oct)20:152.00%
USDCore Durable Goods Orders (MoM) (Sep)20:300.2%
USDGDP (QoQ) (Q3)20:302.4%
USDInitial Jobless Claims20:30220K
EURECB Press Conference20:45 
EURECB President Lagarde Speaks22:15 

部份产品可交易时间变更通知

尊敬的用户:

您好!

由于英国欧洲区2022年10月31日自夏令时切换为冬令时

部份受影响产品的交易时间将会有所调整,请查看如下:

如您有任何疑问,我们的团队将十分乐意为您解答。
请留言或发邮件至 [email protected] 或联系在线客服。

Intermediate 8: How to use oscillator indicators

Traders often seek indicators to help them determine when they should enter the market. A crucial piece of information for traders is an estimate of how far the market is likely to move before it reaches an area of congestion.

The problem is that many traders spend their time waiting for the market to give them clear direction and hoping that the price will continue. But because there are many opportunities for this “temporary” movement, you will get the best results if you know when the price will stop for a moment—which means you have time to react.

One tool that traders can use to forecast a market’s level of fullness and determine when to sell their positions and buy new ones is called the Oscillator. Oscillators indicate when the market is oversaturated and ready for a reversal. The oscillator shows overbought or oversold levels.

When the oscillator is in the overbought area, it signals that the market is experiencing a surge in demand, and traders should be ready to exit their positions and wait for better moments. When the oscillator is in the oversold area, sellers have become weak, and the downtrend is likely to be oversaturated. This suggests that a bullish reversal might be possible.

However, an oscillator does not always accurately reflect price movement. Traders must be aware that the oscillator reading may be misleading and that a position may have changed even if the oscillator is moving similarly.

In MetaTrader, numerous indicator oscillators are already available for use. The two oscillators that traders frequently use are: 

  • Relative Strength Index 
  • Stochastic Oscillator

The Relative Strength Index (RSI) is one of the traders’ most common technical indicators. In 1978, J. Welles Wilder developed the RSI to measure how fast and how much prices change. This indicator also helps traders know when the market is overbought or oversold, so they can buy at low prices and sell at high prices.

RSI: How to Use It

To add RSI to the chart, click Insert>Indicators>Oscillators>Relative Strength Index.

By default, MetaTrader provides you with 14 periods. You can change this setting however you want. Most traders with short-term objectives use the 9-period RSI, while traders with long-term goals prefer the 25-period RSI. The smaller the period, the more fluctuations the indicator will show.

What does the Relative Strength Index mean?

The Relative Strength Index fluctuates between 0 and 100. A middle line at 50 indicates that there is no trend. If the RSI is above 50, momentum is growing, so you should buy. If the RSI is below 50, bearish momentum will increase, so sell your assets before they decrease in value.

The market is either oversold or overbought. Like any other oscillator, the RSI helps traders know when an asset has been overbought or oversold. 

When the RSI goes above 70, it indicates that a market is overbought and could go down. When the RSI goes below 30, on the other hand, it shows that a market is oversold and could go back up.

However, this method is not recommended for trading when the Relative Strength Index (RSI) shows a trend toward overbought or oversold conditions. If the market trend is strong and appears to be continuing, it is best to sell even though the RSI is oversold during a downtrend or continue buying when the RSI is overbought.

When the indicator leaves a critical level, the quality of RSI signals usually improves, making them more effective when used in the direction of the trend.

For example, you could buy when the RSI is increasing above 30, and the price is in an uptrend.

Market reversal

When the RSI and the price don’t match up, it can signify that the market is about to change. When the price makes a new high, but the RSI fails to make a corresponding high, this is called a bearish divergence, typically considered a sign of weakness. On the other hand, a bullish divergence forms when the price makes a lower low, but the RSI does not.

Stochastic Oscillator

George C. Lane developed the Stochastic indicator in the late 1950s, and traders use it nowadays. This indicator compares the closing price to past values to measure market momentum. The price will close near the high in a bullish market, and in a bearish market, the low. 

The stochastic oscillator can show overbought or oversold market conditions and indicates a trend change as market momentum slows. Indicators can provide trading signals and suggestions.

Stochastic: How to use it.

MetaTrader has a built-in stochastic indicator. 

Click Insert>Indicators>Oscillators>Stochastic Oscillator to add it to the chart.

A Stochastic Oscillator can be used on any timeframe and can be customized to suit your individual trading system. Standard values are 5, 3, 3, while other popular parameter variations include 14, 3, 3 and 21, 5, 5. 

The 5-day EMA is often referred to as “Fast Stochastic”, as it reacts more quickly with price changes in the market than the slower 14-day EMA (“Slow Stochastic”). Full Stochastic is a hybrid of both EMAs and reacts to changes in both prices and time periods. You can pick the parameters for your own trading system based on your goal.

How does Stochastic Oscillator work?

The stochastic indicator ranges from 0 to 100 in percentage units (%). Two lines represent the indicator:

  • the fast line, also known as %K (solid green line)
  • the slow line, also known as %D. (dotted red line). 

The moving average of %K is the line %D. When the speed changes, these lines meet. When a fast-moving average crosses a slower one from below, it’s a sign to buy. Sell when it crosses a slower one from below.

Like other technical indicators, the Stochastic oscillator does not always provide accurate signals. If you want to improve the accuracy of its signals, there are two options.

Firstly, use the signals made when the crossover happens at the edges (above 80 for a sell signal and below 20 for a buy signal).

One way to trade using an indicator is to look at the longer-term trend on a chart and then trade based on that. For instance, if you are using stochastic on the TF H1 chart and looking at the longer-term trend on the H4 chart. If the uptrend looks strong and you do not want to listen to a sell signal because the price may stay in the overbought area for a long time, pay attention to buy signals that Stochastic gives you, and you may make money from trend trading.

Secondly, pay attention when the oscillator moves away from the price chart. When the price moves up but Stochastic makes a lower high, this is a sell signal (bearish divergence). Conversely, a buy signal shows up when the oscillator doesn’t confirm a new low price.

Earnings season continues to give equities a breather

U.S. equities rose for the third consecutive session. The Dow Jones Industrial Average rose 1.07% to close at 31836.74. The S&P 500 rose 1.63% to close at 3859.11. The tech-heavy Nasdaq Composite soared 2.25% to close at 11199.12. Equities were buoyed by the falling U.S Greenback and the retreating U.S. short-term treasury yield. The benchmark U.S. 10-year treasury yield has retreated from recent highs of above 4.2% to below 4.1%. The yield was last seen trading at 4.086%. The policy-sensitive 2-year treasury yield sits at 4.449%.

Earnings season continues to provide much-needed breathing room for equities. Coca-Cola and General Motors both reported earnings that were better than analyst estimates. Coca-Cola reported $0.69 EPS, beating the $0.64 EPS estimate. Revenue to the beverage giant came in at 11.1 billion Dollars for Q3. General Motors recorded $2.25 EPS, a 19.63% surprise from the analyst estimated $1.88 EPS. More importantly, GM did not adjust guidance for the year, providing a confidence boost to GM investors.

On the earnings calendar, Apple, Exxon Mobile, Ford Motor, and Credit Suisse are scheduled to release earnings this week.

U.S. GDP(QoQ) for Q3, 2022 will be announced on Thursday, Oct 27, given the persistently challenging environment, with historically high energy costs and rapidly rising interest rates, also the very high inflation, especially in food and household costs, we have less optimistic about GDP forecast.

Main Pairs Movement

The Dollar index dropped 0.99% throughout yesterday’s trading. The U.S. Greenback faced strong selling pressure amid the retreating 10-year treasury yield and better risk sentiment. Recent rumours regarding a more dovish Fed heading into the next FOMC interest rate decision have also triggered some selling amid the recent highs of the Dollar index.

EURUSD gained 0.9% throughout yesterday’s trading. The shared currency advanced against a weaker Dollar; however, strong economic headwinds still loom over the European economy and market participants’ optimism for a dovish Fed could be all but fictional.

GBPUSD gained 1.69% throughout yesterday’s trading. The British Pound surged as Britain welcomed its latest Prime Minister, Rishi Sunak. Personnel changes in the British government seem to have stabled the volatile Gilt market and thus the Pound.

Gold rose 0.21% throughout yesterday’s trading. The non-yielding metal took advance against the Dollar as treasury yields retreated.

Technical Analysis

EURUSD (4-Hour Chart)

The EUR/USD pair surged higher on Tuesday, gathering bullish momentum and refreshing its daily high above the 0.9970 mark in the US trading session amid dismal economic data in the US. The pair is now trading at 0.9958, posting a 0.86% gain daily. EUR/USD stays in the positive territory amid a weaker US dollar across the board, as the weaker-than-expected US housing prices and manufacturing data on Tuesday added to the concerns about the negative impact on the economy of the Federal Reserve’s radical tightening pace. Therefore, investors’ expectations of the Fed slowing the pace of tightening has exerted bearish pressure on the US dollar and lifted the EUR/USD pair higher. For the Euro, the better-than-anticipated economic data has acted as a tailwind for the shared currency, as the German IFO Business Climate Index eases to 84.3 in October and showed that the Business Climate remained stable. The European Central Bank will announce its latest monetary policy decision on Thursday.

For the technical aspect, the RSI indicator is 70 as of writing, suggesting that the pair is facing heavy buying pressure as the RSI reached the overbought zone. As for the Bollinger Bands, the price moved out of the upper band, therefore a strong continuation of the uptrend can be expected. In conclusion, we think the market will be bullish as the pair is heading to test the 0.9986 resistance line. The four-hour chart also reflects heavy buying interest as the technical indicators now sit at the overbought zone.

Resistance:  0.9986, 1.0038

Support: 0.9836, 0.9757, 0.9667

GBPUSD (4-Hour Chart)

The GBP/USD has surged from levels right above 1.1300 on Tuesday’s early US market session, rallying to 1.1500 where it seems to have found some resistance. In the domestic, the victory of Rishi Sunak in the Tory race and his pledge to restore economic stability are bringing back confidence to the markets, terrified with his predecessor’s economic plan. The re-appointment of Jeremy Hunt as chancellor of the exchequer has increased hopes that the next cabinet will be more market-friendly, which is acting as a tailwind for the British pound. On the other end, the weaker-than-expected US housing prices and consumer confidence data on Tuesday, as well as the downbeat S&P PMIs released on Monday are increasing concerns about the negative impact on the economy of the Federal Reserve’s radical tightening pace. Against this backdrop, the US dollar is losing ground against its main peers, with US Treasury Bonds dropping sharply. The benchmark 10-year yield tumbled from 4.25% earlier on Tuesday to 4.06%.

From the technical perspective, the RSI indicator is 67 on the four-hour scale as of writing, suggesting that the pounds amid strong upside tractions. As for the Bollinger Bands, the GBPUSD was breaking through the upper band, and the gap between upper and lower bands became larger, signalling that the bullish trend would continue in the near term.

Resistance: 1.1500, 1.1750, 1.1900

Support: 1.1120, 1.0953, 1.0632, 1.0392

XAUUSD (4-Hour Chart)

XAUUSD price advances early in the New York session, up by 0.33% courtesy of falling US Treasury yields, while bonds climb amidst the ongoing narrative in the markets that the US Federal Reserve might slow the pace of its rate hikes. All that said, the weakened US Dollar is a tailwind for the yellow metal. Gold was priced at $1657 as of writing. The sentiment is upbeat, as shown by global equities trading in the green. As previously mentioned, market players are positioning for a possible pivot, while economic data in the US continues to show further deterioration in the country, coupled with high inflation and lower bond yields, boosted gold prices. Data side, US economic data flashed that the housing market on Tuesday, as shown by housing prices cooling down due t higher mortgages, which climbed to almost 7%, as the Fed embarked on a tightening cycle trying to tame inflation. Further data revealed by Conference Board (CB), reported that Consumer Confidence dropped from 107.8 to 102.5, less than estimates of 105.9, decreasing for the second consecutive month.

From the technical perspective, the four-hour scale, and the RSI indicator 57 as of writing, suggest that the gold was in an upbeat mood and the bullish momentum would persist until RSI hit above 70, the overbought zone. As for Bollinger Bands, the gold price was hovering between the upper band and the 20-period moving average, indicating the yellow metal remains upside trend in the near term.

Resistance: 1682, 1715, 1730

Support: 1640, 1615, 1600

Economic Data

CurrencyDataTime (GMT + 8)Forecast
AUDCPI (QoQ) (Q3)08:301.6%
USDNew Home Sales (Sep)22:00585K
CADBoC Monetary Policy Report22:00 
CADBoC Interest Rate Decision22:004.00%
USDCrude Oil Inventories22:301.029M
CADBOC Press Conference23:00 

Intermediate 7: How to set a correct stop loss and avoid stop hunting

In a field where many praise continuous movement, many forget that pushing back is also a strategy. As a trader, your capital is your most valued asset and once it’s gone, it’s never coming back. Thankfully, there are ways to cut your losses and protect your profits. With the right strategy, a Stop Loss can even save your capital for your next investment.

As the name suggests, a stop loss is an order that limits your potential losses from trade and protects the pips from returning to the market. However, while a stop loss is designed to help keep pips in check, many traders do not know how to set a proper one, leading to an ungraceful early exit.

Stop loss forex market volatility

So how does one exactly set a proper stop loss?

While there are other strategies employed in setting stop losses, let’s discuss three fool-proof approaches to setting a proper stop loss: fixed-based, trend-based and volatility-based.

Fixed-based stop loss

The simplest way to set a stop loss is to do a fixed-based stop loss. It’s a stop loss order with set previous we start entering the position based on our money management calculation. For example, when we do some analysis, we know based on the Price Action strategy that we have a level that we want to set as the stop loss level, then we enter based on that level to create a better Risk and Reward trade. So we set the Stop Loss already in that level, then we just let the trade goes, on some certain level we may close our trade manually when we got the profit, or the trade hit the Target Profit level, or after certain movement, we can move the Stop Loss to the Entry Price.

Trend-based stop loss

In a trend-based stop loss, the order is placed at a level that invalidates the current trading set-up. For instance, in an uptrend market, you can identify three points: the lowest, the middle, and the highest downtrend. Using a trend-based approach, a stop loss order may be set on the lowest downtrend for optimal loss cutback, as the price is relatively low compared to that of the highest point. In this approach, identifying where the set-up may fail can help you exit before a bigger loss appears.

Volatility-based stop loss

A volatility-based stop loss, on the other hand, uses a technical analysis indicator called the Average True Range (ATR). Using this approach, the stop loss order is set at an ATR beyond the area of value, which involves two variables: the current ATR value and the swing low value (lowest price point). The current ATR value is simply deducted from the swing low value, resulting in the stop loss level at which you can set your stop loss order.

Pro tip: ATRs can be adjusted in multiples based on your trading set-up. Setting a narrow stop loss widens your position size but puts you at risk of a premature stop-up, whereas setting a wider stop loss may narrow your position size but gives you relatively more stability in controlling your movements.

Stop Losses and Stop Hunting

During a particular time when there is low volatility in the market, many traders use stop hunting as a strategy to open trading opportunities. Stop hunting is a strategy that forces traders to exit by purposely triggering stop loss orders, creating a high-volatility market, and presenting unique short-term trading opportunities which may be profitable for some traders.

For traders holding long-term positions, stop hunting causes continuous losses. In this case, setting the stop loss order at a definite level below support and above resistance can help avoid the occurrence of stop hunting.

Stop Losses in the long run

At the end of the day, a loss is still a loss. However, a small loss is a hundred times better than a burned capital. While it’s true that you can be stopped up from time to time, stop-loss orders not only can protect your capital and your profits, but can also give you time to reevaluate your trading setup to minimize even more losses than that afforded by a stop-loss order.

US stocks rise on the first day of the week

U.S. equities traded higher over the course of yesterday’s trading. The Dow Jones Industrial Average gained 1.34% to close at 31499.62. The S&P500 gained 1.19% to close at 3797.34. The tech-heavy Nasdaq Composite gained 0.86% to close at 10952.61. The Dow came back from its best 3-week stretch since Nov 2022 and closed at the highest level in 6 weeks, relieving the selling pressure of this year.

The benchmark U.S. 10-year treasury yield has dropped 0.04% from the highest and is currently trading at 4.228%, however, overall it’s recovering from the earlier decline on Friday when WSJ’s report strikes investors’ concern.

The U.S. CB Consumer Confidence comes out on Wednesday will reflex the DXY, with 108.00 in Sep and 103.6 in Aug, a higher expected reading should be taken as positive/bullish for the USD, while a lower-than-expected reading should be taken as negative/bearish for the USD.

Due to the Chinese leader Xi Jinping going for his third term as leader and unveiling a new leadership team, the Chinese technology companies suffered a huge impact on Monday, Tech giants Alibaba and Tencent closed down more than 11% in Asia, and Baidu was 12% lower while food delivery firm Meituan tanked more than 14%. Also, the came out of these two policies “zero-Covid” and “tightened regulation on the tech sector “, investors assume could be a negative for private firms.

Main Pairs Movement

The Dollar Index lost 0.02% over the course of yesterday’s trading. The release of the downbeat US S&P PMI data that landed at 49.9 with an estimation of 51.2, terminated DXY’s attempts of shifting into positive and restricted the upward trend in the DXY.

EURUSD gained 0.07% over the course of yesterday’s trading, and it even hits 0.99, this could be a sign that some investors are putting bets on the meeting on Thursday from European Central Bank.

GBPUSD gained 0.25% over the course of yesterday’s trading. The UK S&P Global PMIs for October didn’t show a good sign for the 4th quarter, however, the ends of the US Treasury yields on Monday show a positive side of the economy.

Gold gained 0.08% over the course of yesterday’s trading. The tepid growth-related gold markets corresponded with the DXY market and the market will continue being lacklustre before the US GDP data comes out.

Technical Analysis

EURUSD (4-Hour Chart)

The EUR/USD pair edged higher on Monday, advances steadily towards the 0.990 area and paired some of its earlier losses following the release of weaker US PMI data. The pair is now trading at 0.9870, posting a 0.14% gain on a daily basis. EUR/USD stays in the positive territory amid renewed US dollar weakness, as the disappointing PMI surveys dragged the greenback lower to the 112.0 area and provided some support to the EUR/USD pair. The US S&P Manufacturing PMI drops to 49.9 in early October, which fell short of market expectations of 51.2 and showed that business activity in the US manufacturing sector has contracted slightly. Moreover, the Services PMI and the Composite PMI both fell short of analysts’ projections. For the Euro, the downbeat PMI data in the Eurozone also further indicated that the Euro area economy is headed toward a recession. The ECB event on Thursday will be the focus this week as investors are anticipating a 75 bps rate hike by the central bank.

For the technical aspect, RSI indicator 61 figures as of writing, suggesting that the pair has limited upward potential as the RSI failed to push higher and consolidated around 60. As for the Bollinger Bands, the price failed to climb higher and started to decline, therefore some downside momentum can be expected. In conclusion, we think the market will be bearish as long as the 0.9874 resistance line holds. The technical indicators also remain directionless above their midlines.

Resistance: 0.9874, 0.9986, 1.0035

Support: 0.9757, 0.9667, 0.9551

GBPUSD (4-Hour Chart)

The GBP/USD pair was little changed on Monday, remained under slightly bearish pressure and steady hovered around the 1.1300 level amid the disappointing PMI data from the UK and the souring market mood. At the time of writing, the cable stays in negative territory with a 0.07% loss for the day. The lower-than-expected US PMI data makes it difficult for the US dollar to gather strength, but the GBP/USD pair failed to preserve its upside traction as investors remain cautious on the first day of the week. For the British pound, Rishi Sunak will become the new UK Primer Minister after winning a leadership contest and the transition from Liz Truss to Sunak could take place on Tuesday. As for now, investors are trying to figure out how PM Rishi Sunak will approach the fiscal plan. Meanwhile, the disappointing release of the flash UK PMI prints also fueled worries about a bleak outlook for the UK economy and weighed on the cable.

For the technical aspect, RSI indicator 51 figures as of writing, suggesting that the bullish bias stays intact in the near term as the RSI stays above the mid-line. As for the Bollinger Bands, the price remained under pressure and dropped towards the moving average, therefore the downside traction should persist. In conclusion, we think the market will be bearish as the pair is heading to test the 1.1228 support. Bears can have better chances if the pair extends its slide below that support.

Resistance: 1.1390, 1.1476, 1.1566
Support: 1.1131, 1.0968, 1.0392

XAUUSD (4-Hour Chart)

XAUUSD witnessed a fresh supply near the $1670 region, over a one-week high set earlier this Monday and extends its intraday descent through the first half of the European session. The gold fell back around the $1650 level and erodes a part of Friday’s goodish rebound from the vicinity of the YTD low. On the data side, the US Manufacturing PMI figured 49.9, which is lower than the expected 51.0, seen as bullish traction for XAUUSD and attracted some buying in the earlier US trading session. Furthermore, the US dollar index made a comeback and rebounded from over a two-week low. Then lost upside momentum and slid to the 120.00 level as of writing, with reports that some Fed officials are signalling greater unease with an oversized rate hike. Apart from that, the European Central Bank and Bank of England are also expected to deliver a jumbo rate hike at the upcoming policy meetings. This turns out to be another headwind driving flows away from the non-yielding yellow metal. Also, a recovery in the risk sentiment – as depicted by a positive tone around the equity markets, was seen weighing on the safe-haven gold.

From the technical perspective, the RSI indicator 54 figured as of writing, suggesting that the gold price was mildly growing in the four-hour chart scale. As for Bollinger Bands, the yellow metal was priced above the 20-period moving average and the gap between the upper and lower bands was little changed, signalling the price have no clear tractions until breakthrough the resistance of $1662, also around the upper band.

Resistance: 1662, 1674, 1725
Support: 1643, 1620, 1600

Economic Data

CurrencyDataTime (GMT + 8)Forecast
EURGerman Ifo Business Climate Index (Oct)16:0083.3
USD
CB Consumer Confidence (Oct)
22:00106.5

指数新品 BVSPX(巴西 Bovespa 指数)强势登场

尊敬的用户:

您好!

VT Markets 为进一步丰富广大客户的投资选择,我们预计将于 2022 年 10 月 31 日 (周一) 新增 1 只指数商品。

新产品交易细则如下:

注意:以上数据仅供参考,实际执行数据有可能会有变动,具体请依据MT4/MT5软件为准。

此次上线的新产品,将更好地满足广大客户对产品多元化的需求。

未来,VT Markets 将会持续更新产品列表,致力于产品优化、技术革新、服务创新等全方位提供客户崭新良好的投资体验。

如您有任何疑问,我们的团队将十分乐意为您解答。
请留言或发邮件至 [email protected] 或联系在线客服。

Back To Top
server

您好 👋

我能帮您什么吗?

立即与我们的团队聊天

在线客服

通过以下方式开始对话...

  • Telegram
    hold 维护中
  • 即将推出...

您好 👋

我能帮您什么吗?

telegram

用手机扫描二维码即可开始与我们聊天,或 点击这里.

没有安装 Telegram 应用或桌面版?请使用 Web Telegram .

QR code