The US Non-farm Employment Change in the labour data is a primary focus this week, as the Fed’s speech at the 2022 Jackson Hole Symposium on 25-27 August may influence policymakers’ decisions.
The US will release data this week on job openings, consumer confidence, and manufacturing activity in the service sector.
Germany and Switzerland will also release consumer price index data.
Image source: forexfactory.com
German Prelim CPI m/m | 30 August 2022
The German Consumer Price Index (CPI) rose 0.90% in July over the previous month, according to a preliminary estimate from the Federal Statistical Office of Germany. The increase was primarily due to higher energy prices. Analysts expect the German Prelim CPI to rise by 0.3% in April.
US CB Consumer Confidence | 30 August 2022
The US Consumer Confidence Index declined to 95.7 in July 2022 from 98.4, as the US economy showed signs of slowing growth. The index will likely rebound to 98 by September 2022 if US consumers’ perception of their job security stabilizes and they feel confident about their income potential.
US JOLTS Job Openings | 30 August 2022
Job openings in the US fell to 10.7 million in June 2022 to the lowest point in nine months, according to data from the Job Openings and Labor Turnover Survey or JOLTS. The decline was driven by a drop in openings for construction and mining workers.
As US economic conditions continue to improve, we can expect to see more jobs in the future.
US ADP Non-Farm Employment Change | 31 August 2022
Private businesses in the US added an estimated 128,000 payrolls in May, down from a revised 223,000 in April—marking the lowest monthly total since the job losses of 2020. Economists expect that private employers will create 200,000 jobs in June, pushing the average for the second quarter to 216,000.
Swiss Consumer Price Index | 1 September 2022
Switzerland’s Consumer Price Index remained unchanged in July from the previous month. Analysts expect the index to decrease slightly in August and dip into negative territory by 0.1%. The Swiss National Bank is expected to keep its interest rate unchanged at 0% for the time being, as inflation remains below its target range. The country’s economy is expected to grow in the second half of 2022, albeit slower than previously anticipated.
US ISM Manufacturing PMI | 1 September 2022
The ISM Manufacturing PMI decreased to 52.8 in July from 53 in June. It is widely expected that the index will continue its downward trend in August. The slowdown in economic growth and trade tensions between the US and China are likely to continue weighing on manufacturing activity in the country. The ISM Manufacturing PMI is expected to decrease slightly in August but will remain at a relatively high level of 51.8.
US Non-Farm Employment Change | 2 September 2022
US average hourly earnings increased by 0.5% in July. The US economy added 528,000 jobs, and the unemployment rate decreased to 3.5%, the lowest since February 2020. Analysts expect average hourly earnings to rise by 0.3%, with 300,000 additional jobs and an unemployment rate of 3.5%.
US stocks tumbled on Friday, as Jerome Powell gave a clear message that rates will likely stay high for some time, throwing cold water on the idea of a Federal Reserve pivot that could jeopardize its war against inflation. Moreover, the Fed chief reiterated that another ”unusually large” hike could be appropriate next month, though he stopped short of committing to one, adding that the decision will depend on incoming data. Overall, traders should expect more volatility and tougher conditions for equities with the Fed going to remain aggressive at the expense of growth.
The benchmarks, both S&P500 and Dow Jones Industrial Average plunged on Friday, as S&P500 saw its worst day since mid-June. All eleven sectors stayed in negative territory, as Information Technology performed the worst among all groups, dropping with a 4.28% loss daily, and six out of eleven sectors declined by more than 3% for the day. The Dow Jones Industrial Average fell 3%, the Nasdaq 100 tumbled with a 4.1% loss, and the MSCI world index decreased 2.5% for the day.
Main Pairs Movement
The US dollar rallied on Friday, following Federal Reserve Chair Jerome Powell adopting a hawkish tone to battling inflation. The DXY index dropped to a level below 107.8 ahead of the US trading session, then regained bullish momentum after Fed chief Jerome Powell’s hawkish talk, surged from 107.6 to a daily high level of 108.8.
The GBP/USD dropped with a 0.74% loss daily on Friday, as Fed Chair Jerome Powell delivered a hawkish speech at the Jackson Hole Symposium. The cables witnessed fresh transactions during the UK trading session and touched a level above 1.188, then tumbled to a level below 1.174 following the Federal Reserve Chief Jerome Powell took the stand. Meanwhile, EUR/USD fell to a level below 0.997, with a strong greenback across the board and an unchanged pessimistic economic future in the Europe zone. The pair was a little changed for the day.
Gold tumbled on Friday, as Fed Chair keeps a hawkish tone, and said higher interest rates will persist for some time, which heavily weighted XAU/USD. XAU/USD confronted selling pressure during the UK session and further declined to a daily low of $1,735 after Jerome Powell’s hawkish speech.
Technical Analysis
EUR/USD (4-Hour Chart)
The EUR/USD pair surged on Friday, extending its rally that started in the European session and refreshed its daily high near the 1.007 mark amid the emergence of some US dollar selling. The pair is now trading at 1.0067, posting a 0.92% gain daily. EUR/USD stays in the positive territory amid renewed US dollar weakness, as the softer-than-expected US PCE inflation data exerted bearish pressure on the greenback and provided support to the EUR/USD pair. On top of that, US Federal Reserve President Jerome Powell is delivering his speech about the economic outlook at the Jackson Hole Economic Symposium, a hawkish stance will play a key role and help determine the next leg of a directional move for the EUR/USD pair. For the Euro, the concerns about an extreme energy crisis in Europe have escalated amid the embargo on Russian energy imports. The Nord Stream 1 pipeline will remain shut for the last three days of August.
For the technical aspect, the RSI indicator is 62 as of writing, suggesting that the upside is preserving strength as the RSI keeps heading north. As for the Bollinger Bands, the price climbed higher and moved out of the upper band, therefore a strong trend continuation can be expected. In conclusion, we think the market will be bullish as the pair is heading to test the 1.0082 resistance line.
Resistance: 1.0082, 1.0171, 1.0188
Support: 0.9991, 0.9960, 0.9924
GBP/USD (4-Hour Chart)
The GBP/USD pair edged lower on Thursday, failing to preserve its bullish momentum. They retreated to the 1.182 area after the highly-anticipated speech from Fed Chair Jerome Powell at the Jackson Hole Symposium. At the time of writing, the cable stays in negative territory with a 0.36% loss for the day. The hawkish remarks on the policy outlook from Fed Chair Jerome Powell have underpinned the safe-haven greenback, as he said that higher interest rates would persist for some time. Moreover, the market now seeing greater odds of a 75 basis point rate hike, which rose back to 60% after the speech. The University of Michigan Consumer Sentiment also came in at 58.2 in August, which is better than expected. For the British pound, the bleak outlook for the UK economy continues to act as a headwind for the currency and weigh on the GBP/USD pair.
For the technical aspect, the RSI indicator is 42 as of writing, suggesting the GBP/USD pair’s downside bias as the RSI started to drop sharply toward 40. As for the Bollinger Bands, the price witnessed fresh selling and crossed below the moving average, therefore the downside traction should persist. In conclusion, we think the market will be bearish as long as the 1.1849 resistance line holds. On the downside, a break below 1.1780 could open the door for additional losses.
Resistance: 1.1849, 1.1922, 1.1980
Support: 1.1780, 1.1763
XAU/USD (4-Hour Chart)
Gold plunged to the $1,730 level after having advanced above the $1,750 level during the American trading hours on Friday as Fed Chair Jerome Powell reiterated his hawkish stance and helped the US dollar to rise strongly again.
Federal Reserve Chair Jerome Powell signalled the U.S. central bank is likely to keep raising interest rates and leave them elevated for a while to stamp out inflation, and he pushed back against any idea that the Fed would soon reverse course. “Restoring price stability will likely require maintaining a restrictive policy stance for some time,” Powell said Friday in remarks at the Kansas City Fed’s annual policy forum in Jackson Hole, Wyoming. “The historical record cautions strongly against prematurely loosening policy.” The comments of Powell were taken as “hawkish”. After all the dust settled, gold price turned south and plunged below the $1,740 level snapping its winning streaks and erasing all its weekly gains.
For the technical aspect, the RSI indicator is 34 as of writing, below the midline, suggesting that the following bearish trend could be expected as RSI slumped from above 50. As for the Bollinger Bands, the price dropped sharply across the moving average from its formerly upward trend, which is a typical pattern of turning weak, suggesting a downside momentum. In conclusion, we think the market will be bearish as fundamental and technical aspects both favour downside traction. If the price closes below $1,730, it might head to test the next support region at the $1,714 level.
US stocks rallied on Thursday, as traders awaited Jerome Powell’s keynote for clues on how much further the Federal Reserve will pump the brakes on the economy to bring inflation back under control. Investors were mostly unfazed by hawkish comments from Fed officials gathering for the annual conference in Jackson Hole, Wyoming. The Fed’s chair is widely expected to restate his resolve to keep tightening policy to fight inflationary spirals. Besides, traders will also be watching out for any signals about the pace of the Fed’s balance-sheet runoff, quantitative tightening, which gets up to full speed in September at a monthly clip of up to $95 billion.
The benchmarks, both S&P500 and Dow Jones Industrial Average advanced on Thursday, following the lowest trading day of 2022 for US equities, and volume was once again below average. All eleven sectors of S&P500 stayed in positive territory, as Material and Communication Service performed the best among all groups, rising by 2.26% and 2.06% on daily basis for the day. Benefit from mega-caps like Apple Inc. and Amazon.com Inc. jumped, Nasdaq 100 rallied with a 1.7% gain. The Dow Jones Industrial Average rose 1%, and the MSCI world index increased 1.3% on Thursday.
Main Pairs Movement
US dollar slid on Thursday, as investors awaited Federal Reserve Chairman Jerome Powell’s speech on Friday for further clues about the pace of the U.S. central bank’s rate hikes. The DXY index extended bearish momentum and dropped to a level around 108.0 in the first half on Thursday, then witnessed fresh upbeat transactions and oscillated from 108.4 to 108.6 level in the late UK trading session.
The GBP/USD was little changed up on Thursday, although the US greenback turned a little weak, a gloomy economic outlook in the UK weighed heavily on the cables. The pair climbed t a daily high level above 1.186 during the middle UK trading session, then slipped and volatile in a range from 1.800 to 1.845. Meanwhile, EUR/USD observed upbeat tractions in the first half of Thursday, then faced heavy selling pressure to wander between 0.995 and 0.998. The pair was little changed for the day.
Gold surged with a 0.43% gain on daily basis, as the FX domain turned volatile ahead of Jackson Hole Economic Symposium. The yellow metal edged higher to touch a daily high of $1,765 marks in the first half of Thursday, then corrected to around $1,757 marks.
Technical Analysis
EUR/USD (4-Hour Chart)
The EUR/USD pair advanced on Thursday, preserving its bullish strength and touched a daily high above the 1.003 mark in the early European session amid the better market mood. The pair is now trading at 0.9986, posting a 0.25% gain daily. EUR/USD stays in the positive territory amid a weaker US dollar across the board, as traders prefer to wait for a more hawkish message from Fed Chair Jerome Powell at the Jackson Hole Symposium on Friday. The less-hawkish comments from the Philadelphia Fed President Patrick Harker also acted as a headwind for the safe-haven greenback and underpinned the EUR/USD pair, as he said that a 50 basis points rate hike would still be a substantial move. But the expectations for further policy tightening by the US central bank should limit the losses for the US dollar. For the Euro, the German Final GDP came at 0.1% QoQ in Q2, which was better than expected and provide some support to the shared currency.
For the technical aspect, the RSI indicator is 43 as of writing, suggesting that the downside is more favoured as the RSI stays below the mid-line. As for the Bollinger Bands, the price failed to climb higher and dropped toward the moving average, therefore the downside traction should persist. In conclusion, we think the market will be bearish as long as the 1.007 resistance line holds. Technical indicators also turned lower and the RSI is within negative levels.
Resistance: 1.0007, 1.0089, 1.0172
Support: 0.9924
GBP/USD (4-Hour Chart)
The GBP/USD pair edged higher on Thursday, struggling to capitalize on its intraday gains and retreated from a daily high near the 1.1860 level that touched in the early European session amid the recovery witnessed in the US dollar. At the time of writing, the cable stays in positive territory with a 0.05% gain for the day. The US Weekly Initial Jobless Claims declined to 243K in the week ending August 20, which came in better-than-expected and reaffirms bets for a further policy tightening by the Fed. The market focus now shifts to Fed Chair Jerome Powell’s appearance at the Jackson Hole Symposium on Friday, as his comments could provide clues about the possibility of a 75 bps Fed rate hike move at the September meeting. For the British pound, the currency is likely to remain under pressure as the bleak outlook for the UK economy overshadows expectations for a 50 bps rate hike by the BoE next month.
For the technical aspect, the RSI indicator is 43 as of writing, suggesting that the risk is skewed to the downside as the RSI started to decline. As for the Bollinger Bands, the price preserved its downside traction and dropped toward the moving average, therefore the bearish strength should persist. In conclusion, we think the market will be bearish as long as the 1.1849 resistance line holds. On the downside, a break below 1.1780 could underpin the GBP/USD pair’s downside bias.
Resistance: 1.1849, 1.1922, 1.2050
Support: 1.1780, 1.1763
XAU/USD (4-Hour Chart)
Gold price refreshed a weekly high near the $1,760 level ahead of Thursday’s European session, forming a three-day uptrend. The price advance for a weaker dollar and stimulus news from China, as investors await rate guidance from the Jackson Hole Symposium.
Per Bloomberg, the State Council, China’s Cabinet, outlined a 19-point policy package on Wednesday, including another 300 billion yuan that state policy banks can invest in infrastructure projects, on top of the 300 billion yuan already announced at the end of June. Local governments will be allocated 500 billion yuan of special bonds from previously unused quotas. As China is one of the largest buyers of gold in the world, positive news from China often favours the gold price.
For the technical aspect, the RSI indicator is 56 as of writing, above the midline, showing some momentum to the upside. As for the Bollinger Bands, the price edges higher with an up-bending moving average, maintaining slightly below the upper bound, suggesting that the upside traction could be expected. Besides, the price has advanced to above the $1,757 level, and now testing it as a support region on the 4H chart. In conclusion, we think the market started to show some bullish traction, but the trend after still mainly depends on the message from Fed Chair Jerome Powell at the Jackson Hole Symposium on Friday. Therefore, it might not be that much price action before the event.
The US stocks little rallied on Wednesday, stock traders remained hesitant to make any huge wagers ahead of Jerome Powell’s speech on Friday, which may provide clues on how hawkish the Federal Reserve will be in the face of mounting economic challenges. In the run-up to the all-important Jackson Hole annual conference that will be attended by policymakers around the world, investors had to digest more hawkish talk, as it’s probably that Fed officials need to tighten and bring inflation back under control. Besides, economic data have been mixed at best, US pending home sales fell to the lowest since the start of the pandemic, underlining the delicate task policymakers face in bringing down high inflation without sparking a recession.
The benchmarks, both S&P500 and Dow Jones Industrial Average notched a small gain on Wednesday, with its swing capped within 1% for the second day in a row. All eleven sectors in S&P500 stayed in positive territory, as the Energy sector performed the best among all groups, which rose 1.20% for the day. It’s worth noting that Tesla Inc. pared most of its rally ahead of a split-adjusted basis on Aug.25, which caused the Nasdaq to little moved upward with a 0.3% gain on daily basis. The Dow Jone Industrial Average rose 0.2%, and the MSCI world index was little changed on Wednesday.
Main Pairs Movement
The US dollar was little changed on Wednesday, as investors put into sideways for a Friday speech by the Federal Reserve chairman for fresh clues on how aggressive the central bank will be in its battle against inflation. The DXY index slowly climbed up to a daily high level above 109, then witnessed huge selling transactions and fell to a level below 108.4 during the US trading session.
The GBP/USD declined with a 0.31% loss daily for the day, as investors were cautious ahead of Jackson Hole Symposium. The cables were weighed in the first half of Wednesday, then observed upbeat traction at the beginning of the US trading session and touched a daily high level of around 1.188. Meantime, EUR/USD touched a level of nearly 1.000. The pair was little changed down on Wednesday.
Gold advanced with a 0.17% upward for the day, as a two-day uptrend. XAU/USD surged during the US trading session and oscillate in a range from $1,744 to $1,756 marks. WTI and Brent oil surged on Wednesday, rising by 1.23% and 1.55% on daily basis respectively.
Technical Analysis
EUR/USD (4-Hour Chart)
The EUR/USD pair advanced on Wednesday, regained upside momentum and climbed toward the 1.000 mark to recover all of its daily losses during the US session amid the emergence of fresh selling around the US dollar. The pair is now trading at 0.9981, posting a 0.12% gain daily. EUR/USD stays in the positive territory amid renewed US dollar weakness, as the rising US Treasury bond yields and upbeat US economic data failed to lift the greenback higher. The US Durable Goods Orders excluding defence increased by 1.2% and Pending Home Sales data also fell less than expected, providing some support to the greenback during the European session. Investors are waiting for a more hawkish message from Fed Chair Jerome Powell at the Jackson Hole symposium on Friday. For the Euro, the concerns about the energy crisis remained amid the three-day unscheduled cut-off of energy supplies for maintenance of the Nord Stream 1 pipeline.
For the technical aspect, the RSI indicator is 40 as of writing, suggesting that the pair is regaining upside momentum as the RSI started to rise toward the mid-line. As for the Bollinger Bands, the price witnessed fresh buying and rose toward the moving average, therefore a continuation of upside traction can be expected. In conclusion, we think the market will be slightly bullish as the pair is heading to test the 0.9979 resistance.
Resistance: 0.9979, 1.0038, 1.0089
Support: 0.9924
GBP/USD (4-Hour Chart)
The GBP/USD pair edged lower on Wednesday, failing to preserve its upside traction and retreated to the 1.1795 level during the US trading session amid fresh buying witnessed in the US dollar. At the time of writing, the cable stays in negative territory with a 0.32% loss for the day. The slightly upbeat market mood and mostly upbeat US economic data both underpinned the greenback and exerted bearish pressure on the GBP/USD pair. The current market pricing indicates an equal possibility of a 50 bps rate hike or a supersized 75 bps move at the September FOMC policy meeting, as Minneapolis Fed President Neel Kashkari said that inflation is too high and emphasized the need to tighten monetary policy. For the British pound, despite further rate hikes by the Bank of England, the currency might remain under pressure amid higher energy prices.
For the technical aspect, the RSI indicator is 39 as of writing, suggesting that the downside is more favoured as the RSI stays below the mid-line. As for the Bollinger Bands, the price lost its upside strength and crossed below the moving average, therefore the downside traction should persist. In conclusion, we think the market will be bearish as the pair is testing the 1.1780 support. The level 1.1763 will be a crucial support to watch during the GBP/USD pair’s further weakness.
Resistance: 1.1849, 1.1922, 1.1980
Support: 1.1780, 1.1763
XAU/USD (4-Hour Chart)
Gold turned to rise in the US session and advanced to above $1,750 amid renewed selling pressure around the US dollar. However, the benchmark 10-year US Treasury yield is still up nearly 2%, limiting the upside for gold price.
For the technical aspect, the RSI indicator is 50 as of writing, maintaining steady compared to yesterday, showing no strong momentum to the upside or the downside. As for the Bollinger Bands, the price consolidates between the moving average and upper bound. This along with the flat-lining moving average suggests that the price still has no clear traction. In conclusion, we think the market is still waiting for a key signal to determine the next direction. To the upside, the gold price should advance above resistance at the $1,750 level first. On the downside, if the price closes negative below the $1,730 level, it might head to test the next support at the $1,714 level.
That said, traders might refrain from placing aggressive bets ahead of the key event risks – the Jackson Hole symposium on Friday. All eyes are now on Friday’s Jackson Hole symposium, which would determine the near-term direction of the US dollar and influence the performance of gold prices. For more price actions, eye on tier 1 economic figures from the US.
A moving average is one of the simplest ways to analyse the market and predict future price movements. They’re easy to use, which makes them a great first step for new investors. But even if you’re an experienced trader, moving averages can still be valuable tools for your arsenal—especially when combined with other forms of technical analysis.
In this article, we’ll walk you through what a moving average is, how it works, and how it can help you make better investment decisions.
What is a Moving Average?
A moving average is used as a technical analysis tool that helps provide an updated average price, so it’s easier to look into data and determine trends that could dictate the market’s movement and thus influence your trading decisions. It is a simple calculation that involves taking the sum of all the past closing prices or other data points and dividing it by the number of data points used in the calculation.
For example, if you have ten days of closing prices and use an average of 200 days for your moving average, then there are 200 data points being used to calculate an average for each day. This means that every day, you will have ten new closing prices added to your calculation and 190 from previous days.
The most important thing you need to know about moving averages is that they are lagging indicators: they only predict future trends after forming a pattern or trend over several periods (usually around 20). This makes them useful when looking at longer-term trends but less helpful when determining short-term movements in price.
Types of Moving Averages
There are three common types of moving averages:
Simple Moving Average (SMA)
A simple moving average is the sum of closing prices over specific periods. For example, a 20-day SMA would be made up of 20 days’ worth of closing prices and plotted on a chart as an average line.
Exponential Moving Average (EMA)
An exponential moving average is calculated by adding a percentage of each period’s closing price to the previous period’s moving average. The most common EMA type is a 5-period EMA, which adds 20% of today’s closing price to 80% of yesterday’s closing price. This means that recent prices are given more weight than older prices (like with a simple moving average).
Weighted Moving Average (WMA)
A weighted moving average gives more importance to recent data points than old ones. With a weighted moving average, the most recent data point will have the most weight in calculating the average. The weights are calculated by multiplying each data point by a number between 0 and 1, with 0 being given to older prices and 1 being given to more recent prices.
How do you read a Moving Average Break Pattern?
Traders use a moving average (MA) to help identify if a trend is up or down. As its name suggests, a moving average takes the average price of an asset over a specific period. The most common type of MA is the simple moving average (SMA), which takes all closing prices for an asset during its given period, adds them together, and then divides that sum by the number of days in that timeframe.
This would be your SMA line on your chart because every new price point would be plotted against this line until another new value comes in, which takes over as part of your new SMA calculation until another change occurs again, and so on.
What are the benefits of using a Moving Average Break Pattern?
There are many benefits to using the Moving Average Break pattern.
The moving average break is a technical analysis tool that can help you identify trends, overbought or oversold conditions, and support and resistance levels. It can also be used to confirm turning points in a specific market.
A moving average break occurs when the price moves through an established trend line on a chart, such as the 50-day Simple Moving Average. This pattern is one of several price patterns you can use to determine if it’s time to buy or sell stocks, futures contracts, or other financial assets.
When trading with multiple assets at once, you need to keep an eye on what’s happening with your trades. Get an idea about whether some changes are significant enough to affect your overall portfolio performance, which means keeping tabs on key indicators like moving averages. By comparing slices of data against each other daily, you will know when to expect major highs/lows during any given period.
In conclusion, moving averages are useful tools for investors, along with many others. They allow you to take a big-picture view of the market and make informed decisions about your investment strategy. Moving averages can be used in any timeframe, so whether you are looking at daily, weekly, or monthly charts, there will always be a moving average that works best in the current market environment.
US stocks declined on Tuesday, as the markets are bracing for hawkish talk at the Jackson Hole event after recent comments from officials convinced many investors the Fed will continue to tighten even with a slowing economy. Apart from that, data Tuesday showed sales of new US homes fell for the sixth time this year to the slowest pace since early 2016, while business activity contracted for a second straight month. Moreover, quantitative tightening by the US central bank is set to kick into gear next month, presenting another potential headwind for equities.
The benchmarks, both S&P500 and Dow Jones Industrial Average fell and saw their third straight drop after swinging between gains and losses throughout the session on Tuesday. Seven out of eleven sectors stayed in negative territory, as Real Estate and Health Care performed the worst among all groups, plunging with 1.45% and 1.39% losses on daily basis respectively, while Energy outperformed all the other groups, surged with a 3.62% on daily basis. The Dow Jones Industrial Average fell 0.5%, the Nasdaq 100 was little changed, and the MSCI world index decreased 0.3% for the day.
Main Pairs Movement
US dollar declined on Tuesday and failed to extend its four straight rises after data showed U.S. private sector activity was weaker than expected in August, prompting bets the Federal Reserve may be less aggressive in its rate hiking cycle. The DXY index witnessed heavy selling transactions and fell to a daily low level below 108.1 in the early US trading session, then rebounded to oscillate in a range from 108.4 to 108.7 level.
The GBP/USD surged by 0.59% daily for the day, as US economic data reignited recession fears. The cables observed fresh upbeat traction during the early US trading session following a drop in greenback caused by dismal US data. The pair touched a daily high level above 1.187, then lost bullish momentum and volatile between 1.185 and 1.181. Meantime, EUR/USD surged and touched a daily high level above 1.001. The pair advanced by 0.27% daily.
Gold surged and ended the six consecutive day drop on Tuesday, as the US dollar plunged across the board. XAU/USD gained bearish momentum and touched a daily high of $1,754 marks after an announcement of US dismal data, which may slow the pace of rate hiking.
Technical Analysis
EUR/USD (4-Hour Chart)
The EUR/USD pair rebounded on Tuesday, recovering sharply from 20-year lows that touched earlier in the European session and climbed to a daily top above the 1.000 mark after the release of dismal US PMI data. The pair is now trading at 0.9971, posting a 0.29% gain daily. EUR/USD stays in the positive territory amid renewed US dollar weakness, as the release of weaker-than-expected flash US PMI prints for August exerted bearish pressure on the greenback and helped the EUR/USD pair to find demand. The US Manufacturing PMI declined to 51.3 and the Services PMI plunged to 44.1 in August, falling short of market expectations and showing that the business activity in the US private sector contracted at a stronger pace. For the Euro, the mixed Eurozone and German PMI data provide some support to the shared currency, as well as the better-than-expected Eurozone Consumer confidence that was released in the US session.
For the technical aspect, the RSI indicator is 34 as of writing, suggesting that the downside is still more favoured as the RSI stays below the mid-line. As for the Bollinger Bands, the price witnessed fresh buying and rose toward the moving average, therefore some upside traction can be expected. In conclusion, we think the market will be slightly bullish as long as the 0.9924 support line holds. The rising RSI also reflects bull signals.
Resistance: 0.9991, 1.0038, 1.0082
Support: 0.9924
GBP/USD (4-Hour Chart)
The GBP/USD pair advanced on Tuesday, observing strong daily gains and touched a daily high above 1.1860 level during the US trading session amid the weak US economic data. At the time of writing, the cable stays in positive territory with a 0.65% gain for the day. The US Dollar Index (DXY) retreats from the monthly high and dropped to a daily low near 108.1, as the report showed that business activity in the US contracted for the second consecutive month. But the fears of recession and increasing hawkish Fed bets should limit the losses for the safe-haven greenback, meanwhile, investors expect a more hawkish message from Fed Chair Jerome Powell at the Jackson Hole symposium on Friday. For the British pound, the UK Manufacturing PMI in August also fell to 46.0, which is mainly due to supply chain disruptions and high energy prices across Europe.
For the technical aspect, the RSI indicator is 44 as of writing, suggesting that the pair has regained bullish momentum as the RSI rose sharply toward the mid-line. As for the Bollinger Bands, the price staged a rebound and crossed above the moving average, therefore a continuation of the upside trend can be expected. In conclusion, we think the market will be bullish as the pair is testing the 1.1830 resistance. A sustained strength above that level could confirm the bullish shift in the near-term outlook.
Resistance: 1.1830, 1.1922, 1.2050
Support: 1.1780, 1.1763
XAU/USD (4-Hour Chart)
Gold catches some upside traction on Tuesday and recovers from a multi-week low.
The price reverses an intraday dip to the $1,730 level and surges to a daily high in the US session. It seems to have snapped a six-day losing streak to a nearly four-week low and is currently placed around the $1,745 level.
Gold prices rebounded as the US dollar retreated modestly on the back of dismal August PMI figures. That said, expectations for a more hawkish message from Fed Chair Jerome Powell at the Jackson Hole symposium on Friday still support a stronger US dollar. This, along with elevated U.S. bond yields, should limit further gains on the gold price.
For the technical aspect, the RSI indicator is 47 as of writing, close to the midline, suggesting that the pair has staged a strong upside correction. As for the Bollinger Bands, the price surged and crossed above the moving average, now testing the pressure region at the $1,757 level. Besides, the moving average is still downward. In conclusion, we think the price is now right between pressure and support regions. The price might test both sides here. Investors should wait for the breakout to determine a clear direction. To the upside, the price should advance above the $1,757 level first. On the downside, if the price closes below the $1,730 level, it might head to test the next pivotal support at the $1,714 level.
US stocks plunged on Monday, as the earnings season wrapped up and the threat of an economic recession still looming large amid warnings from Fed officials that the fight against inflation is far from over. That stance will likely be reinforced by Jerome Powell Friday at the prestigious event in Wyoming’s Grand Teton mountains, which has been used by Fed chairs as a venue for making key policy announcements. According to the latest MLIV Pulse Survey, stocks and bonds are set to tumble once more even though inflation has likely peaked, as rate hikes reawaken the great 2022 selloff. Many investors see the most destabilizing era f price pressures in decades eroding corporate margins and sending equities lower.
The benchmarks, both S&P500 and Dow Jones Industrial Average dropped on Monday, as equities saw their worst rout in two months after a surge drove S&P500 to its best start to a third-quarter since 1932. All sectors stayed in negative territory, as Consumer Discretion, Information Technology, and Communication service performed the worst among all groups, falling with 2.84%, 2.78%, and 2.67% on daily basis respectively for the day. The Nasdaq dropped 2.7% as big tech underperformed, Dow Jones Industrial Average fell 1.9%, and the MSCI world index plunged 1.8% on Monday.
Main Pairs Movement
The US dollar surged on Monday, as investors shied away from riskier assets amid growing fears that interest-rate hikes in the United States and Europe, aimed at curbing inflation, would weaken the global economy. The DXY index extended bullish momentum and edged higher, witnessing fresh transactions and surging to a level above 109.0 in the early US trading session.
The GBP/USD plunged and printed a fresh two-year low of 1.1742 on Monday, as strong greenback across the board and the vulnerable employment data have trimmed the confidence of the Bank of England in hiking interest rates. The cables have extended the selling pressure caused by the US dollar since last week and edged lower to a level below 1.177 by the end of the day. Meantime, EUR/USD fell to a level below 0.995, the lowest level since December 2002, as fears of the Eurozone recession escalated day by day. The pair dropped 0.94% on daily basis for the day.
Gold dropped and remained weighted at a one-month low, down for the seventh consecutive day, with the risk-aversion market mood supporting the US dollar ahead of the Jackson Hole meeting on Friday. Moreover, market fear of Russia’s Nord Stream 1 pipeline’s maintenance also supports the XAU/USD bears. The gold extended the bearish momentum and kept moving down to a level below $1,730 marks ahead of the US trading session, then rebounded to oscillate in a range from $1,735 to $1,740.
Technical Analysis
EUR/USD (4-Hour Chart)
The EUR/USD pair tumbled on Monday, coming under heavy bearish pressure and extended its slide toward the multi-year low below the 0.996 mark amid a risk-off market environment. The pair is now trading at 0.9958, posting a 0.80% loss daily. EUR/USD stays in the negative territory amid renewed US dollar strength, as the flight to safety in the American session provides a boost to the greenback and lifted it to new highs further north of the 108.00 mark at the beginning of the week. The growing worries over a global economic downturn and the COVID lockdowns in China have both undermined the market sentiment and exerted bearish pressure on the EUR/USD pair. For the Euro, the Bundesbank monthly report, which weighed on the shared currency, showed that a recession in Germany is increasingly likely and inflation will continue to accelerate.
For the technical aspect, the RSI indicator is 17 as of writing, suggesting that the pair might witness some upside correction as the RSI stays in the oversold zone. As for the Bollinger Bands, the price preserved its bearish traction and moved out of the lower bands, therefore a strong downtrend continuation can be expected. In conclusion, we think the market will be bearish as the pair is testing the 0.9991 support. But the pair could see some short-term correction before edging lower amid the oversold RSI.
Resistance: 1.0082, 1.0111, 1.0188
Support: 0.9991, 0.9950, 0.9910
GBP/USD (4-Hour Chart)
The GBP/USD pair suffered heavy losses on Monday, continuing to turn lower for the fourth straight day and dropped to the lowest level since March 2020 below 1.1750 level amid renewed US dollar buying. At the time of writing, the cable stays in negative territory with a 0.64% loss for the day. The expectations that the Fed would continue to tighten its monetary policy to tame surging inflation continued to underpin the US dollar and dragged the GBP/USD pair lower. The speech from Fed Chair Jerome Powell at the Jackson Hole Symposium on Friday might also provide clues about the possibility of a 75 bps rate hike move at the September meeting. For the British pound, the Bank of England’s gloomy economic outlook and growing recession fears kept acting as a headwind for the currency.
For the technical aspect, the RSI indicator is 21 as of writing, suggesting that the pair could stage a correction before extending its slide as the RSI has dropped below 30. As for the Bollinger Bands, the price remained under pressure and dropped toward the lower band, therefore a continuation of bearish traction can be expected. In conclusion, we think the market will be bearish as the pair is testing the 1.178 support. A four-hour close below that level could open the door for additional losses.
Resistance: 1.1830, 1.1922, 1.2050
Support: 1.1780
XAU/USD (4-Hour Chart)
Gold price slumped to below $1,730 level in the European session and tried to erase losses in the early American session but failed on Monday. Price continues losing ground for the sixth straight day and drops to a nearly four-week low, suggesting that gold is still hard to gather bullish momentum with US Treasury bond yields continuing to push higher.
From the technical aspect, gold price witnessed heavy sell on Monday from the $1,750 level to the lowest $1,728. The RSI indicator is 28 as of writing, slightly below 30, which suggests that there could be a correction due to overselling. On the other hand, any advance upward now might be taken as a good chance for investors to sell while the trend is still downward. As for the Bollinger Bands, the price kept declining along with the lower band, a continuation of bearish traction can be expected. In conclusion, we think the market will maintain its downside traction but need to be aware of upside correction.
Market participants now eye on Fed Chair Jerome Powell’s speech at the Jackson Hole Symposium on Friday for clues about the possibility of a 75-bps rate hike move at the September meeting. This and the important US economic releases this week will play a key role in influencing the USD price and help determine the next direction for gold.
The US Federal Reserve’s 2022 Jackson Hole Symposium will be held in Cheyenne, Wyoming, from 25-27 August. Central bankers and economists from across the globe will attend the event.
The meeting is one of the most anticipated events for economists and investors alike as it offers an opportunity for Fed officials to discuss their outlook for monetary policy. In addition to this highly anticipated event, we have a host of economic data that could impact markets over the next few days.
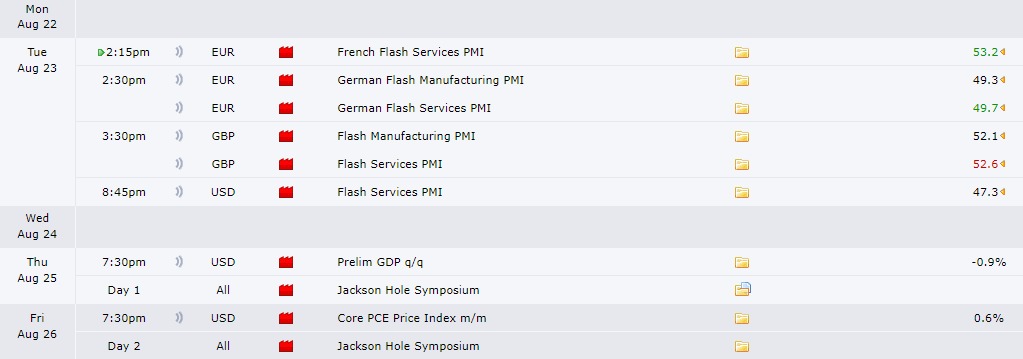
Several prominent economic indicators like US Flash Services PMI and Prelim GDP, as well as Core PCE Price Index for July, will be published this week. France, Germany, and the United Kingdom will also release their Flash Services PMI figures on Tuesday, 23 August. Meanwhile, Germany and the United Kingdom will release their Manufacturing PMIs on the same day.
Image source: forexfactory.com
French Flash Services PMI | 23 August 2022
July saw the French Flash Services Purchasing Managers Index fall to 53.2, from 53.9 in June, the third successive decline in the growth rate and the weakest since January this year, amid weaker demand for services. Despite rising inflation, businesses were slightly more optimistic in July.
Germany’s Flash Manufacturing PMI | 23 August 2022
Germany’s Flash Manufacturing PMI declined from 52 to 49.3 in July 2022, showing that manufacturing slowed down. The most significant drop was in input demand, which fell because of a slowdown in the supply chain. Employment levels rose at a slower pace, while business expectations remained low.
United Kingdom’s Manufacturing PMI | 23 August 2022
In July of 2022, the Purchasing Managers’ Index for UK manufacturing fell to 52.1, down from 52.8 in June, with the decline attributed to decreases in consumer and intermediate goods sub-industries.
United Kingdom’s Flash Services PMI | 23 August 2022
The Flash Services PMI dropped to 52.6 in July of 2022 from 54.3 in June, indicating a slowdown in the expansion of services activity. Inflationary pressures and the cost-of-living squeeze led to more significant economic uncertainty, and businesses expected conditions would remain the same for at least another few months.
US Flash Services PMI | 23 August 2022
The US Flash Services PMI took a hit in July, falling to 47.3 in July 2022, from 52.7 in June. Although new orders returned to growth, the expansion rate was historically subdued and much slower than those seen earlier in the year. Inflationary pressures remained traditionally high in July but eased further. Businesses are expected to improve in the next few months.
Jackson Hole Economic Symposium | 25 – 27 August 2022
The Jackson Hole Economic Symposium takes place annually on the last Friday in August. This year’s topic will be “Reassessing Constraints on the Economy and Policy,” with speeches from federal reserve board members and other economists about current economic conditions and policies. The Economic Symposium is organised by the Federal Reserve Bank of Kansas City in conjunction with a group of academic economists and financial industry representatives. It attracts thousands of attendees annually from around the world.
US Prelim GDP | 25 August 2022
US GDP shrank 0.9% in the second quarter of 2022, after shrinking 1.6% in the first quarter and crossing into recession. US Federal Reserve Chair Jerome Powell recently stated that he did not believe the US was in a recession, causing the markets to expect an increase of 0.5%.
US Core PCE Price Index | 26 August 2022
In June of 2022, the Core PCE Price Index in the US increased 1% month-on-month—the highest monthly growth since September 2005. Core PCE Price Index data is forecast at 1% for July. Inflation will likely increase further in the coming months, driven by higher energy prices. The US economy is forecast to grow steadily in 2019-2022, putting upward pressure on wages and consumer price inflation.
US stocks declined on Friday and snapped the longest weekly rally since November. Investors turned cautious and short-sellers resurfaced after Federal Reserve officials beat the drum on hiking rates. The pullback in equities this week follows a rally that has propelled the S&P500 from its mid-June nadir amid speculation that the Fed may scale back its aggressive path of rate hikes. However, more Fed officials joined the chorus of a hawkish stance in the runup to the annual symposium at Jackson Hole Aug. 25-27. Which makes a force that contributed to the rally now showing signs of fatigue, with hedge funds dialing down purchases of shares.
The benchmarks, S&P 500 and Dow Jones Industrial Average both dropped on Friday, as S&P500 notched its biggest daily decline since June, its first weekly loss in five weeks. Nine out of eleven sectors stayed in negative territory, and six of them fell more than 1% on daily basis. It’s worth noting that, the Consumers Discretion and Financials sectors performed the worst among all groups, sliding with 2.10% and 2.02% loss for the day. The Dow Jones Industrial Average fell 0.9%, the Nasdaq 100 dropped 1.9%, and the MSCI world index decreased 1.3% on Friday.
Main Pairs Movement
The US dollar surged on Friday, which posts the biggest weekly advance since April 2020. The minutes of the July meeting suggested that the Fed will continue to raise interest rates at the next few meetings, but the pace of the rate hikes will be data-dependent, which supports the greenback. The DXY index witnessed fresh transactions since the UK trading session and edged higher to a level above 108.1.
The GBP/USD dropped with a 0.85% loss on daily basis for the day, as sentiment shifted sour after Fed’s hawkish commentary. The cables were weighted to a daily low level below 1.180 during the middle of the US trading session as the strong US dollar across the board, then oscillate in a range from 1.181 to 1.184. Meantime, EUR/USD slid to a level below 1.004. The pair decreased by 0.50% on Friday.
Gold plunged 0.66% daily for the day, with a fifth-consecutive day as market mood amid a backdrop of fear and volatility. Although under selling pressure, XAU/USD observed fresh transactions before the US trading session and touched a daily high of $1,758 marks. However, gold then witnessed downside traction and fell to the daily low below $1,746 marks at the beginning of the US trading session.
Technical Analysis
EUR/USD (4-Hour Chart)
The EUR/USD pair declined on Friday, extending its previous slide and held lower ground near the monthly low below the 1.005 mark amid fears of German recession and geopolitical concerns. The pair is now trading at 1.0048, posting a 0.36% loss daily. EUR/USD stays in the negative territory amid a stronger US dollar across the board, as the DXY just prints new multi-week tops above the 108.00 hurdle on Friday and exerted bearish pressure on the EUR/USD pair. The hawkish comments from the Fed policymakers in recent days continued to drive flows toward safety assets like the greenback, as markets seem convinced that the Fed will stick to its policy tightening cycle amid the incoming positive US macro data. For the Euro, Germany’s Producer Price Index (PPI) for July came at 5.3% MoM, which is higher than markets’ expectations.
For the technical aspect, RSI indicator is 24 as of writing, suggesting that the pair might witness some upside correction as the RSI stays in the oversold zone. As for the Bollinger Bands, the price continued to move alongside the lower band, therefore the downside traction should persist. In conclusion, we think the market will be bearish as long as the 1.0082 resistance line holds. But the pair could see some short-term correction before edging lower amid the oversold RSI.
Resistance: 1.0082, 1.0111, 1.0188
Support: 1.0111, 0.9991
GBP/USD (4-Hour Chart)
The GBP/USD pair tumbled on Friday, coming under heavy selling pressure and dropped to a monthly low below 1.1840 level in the US trading session amid renewed US dollar strength. At the time of writing, the cable stays in negative territory with a 0.88% loss for the day. The prospects for further rate increases by the Fed and the prevalent risk-off mood both acted as a headwind for the GBP/USD pair, as the US central bank is expected to stick to its policy tightening path due to recent comments by several Fed officials. For the British pound, the better-than-expected UK Retail Sales rose 0.3% in July but failed to provide bullish strength to the cable, which is being weighed by the Bank of England’s gloomy economic outlook and a possible recession that would start in the fourth quarter.
For the technical aspect, the RSI indicator is 30 as of writing, suggesting that the pair could stage a correction before extending its slide as the RSI dropped below 30. As for the Bollinger Bands, the price preserved its downside traction and move alongside the lower band, therefore a continuation of the downtrend can be expected. In conclusion, we think the market will be bearish as the pair is testing the 1.183 support. A break below that level could drag the pair toward the next support at 1.1780.
Resistance: 1.1922, 1.2050, 1.2119
Support: 1.1830, 1.1780
XAU/USD (4-Hour Chart)
Gold price declined to $1,750 during the European trading hours on Friday. Price continually slumped to below $1,750 in the US session after managing to erase its losses in the late EU session. With the 10-year US Treasury bond yield rising on the trade of the day and a stronger US dollar, the gold price seems hard to gather bullish momentum. Any further advance is taken as a selling opportunity by investors now.
From a technical aspect, the gold price drops below the $1,757 support level, and it turns out to be the pressure level to the upside. RSI indicator is 32 as of writing, suggesting downside momentum. As for the Bollinger Bands, the price tumbled along with the lower bound, staying right above it rather than dropping into the oversold zone, which means a decline before is acceptable and further decline to the downside could be expected. In conclusion, the gold price has dropped below the previous support zone at $1,757 and failed to regain the losses. The price could head to the next pivotal support zone for gold at the $1,714 level, which is the most possible path for gold price from technical analysis.
Looking ahead, in absence of any top-tier US economic events, the repricing of Fed expectations will play a key role in the gold price action. For more price action, all eyes now turn towards the Fed’s Jackson Hole Symposium this week.