US stocks declined lower on Thursday, failing to find many reasons to climb higher and extending its previous slide amid higher bond yields, hawkish Fedspeak, and a surge in equity bullishness. The fresh fears surrounding the economic slowdown ahead of the key US data lend support to the greenback’s gauge versus the six major currencies and weighed on the equity markets.
However, the downbeat comments from the Federal Reserve (Fed) officials and softer US data, as well as China-inspired market optimism in the Asia-Pacific zone, might help the stock market to find recovery strength. On top of that, Japan’s Prime Minister Kishida is expected to name BOJ Governor Kuroda’s successor next week. Speculation revolves around whether Kishida will choose a more aggressive leader for the central bank that will end the ultra-loose monetary policy. On the Eurozone front, the odds of a continuation of bumper interest rate hikes by the ECB are still solid despite a decline in German inflation.

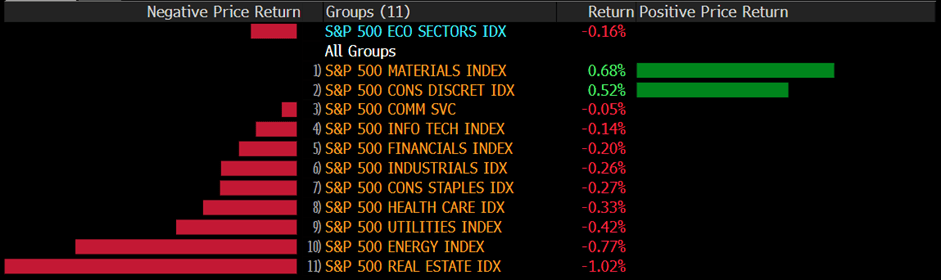
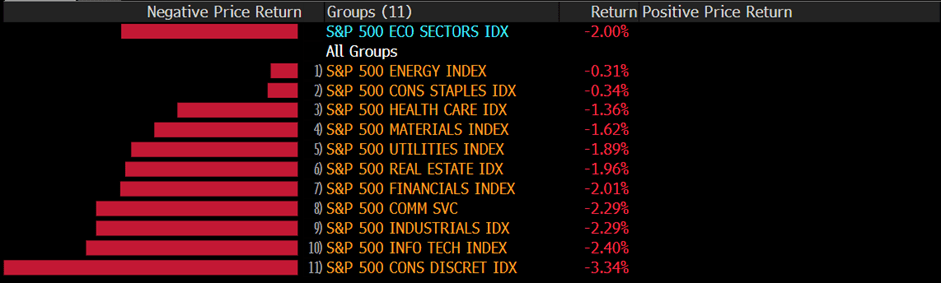
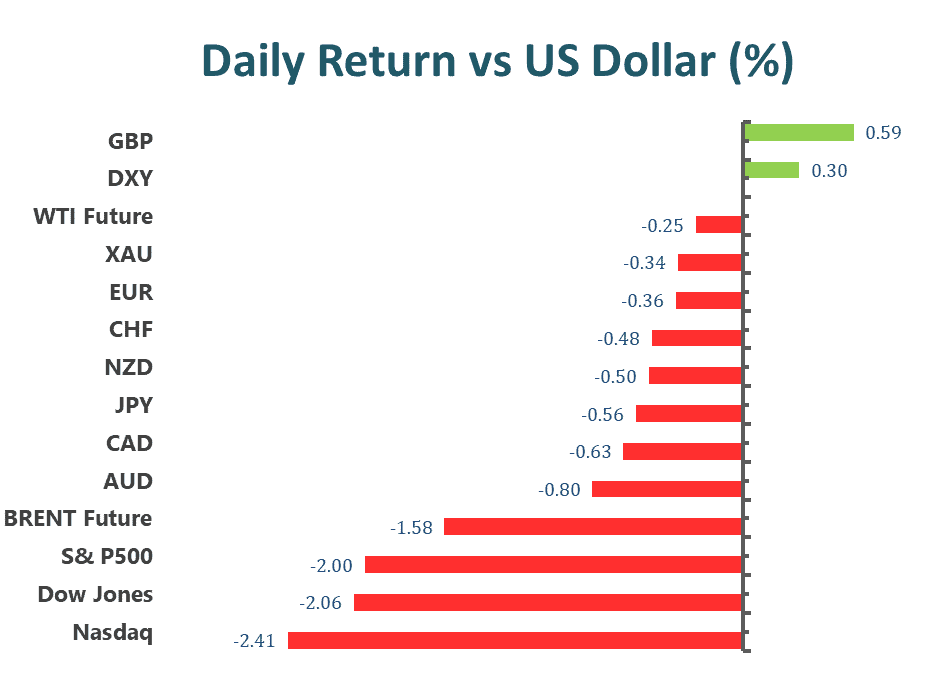
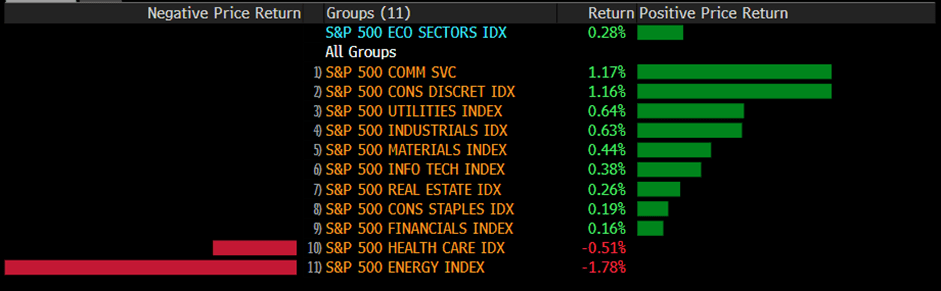
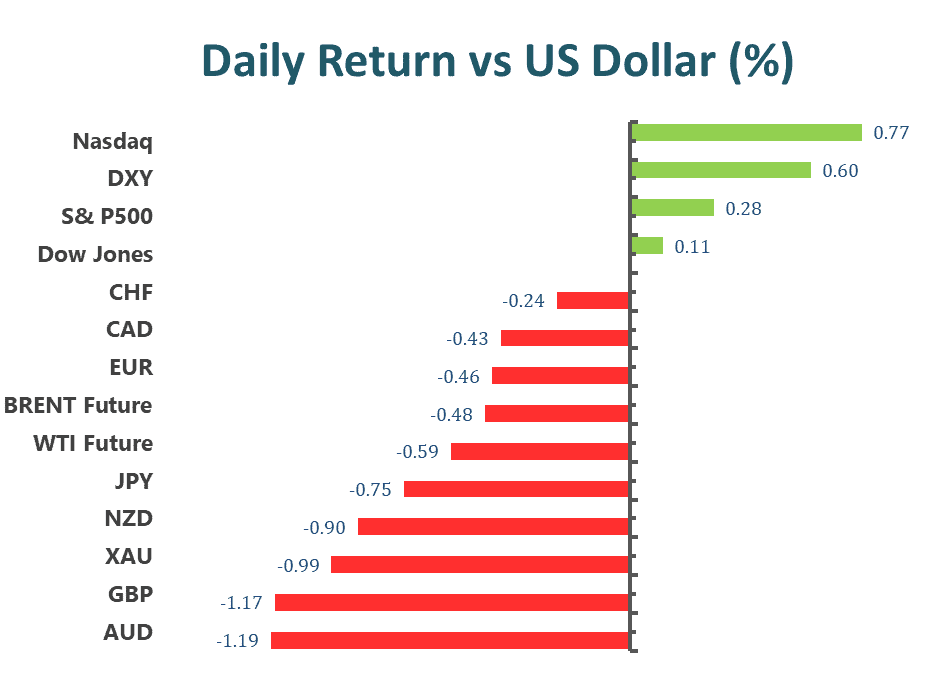
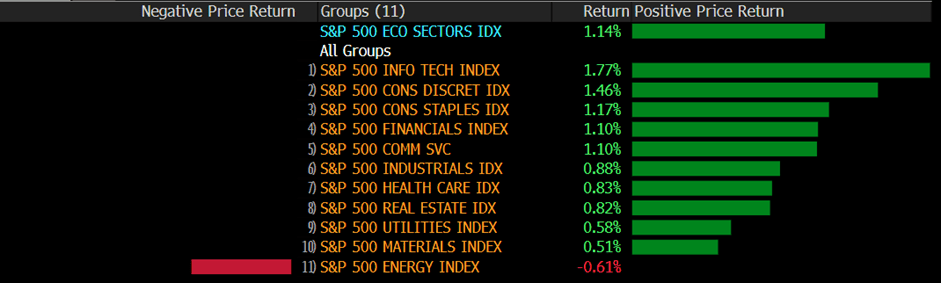
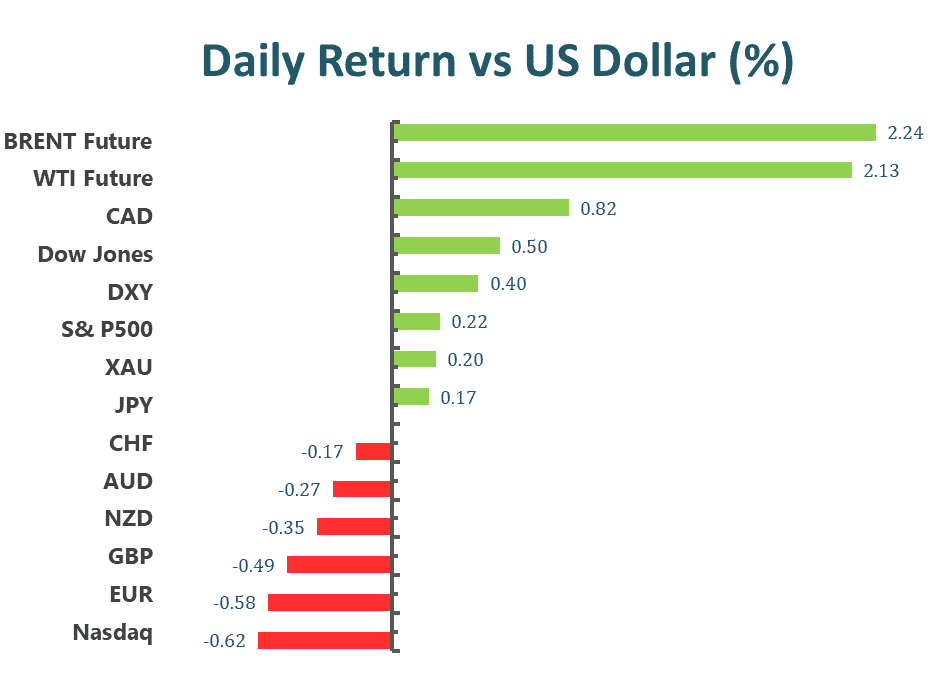
The benchmarks, S&P 500 and Dow Jones Industrial Average both declined lower on Thursday as the S&P 500 wiped out a rally of almost 1% amid renewed recession fears and the cautious mood. The S&P 500 was down 0.9% daily and the Dow Jones Industrial Average also dropped slightly with a 0.7% loss for the day. All eleven sectors in S&P 500 stayed in negative territory as the Communication Services sector and the utility sector are the worst performing among all groups, losing 2.80% and 1.41%, respectively. The Nasdaq 100 meanwhile retreated the most with a 0.9% loss on Thursday and the MSCI World index was down 0.4% for the day.

Main Pairs Movement
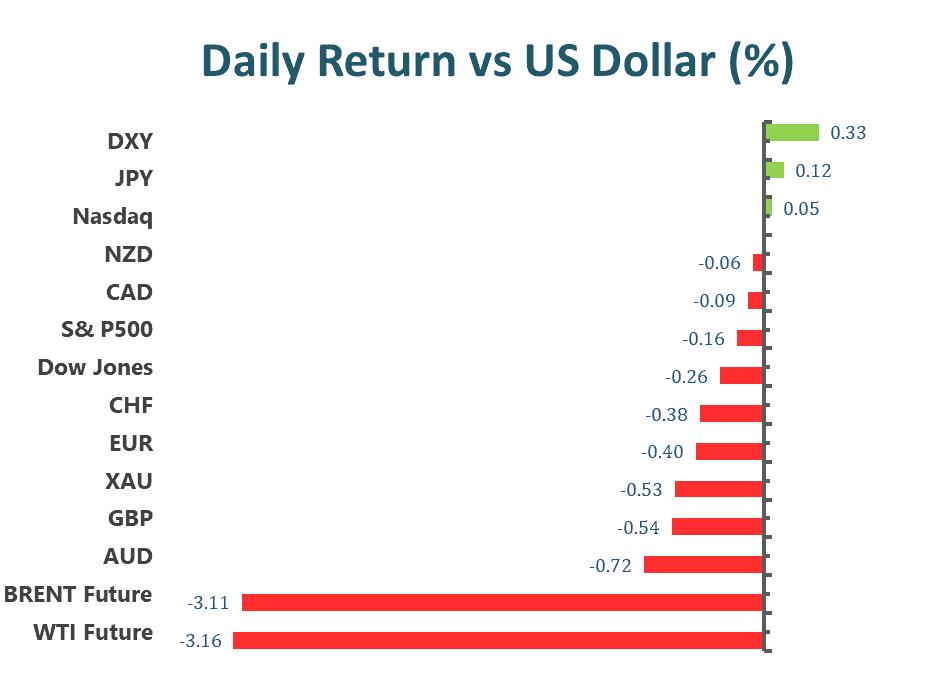
The US dollar retreated lower on Thursday, dropping to a daily low below 102.70 level but then rebounded back amid the fresh fears surrounding the economic slowdown ahead of the key US data. The higher government bond yields and comments from Richmond Fed President Thomas Barkin help the greenback to find demand, as he said that the effects of the Fed’s policy tightening have been substantial while adding that macroeconomic data put back the risk of a recession.
GBP/USD advanced higher on Thursday with a 0.41% gain after the cable preserved its upside traction and touched a daily high above the 1.2180 mark ahead of UK GDP data. On the UK front, the UK GDP is expected to release on Friday and upbeat data could avoid recession fears and support the Pound Sterling. Meanwhile, EUR/USD also witnessed buying interest and climbed to a daily high of around 1.0790 area. The pair was up almost 0.26% for the day.
Gold declined sharply with a 0.73% loss for the day after retreating from a daily top and extended its slide towards the $1860 area during the US trading session, as the higher US Treasury bond yields renewed recession fears and exerted bearish pressures on the yellow metal. Meanwhile, WTI Oil dropped lower with a 0.52% loss for the day. Oil prices dropped as Asia’s earthquake worries faded.
Technical Analysis
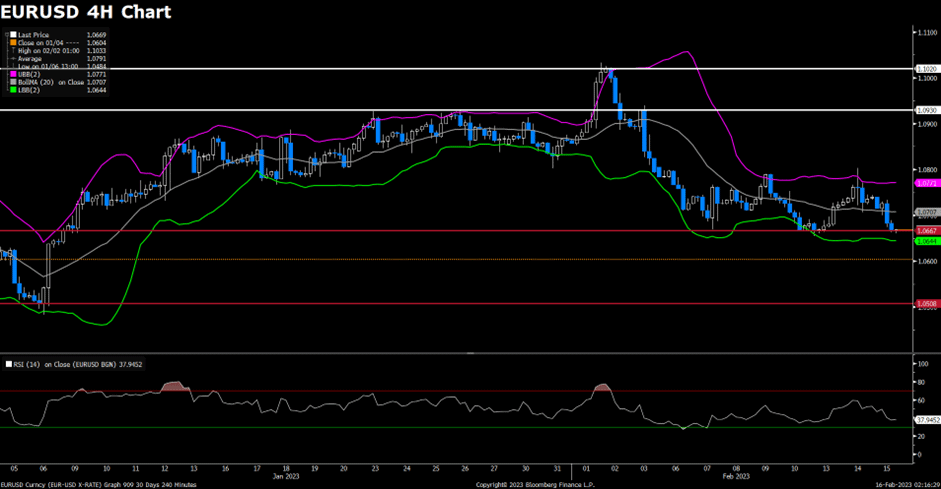
EURUSD (4-Hour Chart)
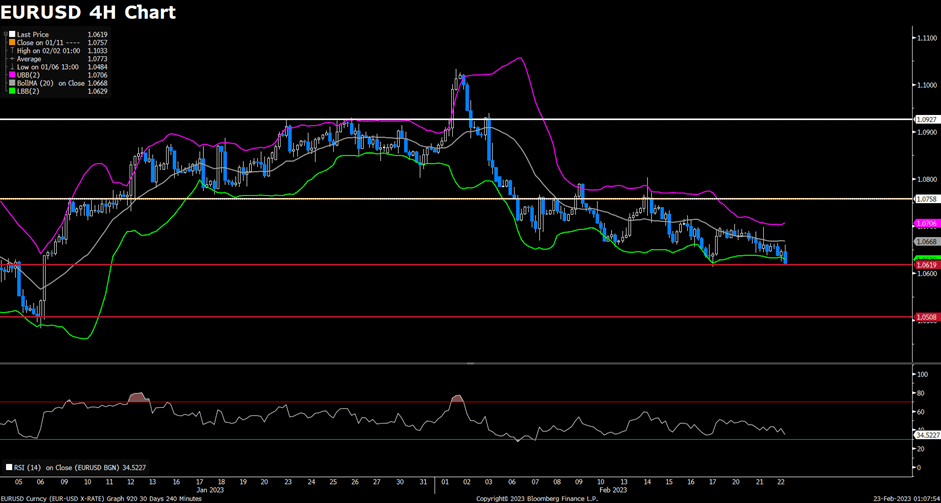
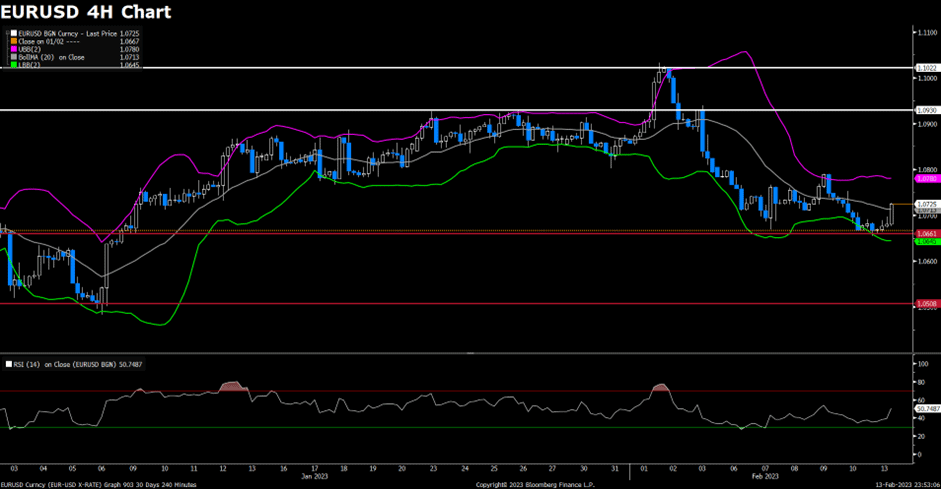
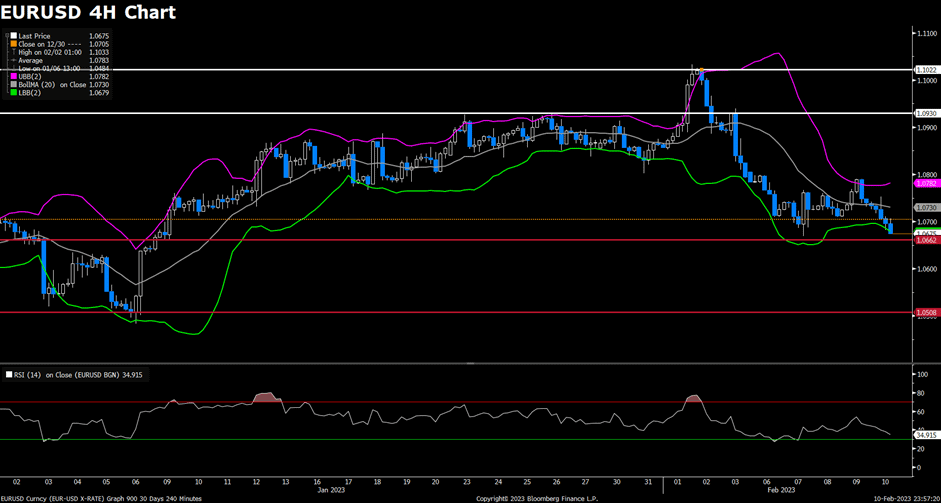
The EURUSD lost its upside traction after reaching the 1.0800 area at the beginning of the US trading session and struggled to hold above the 1.0750 level as of writing. The US Dollar regains strength and limits the pair’s upside room with Wall Street’s main indexes retreating from opening highs. On Thursday, a better market mood alongside sliding US Treasury yields undermined US dollar demand. Softer-than-expected German inflation figures triggered a short-lived reaction as the Harmonized Index of Consumer Prices (HICP) unexpectedly rose by 9.2% YoY in January, below the 10% expected and easing from the previous 9.6%, which means the ECB can decelerate the pace of tightening. Apart from this, the ECB member and Bank of France head, Francois Villeroy de Galhau, hit the wires and said that he thinks he can exclude a recession in the French as of today. His words provided an extra boost for the Euro currency.

From a technical perspective, the four-hour scale RSI indicator slid to 48 as of writing, suggesting that the pair’s momentum turned neutral and any event may be a decisive move. As for the Bollinger Bands, the EURUSD is trading in the upper area and supported by a 20-period moving average, showing the pair is on the defensive in the near term.
Resistance: 1.0930, 1.1024
Support: 1.0661, 1.0508
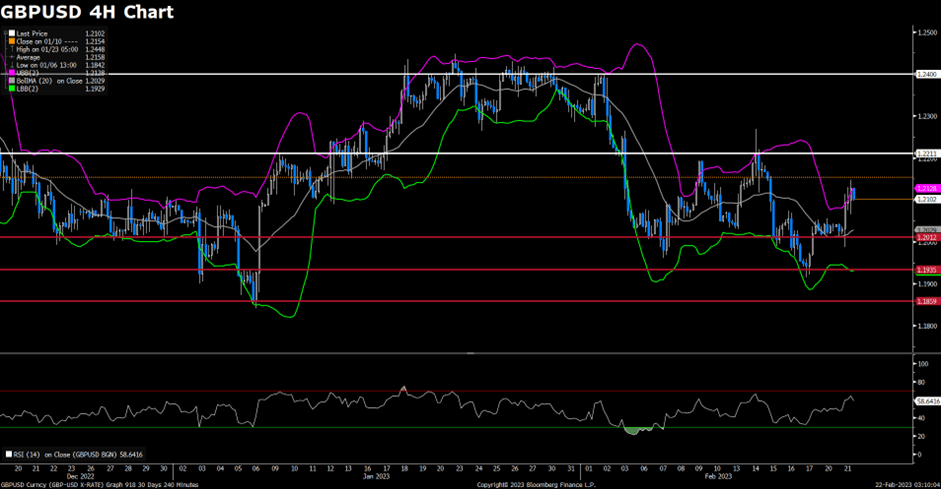
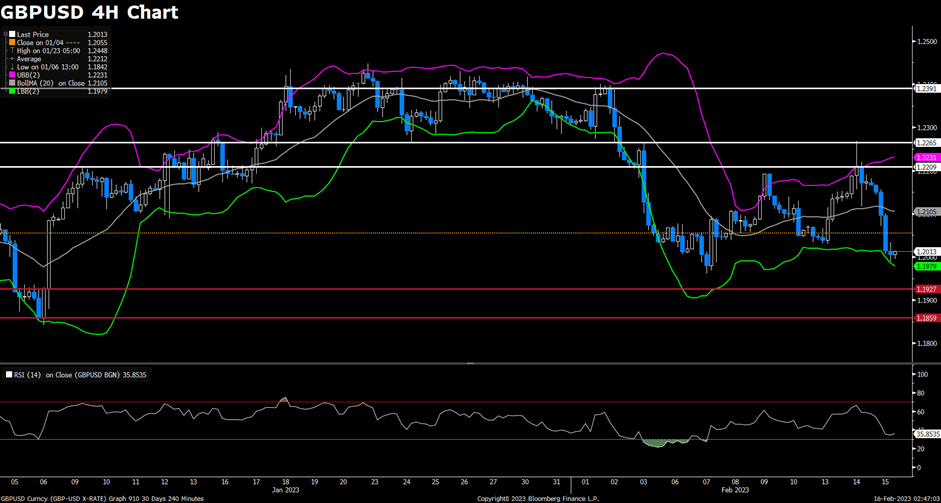
GBPUSD (4-Hour Chart)
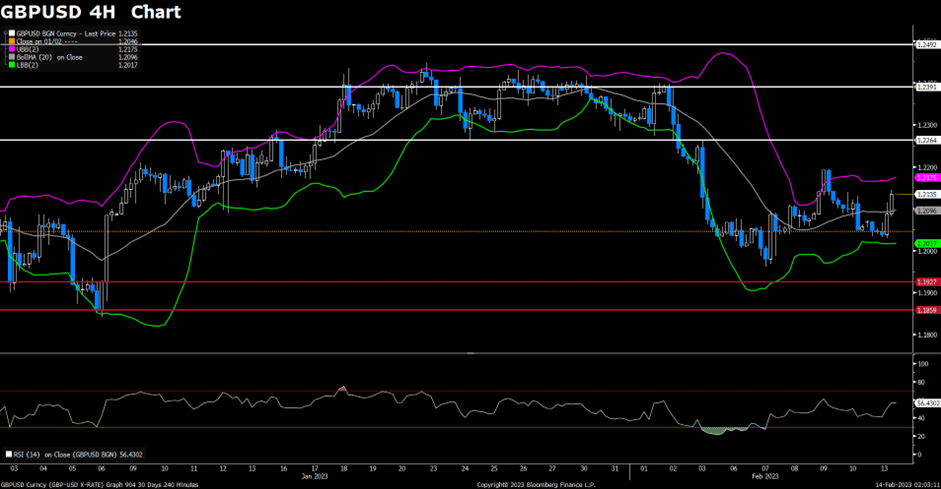
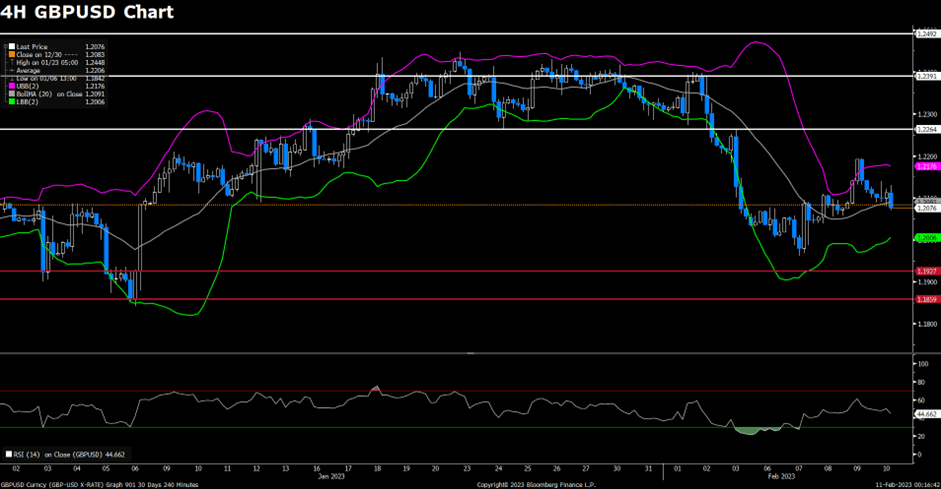
The GBPUSD has managed to build on earlier gains and touched its highest level in nearly a week above 1.2170 on Thursday before retreating modestly. BOE policymakers’ cautious comments on the inflation outlook and the US Dollar’s uninspiring performance fueled the pair’s rally. Traders might refrain from placing aggressive bullish bets around the British Pound amid a dovish assessment of the Bank of England’s policy decision last week. The UK central bank removed the phrase that they would “respond forcefully, as necessary”. Furthermore, BoE Governor Andrew Bailey said that inflation will fall more rapidly during the second half of 2023. This suggested that the BoE was becoming increasingly unsure as to whether further policy tightening is warranted and that the current rate-hiking cycle might be nearing the end. Hence, investors will look to the BoE’s monetary policy report hearing for clues about future rate hikes, which might influence the Sterling.

From the technical perspective, the four-hour scale RSI indicator slightly slid to 52 at the moment of writing, showing that the pair have no critical traction to dominate the moving direction. As for the Bollinger Bands, the pair has just fallen below the upper band and the gap size had little changed, which is a sign that the bullish momentum tends to slow down.
Resistance: 1.2265, 1.2393, 1.2493
Support: 1.1927, 1.1858
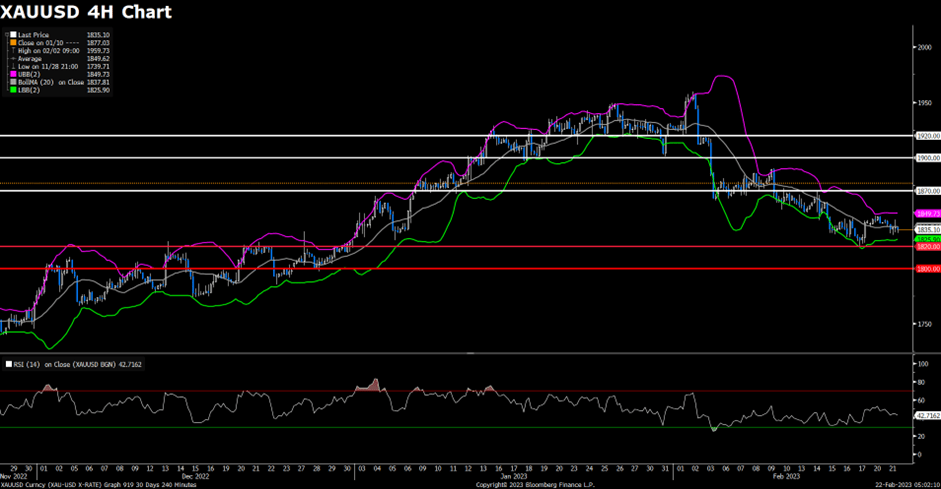
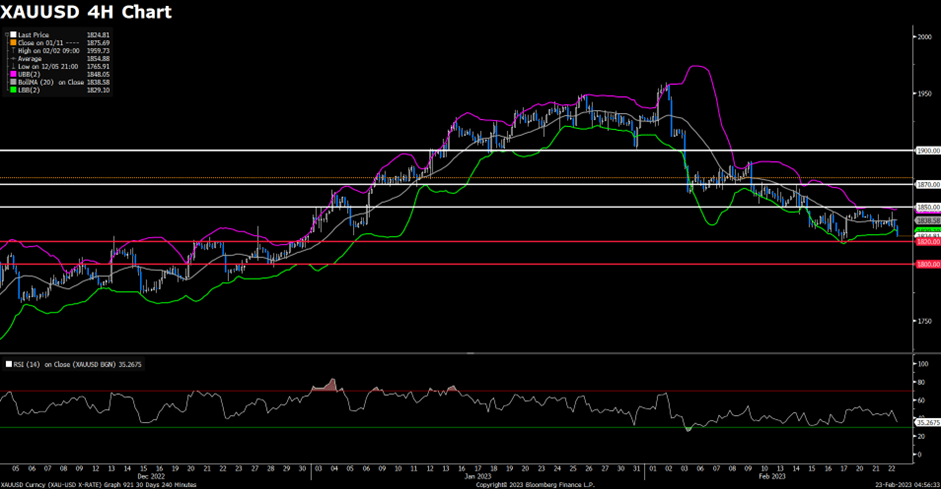
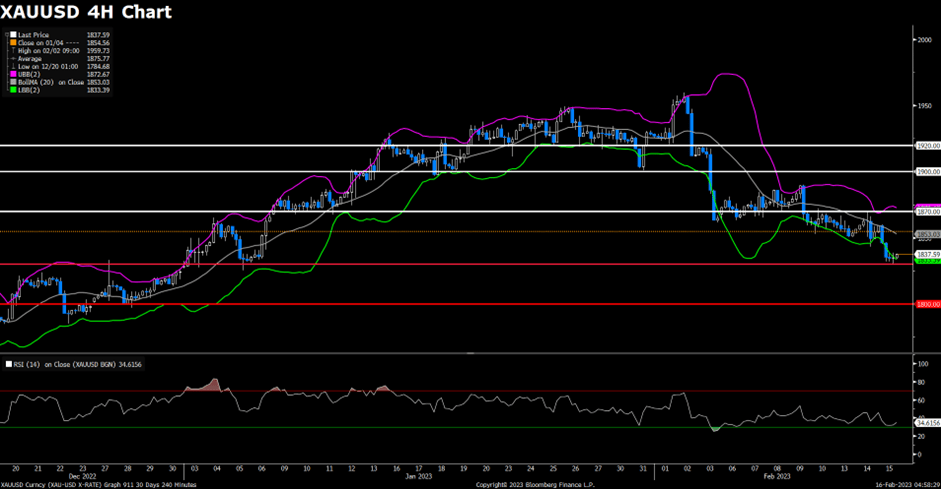
XAUUSD (4-Hour Chart)
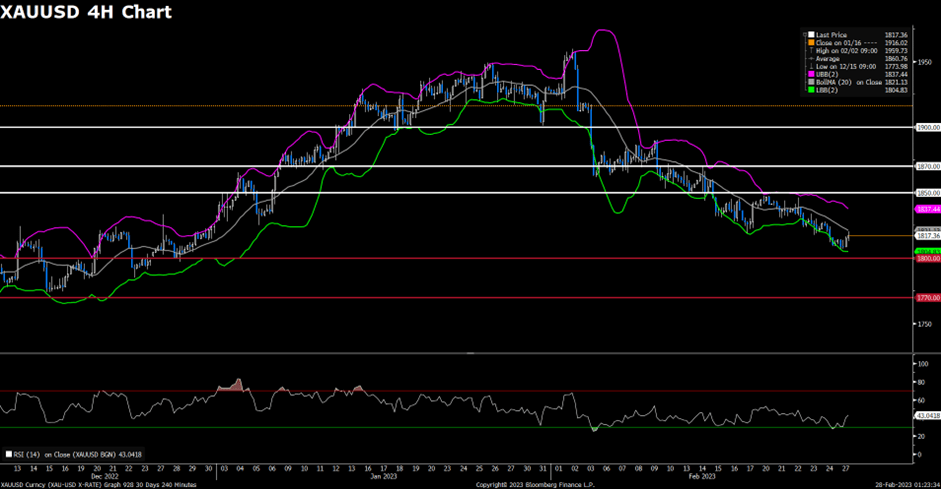
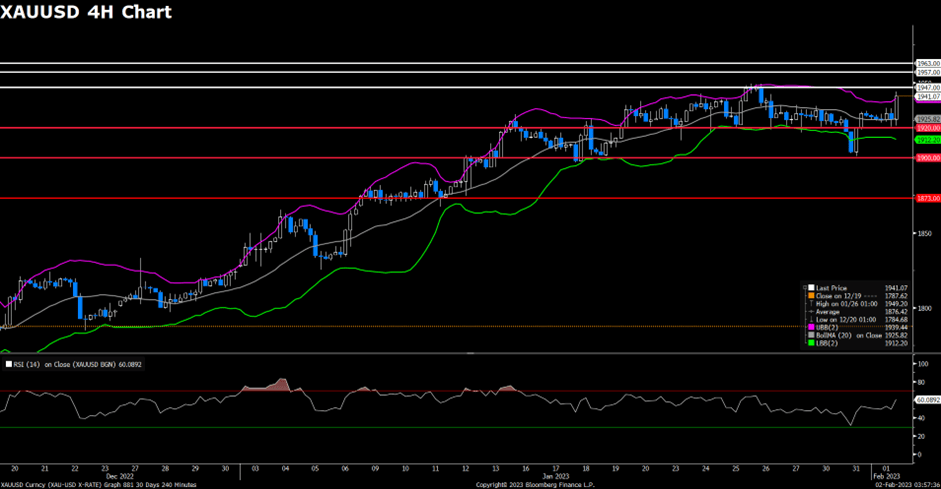
Gold prices were volatile in the course of trading on Thursday. Earlier, the price surged to $1,889.73 in the EU trading session. Later in the US trading session, it started to reverse from its daily high, falling towards $1,860. At the time of writing, the Gold price is trading at $1,865.59, posting a 0.56% loss daily. The US dollar index declined 0.23% to 103.229, while the benchmark US 10 Year Treasury Yield rose 1.97% to 3.684, which seems to cap on Gold price. The following trend for Gold prices still depends on the rate hiking path from the Fed. For more price action, eye on the comments from Federal Reserve officials and the US economic reports.

For the technical aspect, RSI indicator 39 figures as of writing, sliding from mid-line as the price staged a downside correction. As for the Bollinger Bands, the price is moving up and down around the moving average. The main traction seems unclear for now. In conclusion, the price is capped in a narrow range so far this week, and it needs a decisive breakthrough to confirm the path in the near term. That said, we think the bearish is more favored as the rally today was rejected. A downtrend should persist. For the downtrend scenario, the price is currently holding above support at $1,860. If the price drops below the current support, it may trigger some technical selling and drag the price deeper.
Resistance: 1900, 1920, 1957
Support: 1860, 1830, 1800
Economic Data
| Currency | Data | Time (GMT + 8) | Forecast |
| GBP | GDP (QoQ) (Q4) | 15:00 | 0.0% |
| GBP | GDP (MoM) (Dec) | 15:00 | -0.3% |
| GBP | GDP (YoY) (Q4) | 15:00 | 0.4% |
| GBP | Manufacturing Production (MoM) (Dec) | 15:00 | -0.2% |
| GBP | Monthly GDP 3M/3M Change (Dec) | 15:00 | |
| EUR | EU Leaders Summit | 18:00 | |
| RUB | Interest Rate Decision (Feb) | 18:30 | 7.50% |
| CAD | Employment Change (Jan) | 21:30 | 15.0K |