Back

Calculating Pips with Confidence: A Practical Guide for Forex Traders

Imagine you’re at a bustling street market in a foreign country, excited to exchange your currency for the local one. As you approach the currency exchange booth, you notice that the exchange rates are constantly changing. 

Every time you see the rates fluctuate, even by the tiniest amount, it affects the amount of money you’ll receive in return. That’s where the concept of pips comes into play in the world of Forex trading. 

source: CNBC

What is a Pip? 

In the world of Forex trading, a pip is the equivalent of the change you witnessed at the currency exchange booth. It stands for “Percentage in Point.” 

A pip represents the smallest unit of price movement in a currency pair. Just like the ever-changing exchange rates at the booth, pips indicate the shifts in currency values that traders monitor closely. 

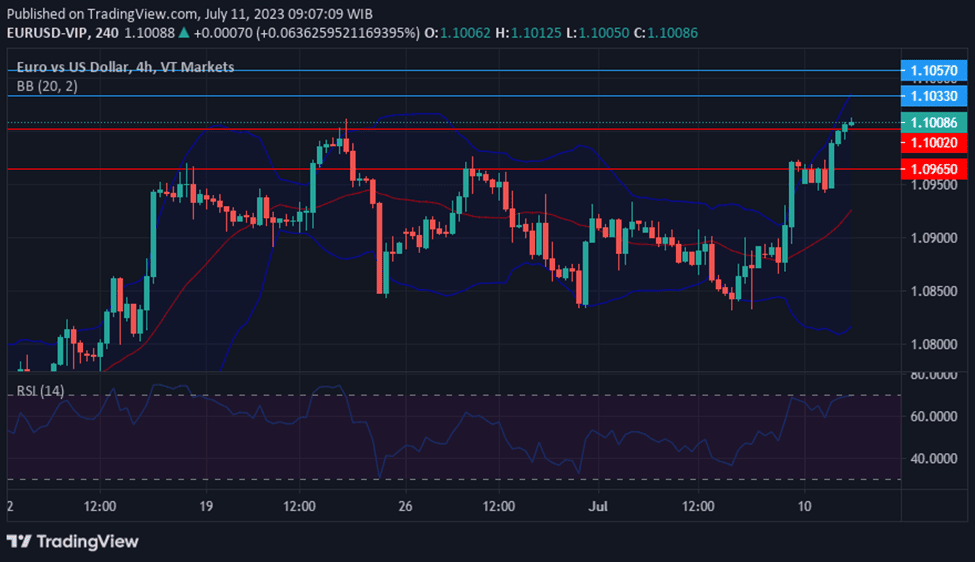
Let’s take an example to illustrate this further. Consider the popular EUR/USD currency pair. If the exchange rate for EUR/USD moves from 1.2000 to 1.2001, it means a change of 1 pip. This seemingly small alteration carries significant meaning in the Forex market. 

Understanding Pipettes 

Now, you might wonder if there’s a way to measure even smaller changes in currency values. That’s where pipettes come into play. 

Imagine you’re looking at the EUR/USD pair again, and this time, the exchange rate moves from 1.20000 to 1.20001. This indicates a change of 1 pipette. Pipettes allow for more precise measurements, giving traders a finer level of detail when analysing currency movements. 

In most cases, there are 10 pipettes in one pip. By differentiating between pips and pipettes, traders can gain a more accurate understanding of price fluctuations in the Forex market. 

The Role of Pips in Forex Trading 

Pips play a vital role in Forex trading, acting as the key to unlocking profits and managing risks. They help determine the relative value and volatility of different currency pairs. Let’s explore their significance further through some examples. 

Consider major currency pairs like the EUR/USD or GBP/USD. These pairs typically have small pip values, usually around 0.0001. On the other hand, cross currency pairs, such as the EUR/GBP or GBP/JPY, might have higher pip values, such as 0.001 or more. 

When trading, it’s crucial to be able to read and understand pip values on trading platforms. Most platforms automatically display pip values for currency pairs, allowing you to assess potential gains or losses accurately. 

Don’t underestimate the significance of even small changes in pip values. A seemingly minor movement of just a few pips can have a notable impact on your trades, especially when trading larger positions or utilising leverage. 

Pips and Lot Sizes 

Now that we’ve explored pips, let’s discuss their relationship with lot sizes. In Forex trading, a lot refers to the standardised quantity of a currency pair that you trade. Different lot sizes are available, including standard (100,000 units), mini (10,000 units), and micro (1,000 units). 

The size of your lot determines the pip value. As the lot size increases, so does the pip value. For example, if the pip value for one standard lot is $10, the pip value for one mini lot would be $1, and for one micro lot, it would be $0.10. 

Understanding lot sizes is crucial for managing risk effectively. Aligning your lot size with your risk tolerance and account size allows for better control over potential gains and losses. 

Pip Spreads and Trading Costs 

Pip spreads refer to the difference between the bid price (selling price) and the ask price (buying price) of a currency pair. It represents the cost of entering or exiting a trade. Brokers usually earn their profits from spreads. 

For example, if the bid price for EUR/USD is 1.2500, and the ask price is 1.2502, the spread would be 2 pips. Understanding and comparing spreads among different brokers is important to optimise your trading costs. 

Trading costs, including spreads, affect your overall profitability. Tighter spreads can be advantageous, especially for frequent traders or those executing scalping strategies. Try VT Markets RAW ECN Account with spreads starting from 0.0 pips. 

Pip Calculations and Pipettes in Practice 

Calculating pip values is essential to assess potential profits or losses. Let’s go through a step-by-step guide: 

  • Step 1. Identify the currency pair you’re trading and its exchange rate. 
  • Step 2. Determine the pip value by considering the lot size and the pip value for that particular currency pair. 
  • Step 3. Incorporate pipettes if necessary. For instance, if a currency pair has a pipette value of 0.1, the pip value would be ten times smaller than a regular pip. 

Practicing pip calculations using different currency pairs and lot sizes will enhance your understanding and proficiency in this fundamental aspect of trading. 

Practical Tips for Pip Management 

To effectively manage pips and optimise your trading strategy, consider the following tips: 

  • Set realistic profit targets based on pip values and market conditions. 
  • Understand the risk-to-reward ratio before entering a trade to ensure favourable risk management. 
  • Utilise stop-loss and take-profit orders to automate trade exits at predetermined levels, protecting your capital and securing profits. 
  • Manage leverage cautiously, as it amplifies both profits and losses based on pip movements. 

By implementing these practical tips, you’ll develop a disciplined approach to trading and enhance your overall success rate. 

In conclusion, pips are the building blocks of measuring price movements, determining profits and losses, and managing risk. Remember to practice pip calculations and familiarise yourself with various currency pairs to become a proficient trader. Stay curious, keep learning, and may your trading journey be filled with pips of success! 

Summary: 
  • Pips represent the smallest unit of price movement in Forex trading, indicating changes in currency values. 
  • Pipettes are fractional pips that allow for more precise measurements of price movements. 
  • Pips play a crucial role in determining profits and losses, and their values vary among currency pairs. 
  • Pip spreads represent the difference between buying and selling prices and impact trading costs. 
  • Practical tips for pip management include setting realistic profit targets, understanding risk-to-reward ratio, using stop-loss and take-profit orders, and managing leverage carefully. 

Wall Street Prepares for Earnings Season Amidst Optimism and Economic Uncertainty

In a positive start to the week, stock markets experienced gains as Wall Street braced itself for the release of quarterly reports from major global companies. The Dow Jones Industrial Average reached its highest closing level in 2023, adding 76.32 points (0.22%) to close at 34,585.35. The S&P 500 climbed 0.39% to end the session at 4,522.79, and the Nasdaq Composite advanced 0.93% to 14,244.95. Notably, tech-giant Apple saw a 1.7% increase, Tesla climbed 3.2%, and JPMorgan Chase shares ticked up 2.4%.

The second-quarter earnings season gains momentum this week, with notable reports from major financial institutions like Bank of America, Morgan Stanley, and Goldman Sachs, along with companies such as United Airlines, Las Vegas Sands, Tesla, and Netflix. Analysts anticipate a challenging season, with a projected decline of over 7% in S&P 500 earnings compared to the previous year. Additionally, as the Federal Reserve enters its “blackout period” before its July policy meeting, traders are expecting a 97% likelihood of interest rate hikes later this month, after pausing them in June.

Despite concerns over profitability and economic performance, the stock market experienced a winning week, with the Dow Jones Industrial Average gaining 2.3%, its best weekly gain since March. The S&P 500 and Nasdaq Composite also saw gains of 2.4% and 3.3%, respectively. Market sentiment appears to be buoyed by the belief in a disinflationary, soft landing scenario. Ed Yardeni, president of Yardeni Research, expressed his perspective that although the economy may be experiencing a rolling recession, it is not a widespread economic downturn. Instead, he sees it as a rolling recovery.

These market movements were influenced by positive big bank earnings and softer inflation reports, which instilled hope that the central bank can effectively manage inflation without pushing the economy into a recession. As investors eagerly await earnings reports and monitor the Federal Reserve’s upcoming decisions, Wall Street faces a mixture of optimism and economic uncertainty.

Data by Bloomberg

On Monday, the stock market showed a mixed performance. Information Technology had a strong day, gaining 1.33%, while sectors like Utilities and Communication Services experienced declines of 1.18% and 0.65% respectively. The overall market ended with a 0.39% increase.

Check out Share CFDs with VT Markets

Major Pair Movement

The US dollar index experienced a slight decline of 0.1% as its rebound from last week’s significant drop started to fade. Investors were eagerly awaiting the release of US retail sales data, which would determine whether the recent selloff driven by disinflation concerns would continue. Despite indications of disinflation and expectations of future rate hikes, the dollar had reached an oversold condition against major currencies such as the euro, yen, and pound. The currency was in need of consolidation or a correction, especially after the surprisingly positive July Michigan consumer sentiment, which suggested that the US economy was handling the Federal Reserve’s rate hikes better than anticipated.

The performance of the euro against the US dollar saw a slight increase of 0.1% after experiencing a decline from its recent high. Despite reports of falling German wholesale prices and unexpected drops in exports, the euro maintained its strong gains from July. Additionally, the yield spreads between 2-year bunds and US Treasury bonds remained significantly negative. The recovery of the US dollar against the Japanese yen faced resistance at a previously broken uptrend line, although Monday’s trading range exhibited higher lows and highs for the first time since the trend high in late June. The British pound declined by 0.1% ahead of the release of US retail sales and UK Consumer Price Index (CPI) data scheduled for Tuesday and Wednesday, respectively.

Picks of the Day Analysis

EUR/USD (4 Hours)

EUR/USDTrades Rangebound as USD Weakens Despite Tepid Chinese Data and ECB Comments

The EUR/USD pair traded within a narrow range on Monday, hovering around 1.1240. The US Dollar weakened during American trading hours, despite tepid Chinese GDP data. European Central Bank (ECB) officials provided little fresh insight, with policymakers mentioning the need to tighten policy and raise interest rates based on upcoming data. ECB President Christine Lagarde expressed concerns about stagnant GDP growth and increasing trade restrictions. The Fed and ECB will announce their monetary policy decisions next week. In terms of US economic data, the NY Empire State Manufacturing Index for July came in below expectations but exceeded the previous month’s figure, while June Retail Sales, Industrial Production, and Capacity Utilization are set to be released on Tuesday.

Chart EURUSD by TradingView

Learn more about Forex Trading here

According to technical analysis, the EUR/USD pair is experiencing a flat consolidating movement on Monday, creating the Bollinger Bands to squeeze. The price is still near the upper bands of the Bollinger Bands. This suggests that the price has the potential to reach the upper band of the Bollinger Bands. Additionally, the Relative Strength Index (RSI) is currently at 78, which is within the overbought area, indicating a bullish trend for the EUR/USD.

Resistance: 1.1291, 1.1382

Support: 1.1173, 1.1086

XAU/USD (4 Hours)

Gold (XAU/USD) Temporarily Ease as Market Awaits Central Bank Updates and US Inflation Progress

Gold prices showed a temporary decline on Monday, with XAU/USD trading around $1,954, remaining flat for the day after reaching a low of $1,945.72 per troy ounce. Investor excitement in the financial markets calmed down as attention turned to upcoming key events, including central bank announcements and an update on US inflation. The US Dollar made a modest recovery after its recent collapse, although its gains were insignificant compared to the sell-off triggered by speculation that the Federal Reserve may end its tightening cycle earlier than expected. US inflation data, such as the Consumer Price Index (CPI) and Producer Price Index (PPI), came in below expectations, suggesting that the Fed may only implement one rate hike instead of the anticipated two.

Chart XAUUSD by TradingView

According to technical analysis, the XAU/USD pair underwent a consolidating movement on Monday, around the middle band of the Bollinger Bands. Suggesting the possibility of further upward movement. This indicates the potential for the price to reach the upper band of the Bollinger Bands. Furthermore, the Relative Strength Index (RSI) is currently at 59, within the overbought area, indicating a neutral but slightly bullish trend for the XAU/USD.

Resistance: $1,965, $1,981

Support: $1,946, $1,929

Economic Data

CurrencyDataTime (GMT + 8)Forecast
CADConsumer Price Index20:300.3%
USDRetail Sales20:300.5%

Week Ahead: Markets to Focus on US Retail Sales and Canada, UK CPI

This week’s economic calendar features US Retail Sales figures, as well as inflation data from both the UK and Canada — all of which have the capacity to move markets significantly. Therefore, it is crucial for traders to be prepared for any volatility that may arise from these key announcements and adjust their approaches as needed.

Keep an eye on the following economic releases:

Canada Consumer Price Index (18 July 2023)

Consumer prices in Canada rose by 0.4% in May 2023, slowing from the 0.7% increase in the previous month. 

Analysts anticipate a 0.4% increase in the figures for June, set to be released on 18 July.

US Retail Sales (18 July 2023) 

US retail sales rose 0.3% month-over-month in May 2023, following a 0.4% increase in April.

Analysts expect a similar 0.3% growth in the figures for June, scheduled for release on 18 July.

New Zealand Consumer Price Index (19 July 2023) 

The Consumer Price Index in New Zealand rose by 1.2% in the March quarter, representing the smallest quarterly price increase since Q1 2021.

Analysts predict a 1.1% uptick in figures for the upcoming quarter, set to be released on 19 July.

UK Consumer Price Index (19 July 2023) 

The UK’s consumer price inflation remained stable at 8.7% in May 2023, repeating the 13-month low recorded in the previous month. 

Anticipated for release on July 19, the upcoming CPI data is expected to show a further decline to 8.3%.

Employment in Australia (20 July 2023) 

Employment in Australia surged by 75,900 to 14.1 million in May 2023. This followed a revised drop of around 4,000 in the previous month. Meanwhile, the unemployment rate decreased to 3.6%, down from April’s figure of 3.7%. 

Analysts expect employment figures to increase by 25,100 in the data for June 2023, set to be released on 20 July. The unemployment rate is expected to remain steady at 3.6%. 

Start trading now — click here to create your live VT Markets account.

服务器升级维护通知 – 2023年07月14日

尊敬的用户:

您好! VT Markets 致力于为客户提供更快速且稳定的交易环境,我们将于周末进行服务器 (MT4/MT5) 升级维护。

维护时段:
2023 年 07 月 15 日 (星期六) 07:00 至 13:30

上述时段采用 GMT+8

维护期间请您务必留意下列事项:

1. 服务器报价将会暂停,客户将无法建立新仓位或是关闭既有持仓。

2. 维护前后的市场价格可能发生跳空,在跳空范围内的挂单或止损/止盈设置将在维护结束后的市场价格成交。

3. 具体维护完毕与开盘时间请依据MT4/MT5软件为准。

望您谅解因此次升级维护为您所带来的不便,我们将继续为您提供更优质的服务。

如您有任何疑问,我们的团队将十分乐意为您解答。
请留言或发邮件至 [email protected] 或联系在线客服。

Stocks Rise as Inflation Data Eases Concerns

Stocks surged on Thursday as the latest inflation data came below expectations, leading to renewed optimism in the market. The S&P 500 and the Nasdaq Composite reached their highest levels in over a year, with the S&P 500 climbing 0.85% to 4,510.04 and the Nasdaq Composite advancing 1.58% to 14,138.57.

The Dow Jones Industrial Average also saw a modest gain of 0.14%, adding 47.71 points to close at 34,395.14. Notably, cybersecurity stock Palo Alto Networks saw a notable increase of 2.7%, while MGM Resorts and Alphabet rose 4.1% and 4.7%, respectively.

The positive market performance was attributed to the release of June’s producer price index (PPI) report, which indicated a smaller increase than anticipated. The PPI, measuring wholesale prices, rose by 0.1% in June, falling short of economists’ expectations of a 0.2% increase.

Furthermore, the core PPI, excluding volatile food and energy prices, also rose by 0.1%, below the anticipated level. The favourable inflation data further complemented the optimism generated by Wednesday’s consumer price index report, fueling investors’ confidence in the market.

All sectors performance with a positive trend except for Health Care and Energy sectors.

Data by Bloomberg

On Thursday, the overall market experienced a positive trend, with all sectors showing gains except for the Health Care and Energy sectors. The communication services sector had the highest increase, rising by 2.32%. The Information Technology and Consumer Discretionary sectors also performed well, with gains of 1.49% and 1.08% respectively.

The Materials and Real Estate sectors saw moderate increases of 0.79% and 0.67% respectively. The Consumer Staples, Utilities, Financials, and Industrials sectors also showed positive but smaller gains, ranging from 0.38% to 0.37%. However, the Health Care sector experienced a marginal decline of -0.01%, while the energy sector showed a decrease of -0.45%.

Major Pair Movement

The dollar index experienced a significant decline of 0.7%, marking a weekly plunge of 2.4% and dropping below 100 for the first time since April 2022. This decline in the dollar was accompanied by a decrease in 2-year Treasury yields by 12 basis points. Market expectations now suggest that the Federal Reserve’s rate hike in July will likely be the last one before a series of rate cuts totalling nearly 200 basis points next year.

In contrast, the European Central Bank (ECB) is anticipated to raise rates by 50 basis points before implementing rate cuts of around 65 basis points in the second half of 2024. The positive sentiment toward the euro resulted in a 0.8% increase in the EUR/USD exchange rate, surpassing the key 200-week moving average and reaching its highest level since April 2022.

The anticipation of additional rate hikes and China’s stimulus measures contributed to a surge of 1.5% in the AUD/USD exchange rate. Despite concerns surrounding the situation, USD/CNH fell by 0.25%. The Swiss franc (CHF) experienced a 1% decline against the US dollar (USD), reaching its lowest level since the Swiss National Bank removed its 1.20 EUR/CHF floor in January 2015.

The USD/JPY pair, which had fallen by 4.3% in June, saw a modest increase of 0.34% on Thursday as it encountered support near the 138 expiry level. If the pair closes below the 38.2% Fibonacci retracement level of its advance in 2023, at 138.25 and 138, further downward pressure may be expected.

Additionally, gold prices rose by 1.1% following the departure of a member of the Bank of England (BoE), reinforcing expectations of aggressive rate hikes totalling 117 basis points to address the current economic challenges.

Picks of the Day Analysis
EUR/USD (4 Hours)

EUR/USDGains Momentum Amid Dollar Sell-Off and ECB’s Interest Rate Speculation

The EUR/USD currency pair extended its upward trajectory for the sixth consecutive day as the US Dollar experienced another round of selling pressure, driven by US inflation data indicating a slowdown. The negative momentum of the Dollar persists, potentially paving the way for further gains, although the extent of the rally suggests a potential consolidation or modest correction.

The European Central Bank (ECB) released minutes from its recent meeting, echoing President Lagarde’s comments about potential interest rate hikes beyond July if deemed necessary. Meanwhile, upcoming economic growth forecasts and trade balance data from the European Commission, along with declining US and Eurozone yields, continue to shape the market sentiment. The latest Producer Price Index figures highlighted a further slowdown in inflation, leading to additional losses for the Dollar, while the upcoming Consumer Confidence data is anticipated on Friday.

EURUSD gains as the US Dollar experienced another round of selling pressure, driven by US inflation data

Chart EURUSD by TradingView

According to technical analysis, the EUR/USD pair is experiencing an upward movement on Thursday, pushing towards the upper band of the Bollinger Bands. Currently, the price is still near the upper bands of the Bollinger Bands, and the bands themselves indicate the potential for further upward movement.

This suggests that the price has the potential to reach the upper band of the Bollinger Bands. Additionally, the Relative Strength Index (RSI) is currently at 84, which is within the overbought area, indicating a bullish trend for the EUR/USD.

Resistance: 1.1291, 1.1382

Support: 1.1173, 1.1086

XAU/USD (4 Hours)

Gold (XAU/USD) Consolidates as Markets Remain Optimistic on US Inflation Easing

Gold prices held steady at $1,958 per troy ounce as financial markets maintained an optimistic outlook on easing United States (US) inflation. The release of the Producer Price Index (PPI) indicated a modest year-on-year and month-on-month increase of 0.1%. The core annual reading of 2.4% was lower than expected and the previous figure, reinforcing positive sentiment.

Despite the US Dollar’s decline, investors turned their attention to high-yielding assets, resulting in limited gains for gold. While Wall Street maintained modest gains, comments from San Francisco Federal Reserve President Mary Daly expressing the need for rate hikes impacted stocks, citing the economy’s momentum and uncertain wage growth’s impact on inflation.

XAUUSD consolidates as markets remain optimistic on US Inflation easing

Chart XAUUSD by TradingView

According to technical analysis, the XAU/USD pair underwent a consolidating movement on Thursday, near the upper band of the Bollinger Bands. Suggesting the possibility of further upward movement.

This indicates the potential for the price to reach the upper band of the Bollinger Bands. Furthermore, the Relative Strength Index (RSI) is currently at 71, within the overbought area, indicating a bullish trend for the XAU/USD.

Resistance: $1,965, $1,981

Support: $1,946, $1,929

Economic Data

CurrencyDataTime (GMT + 8)Forecast
USDPrelim UoM Consumer Sentiment22:0065.5

Start trading now — click here to create your live VT Markets account.

Optimistic Data Spurs Stock Market Rise Amid Inflation Concerns

Stocks experienced a notable upswing on Wednesday as investors found hope in newly released data indicating the Federal Reserve’s potential to manage inflation without triggering a recession in the U.S. economy.

The S&P 500 reached its highest level of the year 2023, reflecting the overall positive sentiment in the market. Bank stocks, including Citigroup and Goldman Sachs, saw significant gains, contributing to the upward momentum.

Although the consumer price index for June rose 3% year-over-year, it fell slightly below economists’ expectations, while the core CPI, which excludes volatile food and energy prices, also rose less than anticipated.

While this was viewed as a positive sign, analysts emphasized that the Federal Reserve remains vigilant about areas such as service inflation, wage inflation, and housing inflation, which still persist at uncomfortably high levels.

Investors are closely watching both the consumer price index and the producer price index for insights into future interest rate adjustments by the Federal Reserve. The market currently indicates a strong probability of approximately 92% for a Fed interest rate increase during the July meeting.

As the economy continues to navigate the path of inflation, analysts remain cautiously optimistic, acknowledging that despite positive developments, the Federal Reserve’s decision to cut rates is not yet certain.

The market eagerly awaits the release of the upcoming producer price index data for June, which will provide further clarity on inflation trends and potentially impact the central bank’s future moves regarding interest rates.

All sectors' performance showing positive performance amid inflation concerns.

Data by Bloomberg

On Wednesday, the stock market showed positive performance across various sectors. The Communication Services sector saw the highest gain, rising by 1.51%, followed closely by Utilities with a 1.47% increase. Materials and Information Technology sectors also performed well, both gaining 1.29% and 1.25% respectively.

Consumer Discretionary and Energy sectors saw moderate gains of 0.96% and 0.90% respectively. Financials and Real Estate sectors experienced smaller increases of 0.63% and 0.44% respectively. Consumer Staples sector had a modest gain of 0.23%. However, Industrials and Health Care sectors faced slight declines, dropping by 0.20% and 0.28% respectively.

Major Pair Movement

On Wednesday, the U.S. dollar index dropped by 1% as the U.S. CPI data came in below expectations. This led to a significant decrease in Treasury yields and pushed the dollar below its prior lows for 2023. Two-year Treasury yields fell by 15 basis points, outpacing the 12 basis point drop in 10-year yields. This shift in yields suggests a potential signal that the Federal Reserve’s hiking cycle may be coming to an end.

The CPI data, along with a relatively positive beige book report, did not change the market’s expectation of a 25 basis point rate hike in July, which has been priced in since the Fed’s pause in June. However, it did reduce the likelihood of further tightening and increased expectations of rate cuts in 2024 by at least 150 basis points.

The euro to U.S. dollar exchange rate (EUR/USD) increased by 1.1% following a breakout above its prior peak for 2023. EUR/USD is approaching its pivotal 200-week moving average at 1.1183, but further disinflationary U.S. data and the Fed’s stance on 2024 rate cuts may impact its future movements.

The U.S. dollar to Japanese yen exchange rate (USD/JPY) fell by 1.47%, trading below June’s low. It briefly dipped below the 38.2% retracement level of its uptrend for 2023. While USD/JPY is oversold on daily studies, there is a possibility of a corrective bounce if it fails to indicate further decline and closes above 138.25.

The significant recovery of the yen could reduce the need for the Bank of Japan (BoJ) to raise its cap on 10-year JGB yields. As a result, pricing by the Fed and Treasury yields remain crucial factors. Sterling (GBP) rose by 0.44%, but its boost was smaller compared to EUR/USD, as it had already broken out above its prior peak for 2023 earlier in the week.

Picks of the Day Analysis

EUR/USD (4 Hours)

EUR/USD Surges on Weakening US Dollar Amidst Inflation Data, Awaited Economic Reports and Central Bank Minutes

The EUR/USD extended its upward momentum, driven by a sharp decline in the US Dollar following disappointing US inflation data. The pair reached monthly highs as Treasury yields dropped and stocks rallied on Wall Street, boosting risk sentiment.

Market participants anticipate the Federal Reserve’s rate hike in July, but the lower-than-expected inflation figures have sparked optimism that this could be the final increase. Traders are now eagerly awaiting the US Producer Price Index report and the European Commission’s economic forecast, Industrial Production data, and the release of the European Central Bank’s latest meeting minutes.

With ongoing volatility, the pair faces the potential for both continued gains and significant corrections.

EURUSD surges on weakening US dollar amidst inflation data.

Chart EURUSD by TradingView

According to technical analysis, the EUR/USD pair is experiencing an upward movement on Wednesday, pushing towards the upper band of the Bollinger Bands. Presently, the price is still near the upper bands of the Bollinger Bands, and the bands themselves indicate the potential for further upward movement.

This suggests that the price has the potential to reach the upper band of the Bollinger Bands. Additionally, the Relative Strength Index (RSI) is currently at 78, which is within the overbought area, indicating a bullish trend for the EUR/USD.

Resistance: 1.1185, 1.1271

Support: 1.1086, 1.0990

XAU/USD (4 Hours)

Gold (XAU/USD) Surges as Disappointing US Inflation Data Weighs on Dollar

XAU/USD experienced a strong rally, hitting an intraday high of $1,959.30 per troy ounce during the American session, as the US Dollar faltered due to lower-than-anticipated inflation figures. The Consumer Price Index (CPI) for June rose by a modest 0.2% month-on-month, falling short of the expected 0.3%, while the year-on-year CPI increase was 3%.

Additionally, the core annual reading came in at 4.8%, both below forecasts, indicating a continued easing of price pressures. This development bolstered risk appetite, leading to a surge in global stocks and further weakening of the US Dollar across foreign exchange markets.

The prospect of a potential shift in the Federal Reserve’s tightening cycle gained traction, suggesting a potential easing or conclusion of rate hikes, which could potentially mitigate the risk of a severe recession in the United States.

XAUUSD surges as disappointing US inflation data weighs on Dollar

Chart XAUUSD by TradingView

According to technical analysis, the XAU/USD pair underwent an upward movement on Wednesday, pushing towards the upper band of the Bollinger Bands. Currently, the price is close to the upper bands of the Bollinger Bands, and the bands themselves suggest the possibility of further upward movement.

This indicates the potential for the price to reach the upper band of the Bollinger Bands. Furthermore, the Relative Strength Index (RSI) is currently at 76, within the overbought area, indicating a bullish trend for the XAU/USD.

Resistance: $1,965, $1,981

Support: $1,946, $1,929

Economic Data
CurrencyDataTime (GMT + 8)Forecast
GBPGross Domestic Product m/m14:00-0.3%
USDUnemployment Claims20:30251K
USDProducer Price Index m/m20:300.2%
USDCore Producer Price Index m/m20:300.2%

Start trading now — click here to create your live VT Markets account.

七月期货合约展期通知 – 2023年07月12日

尊敬的用户:

您好!

VT Markets 平台的期货产品:VIX (恐慌指数) , CL-OIL (西德州原油期货) , FRA40ft (巴黎 CAC 40期貨) , UKOUSDft (布兰特原油期货) , HK50ft (港指期货) , CHINA50ft (新华富时 A50期货) 即将于以下时间展开新合约,如持仓过夜将会收取展期费用。

由于并非市场因素所造成的价格波动,若投资者的仓位于合约切换期间包含期货原油的未平仓头寸,将依据展期方向产生相应的费用扣补,以此反映新旧合约之间的价差。

请留意:

• 展期时,合约将自动切换,所有持仓中的订单将可继续持有。

• 展期日未平仓的订单将通过展期费进行调整,以反映到期合约和新合约之间的价格差异。

• 为避免差价合约展期,客户可以选择在展期日之前关闭任何未平仓的订单。

• 投资者应在展期前妥善控制仓位或调整相应的止盈止损设置。

• 同时,由于展期需做调整,在展期当天开盘前后半小时,我们会禁止所有同名账户内部转账。

如您有任何疑问,我们的团队将十分乐意为您解答。
请留言或发邮件至 [email protected] 或联系在线客服。

US Stocks Rise as Traders Await Inflation Data

U.S. stocks experienced a rebound on Tuesday, following a three-session decline, as investors eagerly awaited the release of crucial inflation data later in the week. The Dow Jones Industrial Average closed with a 0.93% gain, rising by 317.02 points to reach 34,261.42.

Similarly, the S&P 500 ended the day with a 0.67% increase at 4,439.26, while the Nasdaq Composite, focused on technology, gained 0.55% and closed at 13,760.70.

In related news, Salesforce’s stock soared by almost 4% after the company announced its plans to implement a price increase across all its offerings in August.

Furthermore, Activision Blizzard witnessed a 10% surge in its shares following a federal judge’s decision to deny the Federal Trade Commission’s request to halt Microsoft’s acquisition of the video game company. This ruling brought the two companies closer to finalizing their deal.

The upcoming release of the June consumer price index report on Wednesday and the June producer price index on Thursday is expected to provide insights into the trajectory of inflation and guide the future direction of interest rates.

Economists surveyed by Dow Jones project a 3.1% rise in the index on a year-over-year basis for last month. While investors anticipate another quarter-point increase at the Federal Reserve’s July meeting, uncertainty looms regarding the central bank’s actions in September, particularly after robust jobs data raised concerns about a potential resumption of rate hikes.

Looking ahead, the second-quarter earnings season is set to commence, with key reports expected from “systemically important financial institutions” such as JPMorgan Chase, Wells Fargo, and Citigroup, as well as BlackRock, PepsiCo, Delta Air, and UnitedHealth, a component of the Dow index, which will release its earnings on Friday.

All sectors performance showed a positive trend with a 0.67% increase.

Data by Bloomberg

On Tuesday, across all sectors, the stock market showed a positive trend with a 0.67% increase. The Energy sector performed exceptionally well, rising by 2.20%. Utilities and Industrials also experienced notable gains, with increases of 1.24% and 1.20% respectively.

Financials, Real Estate, and Communication Services sectors saw healthy gains of 1.19%, 1.17%, and 1.05% respectively. Materials and Consumer Discretionary sectors also contributed to the positive sentiment, with increases of 0.97% and 0.86% respectively.

However, the Information Technology and Consumer Staples sectors had more modest gains of 0.19% and 0.14% respectively. The Health Care sector remained relatively stable, showing no change at 0.00%.

Major Pair Movement

This downward trend comes ahead of the U.S. Consumer Price Index (CPI) report on Wednesday, with market sentiment remaining skeptical about the Federal Reserve’s ability to raise interest rates beyond one more hike, especially as other central banks are moving forward with their tightening cycles.

The upcoming inflation report will be closely watched to shape expectations regarding the Fed’s actions, which will have a significant impact on the value of the dollar. Forecasts indicate that the CPI is expected to decrease from 4.0% to 3.1%, mainly due to a favourable base effect that will turn unfavourable after July.

Additionally, on a monthly basis, a 0.3% increase is anticipated for both the CPI and core inflation, compared to 0.1% and 0.4% respectively in May. The year-on-year rate is projected to slide from 5.3% to 5.0%.

It’s worth noting that core inflation reached its peak last year in October, which will reduce the impact of the Fed-friendly base effect as we approach the end of the year. Regarding currency pairs, the EUR/USD remained stable after breaking above June’s peak and preparing for a pullback before the CPI release.

If the CPI results maintain the bund-Treasury yield spreads on the rebound, the next significant obstacle for the EUR/USD would be April’s 2023 peak at 1.1096. Market expectations currently include at least two additional 25bp European Central Bank (ECB) rate hikes before reaching a plateau, while the Federal Reserve rates are predicted to decrease by 1% between November and September of next year.

External factors like China’s actions and Brent crude oil prices reaching 10-week highs may influence growth, inflation, and currency movements. Furthermore, sterling experienced a substantial increase of 0.45%, reaching its highest level since April 2022 and approaching 76.4% of the dive observed in 2022-23 at 1.2941.

The market has priced in an additional 150bp of Bank of England (BoE) rate hikes by March. USD/JPY also saw a 0.6% increase following its recent decline, with expectations of a potential recovery in the coming months.

Picks of the Day Analysis
EUR/USD (4 Hours)

EUR/USD Gains Momentum Ahead of US Inflation Data

The EUR/USD pair rallied to a two-month high at 1.1027 before retracing slightly and finding support around 1.0980. Later, it regained strength above the 1.1000 level as the US Dollar weakened, while market participants eagerly awaited crucial US data.

Tuesday’s German ZEW survey revealed a decline in expectations and current conditions, aligning with a contraction in economic activity in the Eurozone. With the final German inflation numbers unchanged and an empty calendar for Wednesday, all eyes are now focused on the release of the US Consumer Price Index (CPI) for June.

Analysts anticipate a 0.3% monthly increase, a drop in the annual rate from 4% to 3.1%, and a decrease in the core index from 5.3% to 5%. The outcome of this data will likely impact market sentiment and potentially determine whether the EUR/USD pair can maintain its bullish bias or face downward pressure as attention shifts to the struggling Eurozone economy.

EUR/USD gains momentum ahead of US Inflation Data.

Chart EURUSD by TradingView

According to technical analysis, the EUR/USD pair experienced an upward movement on Tuesday, although it has not yet reached the upper band of the Bollinger Bands. Presently, the price is situated between the middle and upper bands of the Bollinger Bands, while the bands themselves are indicating a likelihood of further upward movement.

This suggests the potential for the price to reach the upper band of the Bollinger Bands. Additionally, the Relative Strength Index (RSI) currently stands at 69, further indicating a bullish trend for the EUR/USD.

Resistance: 1.1033, 1.1057

Support: 1.1002, 1.0965

XAU/USD (4 Hours)

Gold (XAU/USD) Prices Rise as Market Eyes US CPI Data Amidst Dollar Demand

Gold prices experienced an early advance on Tuesday, reaching a nearly month-long peak at $1,938.45. However, renewed demand for the US Dollar caused XAU/USD to trade in the $1,930 range during the American session.

The positive market sentiment, fueled by easing government bond yields and a favourable tone in equities during Asian trading, initially weakened the US Dollar. Nevertheless, the dollar rebounded despite this sentiment carrying over throughout the various sessions.

While Wall Street continues to extend its gains from Monday, financial markets remain cautious ahead of the release of the US Consumer Price Index (CPI). Analysts expect a 0.3% increase in inflation for June, compared to a modest 0.1% in May.

The annual figure is anticipated to be at 3.1%, down from the previous 4%, with the core annual reading predicted to decrease to 5% from 5.3% in the previous month. These CPI figures hold significance as they could provide insights into the future monetary policy decisions of the Federal Reserve (Fed).

Higher-than-expected inflation readings may prolong the central bank’s tightening measures, potentially strengthening the US Dollar across the board as investors seek safe-haven assets.

XAUUSD prices as market eyes US CPI Data amidst dollar demand.

Chart XAUUSD by TradingView

According to technical analysis, the XAU/USD pair is moving higher on Tuesday, creating upward momentum towards the upper band of the Bollinger Bands. Currently, the price is slightly below the upper band, suggesting the possibility of further upward movement today that could potentially breach the upper band. The Relative Strength Index (RSI) is currently at 69, indicating a potential bullish movement for XAU/USD.

Resistance: $1,946, $1,954

Support: $1,929, $1,920

Economic Data
CurrencyDataTime (GMT + 8)Forecast
NZDOfficial Cash Rate10:005.50% (Actual)
USDConsumer Price Index y/y20:303.1%
USDConsumer Price Index m/m20:300.3%
USDCore CPI20:300.3%
CADOvernight Rate23:005.00%

Wall Street Rebounds as Dow Rises and Investors Await Inflation Data and Earnings Season Kickoff

The Dow Jones Industrial Average rebounded on Monday, recovering from a previous week of losses. Investors were optimistic ahead of upcoming inflation data and the start of the second-quarter earnings season.

The Dow rose by 0.62%, adding 209.52 points, while the S&P 500 increased by 0.24%, and the Nasdaq Composite saw a gain of 0.18%. This positive momentum ended a three-day losing streak for the major averages.

The consumer price index report is scheduled for Wednesday, followed by the producer price index on Thursday, which will provide further insights into inflation and wholesale price pressures.

Last week, the S&P 500, Nasdaq Composite, and Dow experienced declines of 1.16%, 0.92%, and 1.96%, respectively. Despite weaker-than-expected nonfarm payrolls in June, concerns over potential Federal Reserve rate hikes were raised due to slightly stronger-than-anticipated wage growth.

However, investors will be closely watching the quarterly reports of finance giants BlackRock, JPMorgan Chase, Wells Fargo, and Citigroup, which will mark the beginning of the second-quarter earnings season.

All sector performances had an overall increase of 0.24%.

Data by Bloomberg

On Monday, all sectors in the market saw a modest overall increase of 0.24%. The Industrials sector performed the best, gaining 1.39%, followed by Health Care with a rise of 0.81% and Energy with a gain of 0.76%. Financials also had a positive day, increasing by 0.44%, while Real Estate and Consumer Discretionary sectors experienced smaller gains of 0.35% and 0.11% respectively.

Consumer Staples had a minimal increase of 0.03%. On the other hand, Materials and Information Technology sectors had slight declines of -0.01% and -0.02% respectively. Utilities and Communication services sectors performed the worst, with declines of -0.42% and -0.92% respectively.

Major Pair Movement

The dollar index experienced a decline of 0.29% as last week’s disappointing payrolls report continued to put pressure on Treasury yields, potentially leading to a further decrease in the U.S. currency. While Japanese Government Bond (JGB) and bund yields rose, Treasury yields fell, contributing to the downward trend.

Market sentiment was influenced by Fed speakers’ comments and a New York Fed survey indicating a decrease in household inflation expectations. The upcoming U.S. CPI report on Wednesday is highly anticipated, with the possibility that even a minor shortfall could result in a core inflation rate below 5%, which could support dovish views.

EUR/USD saw a gain of 0.26%, reaching its highest level since June, supported by a surge in the 2-year bund-Treasury yield spreads. Despite concerns about the eurozone investor mood and deflationary data from China, which could have negative implications for German businesses, the euro remained strong.

USD/JPY declined by 0.63% due to falling Treasury yields, with 10-year JGB yields approaching the Bank of Japan’s 50 basis points cap. The pair broke below key support levels, leaving speculators who were net long in a precarious position.

Sterling initially faced losses but eventually surpassed previous peaks, reaching its highest level since April 2022. Bank of England Governor Andrew Bailey emphasized the importance of combating UK inflation, which currently stands as the highest among the G7 countries.

AUD/USD and USD/CNH experienced minor declines of 0.2% and 0.02% respectively.

Picks of the Day Analysis
EUR/USD (4 Hours)

Weaker US Dollar Boosts EUR/USD as Market Awaits US Inflation Data

The EUR/USD pair continued its upward climb, propelled by a weaker US Dollar and positive momentum. The focus now turns to upcoming US inflation data, which is expected to shape the next direction for the pair. The US Dollar Index (DXY) fell to a three-week low, vulnerable to further losses due to declining inflation expectations and lower bond yields.

Additionally, the positive performance of Wall Street stocks exerted pressure on the US Dollar. Meanwhile, Eurozone data revealed a decline in the Sentix survey, suggesting weak GDP growth in the region.

Weaker US Dollar Boosts EUR/USD as Market Awaits US Inflation Data.

Chart EURUSD by TradingView

According to technical analysis, the EUR/USD pair moved higher on Monday and created a push to the upper band of the Bollinger Bands. Currently, the price is moving just below the upper band with still wider bands, indicating a potential for further upside towards the upper band of the Bollinger Bands. The Relative Strength Index (RSI) is currently at 69, suggesting a bullish trend is in for the EUR/USD.

Resistance: 1.1033, 1.1057

Support: 1.1002, 1.0965

XAU/USD (4 Hours)

Spot Gold (XAU/USD) Prices Slide Amid Market Mood Swings and US Inflation Expectations

Gold prices experienced a downward trend, briefly reaching a low of $1,912.66 during London trading hours but recovering some losses following the opening of Wall Street. The initial strength of the US Dollar was fueled by concerns over China-US tensions and their impact on global growth.

However, a more positive sentiment during American trading hours led to a weaker USD as US stock indexes rebounded. With limited action in equities due to the absence of significant data, XAU/USD remained largely unchanged for the day.

The market focus remains on central banks’ monetary policies, particularly the potential extension of tightening measures, driven by policymakers’ concerns about persistent inflation. The upcoming release of the June Consumer Price Index (CPI) in the United States is expected to provide fresh insights into the Federal Reserve’s future actions, making it a significant event for financial markets.

Gold (XAU/USD) Prices Slide Amid Market Mood Swings and US Inflation Expectations

Chart XAUUSD by TradingView

According to technical analysis, the XAU/USD pair is moving flat on Monday, between the middle band and the upper band of the Bollinger Bands. Currently, the price is moving in a flat movement, suggesting that there’s a possibility that the price will move in a tight consolidation. The Relative Strength Index (RSI) is currently at 56, indicating a neutral stance for XAU/USD with a slight potential bullish movement.

Resistance: $1,932, $1,946

Support: $1,920, $1,909

Economic Data
CurrencyDataTime (GMT + 8)Forecast
GBPClaimant Count Change14:0020.5K

Week Ahead: All Eyes on Central Banks Rate Decisions, and US CPI and PPI

Upcoming key focuses will be on the Central Banks Rate Decisions, US CPI and PPI.

The financial world is poised for some key events this week with the potential to shake up markets. Top of the agenda is the upcoming decisions from various central banks on their interest rates.

Alongside this, the focus will be on the US as it releases its latest Consumer Price Index (CPI) and Producer Price Index (PPI). These important data points could provide crucial insights into the current economic climate.

Stay tuned as we delve into what the coming week holds in store. 

Reserve Bank of New Zealand Rate Statement (12 July 2023)

The Reserve Bank of New Zealand raised its official cash rate by 25bps to 5.5% during its May meeting, marking the highest level since December 2008. This was the 12th consecutive rate hike.

Analysts predict that at the upcoming meeting on July 12, the RBNZ will keep its interest rates steady at 5.5%. 

US Consumer Price Index (12 July 2023)

Consumer prices in the US saw a slight rise of 0.1% in May 2023, a slowdown from the 0.4% increase witnessed in the previous month. 

Analysts anticipate a 0.2% rise for June 2023 data, scheduled for release on 12 July. 

Bank of Canada Rate Statement (12 July 2023) 

The Bank of Canada unexpectedly raised the target for its overnight rate by 25bps to 4.75% in June 2023, after pausing the tightening campaign in the previous two meetings. 

The next rate statement will be released on 12 July 2023, with analysts anticipating another increase of 25bps to 5%.

UK Gross Domestic Product (13 July 2023)

The British economy expanded 0.2% month-over-month in April 2023, rebounding from a 0.3% drop in the previous month. 

For May data, set to be released on 13 July, the country’s GDP is expected to be steady at 0.0%. 

US Producer Price Index (13 July 2023)

Producer prices for final demand in the US decreased 0.3% month-over-month in May 2023, following a 0.2% rise in April. 

For June 2023 data, set to be released on 13 July, analysts expect a 0.2% increase.

Prelim University of Michigan Consumer Sentiment (14 July 2023)

The University of Michigan’s consumer sentiment for the US was adjusted upwards to 64.4 in June 2023, its highest level in four months, up from an initial reading of 63.9. 

For July preliminary data, analysts expect a reading of 64.5.

Follow VT Markets for more Market Analysis

Back To Top
server

您好 👋

我能帮您什么吗?

立即与我们的团队聊天

在线客服

通过以下方式开始对话...

  • Telegram
    hold 维护中
  • 即将推出...

您好 👋

我能帮您什么吗?

telegram

用手机扫描二维码即可开始与我们聊天,或 点击这里.

没有安装 Telegram 应用或桌面版?请使用 Web Telegram .

QR code