Dow Jones Extends Winning Streak Amid Earnings Reports and Fed Speculations

The Dow Jones Industrial Average achieved its longest winning streak in over six years as it closed higher on Tuesday. The index rose by 0.08%, or 26.83 points, reaching 35,438.07. This marked the 12th consecutive positive session for the 30-stock index, the longest rally since February 2017. Meanwhile, the S&P 500 climbed 0.28%, and the Nasdaq Composite advanced 0.61%. Traders closely examined the latest earnings reports, with General Motors seeing a 3.5% decline despite raising its full-year earnings guidance, while General Electric surged nearly 6.3% due to stronger-than-expected second-quarter revenue.

Investors eagerly awaited the Federal Reserve’s policy decision, expecting a quarter percentage point rate increase. However, uncertainties lingered about future actions as the market sought clarity on the Fed’s stance towards inflation and its economic outlook. Amidst this backdrop, Wall Street analyzed results from major tech companies, including Alphabet and Microsoft, which were set to report after the market’s close. As earnings season progressed, around 79% of S&P 500 companies surpassed analyst expectations for the second quarter, offering optimism for the overall market performance.

Data by Bloomberg

On Tuesday, most sectors experienced modest gains, with all sectors combined showing a positive change of +0.28%. The Materials sector had the highest increase at +1.76%, followed by Information Technology at +1.19%, and Energy at +0.57%. Communication Services also saw a slight uptick of +0.42%, while Utilities and Commercial & Professional Services had more marginal gains of +0.22% and +0.42% respectively.

On the other hand, several sectors faced declines. Financials had the most significant drop, with a decrease of -0.73%, closely followed by Real Estate at -0.74%. Transportation experienced a notable decline of -0.63%, while Consumer Discretionary and Industrials both saw moderate decreases of -0.23% and -0.13% respectively. Health Care and Consumer Staples also ended the day in the red, but with marginal changes of -0.06% and -0.05% respectively.

Major Pair Movement

The dollar index slipped 0.07% as risk-on sentiment increased, reducing demand for the U.S. currency. Weak economic data weighed on the euro ahead of the Federal Reserve and European Central Bank (ECB) meetings. Sterling rose 0.4% with important supports preventing further decline. The prospect of ECB rate hikes diminished due to lackluster euro zone data in July, leading to a slide in EUR/USD.

EUR/USD fell 0.24%, marking its fifth consecutive daily loss to its lowest level since July 12, triggered by below-forecast U.S. CPI data. Dovish comments from ECB officials added to concerns about a potential rate hike beyond the expected 25bp increase this week. USD/JPY also declined 0.2% amid a broader risk-on sentiment and ahead of the Fed meeting. However, strong services data and rising Treasury yields provided some support.

Market expectations for a 25bp Fed rate hike were steady, but there were doubts about additional rate increases in the future. Speculation about increasing the pace of quantitative tightening instead of raising rates multiple times emerged. The BoJ meeting was anticipated to maintain unchanged policies, but some trimming of yen shorts was possible if there were any surprises.

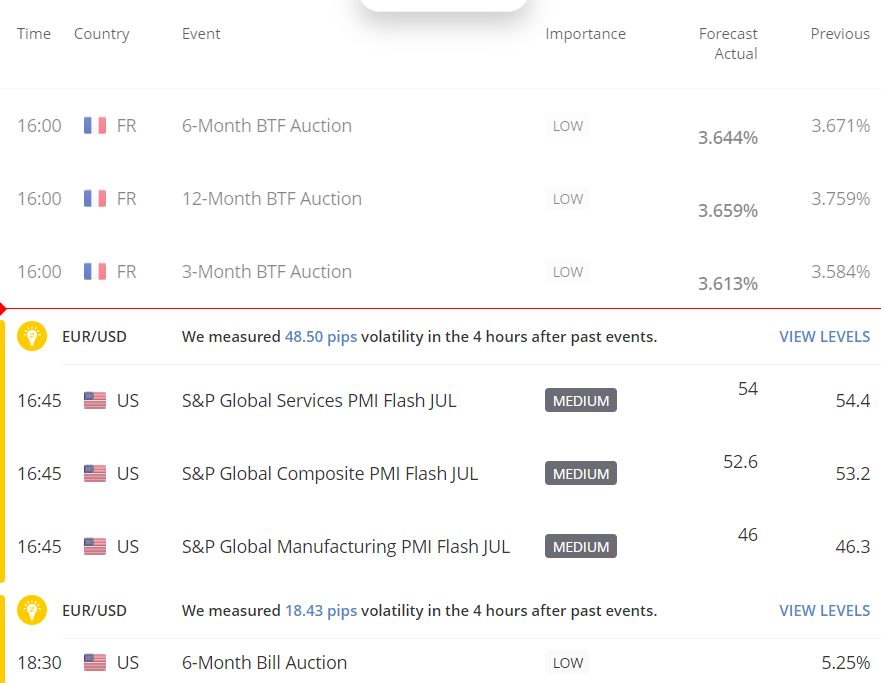
Traders remained cautious due to significant upcoming U.S. data releases, including GDP, jobless claims, personal income, spending, core PCE, employment costs, and Michigan sentiment. Additionally, market participants kept an eye on earnings reports from major U.S. tech companies and beyond.

Picks of the Day Analysis

EUR/USD (4 Hours)

EUR/USD Continues Decline Amid Weaker Euro and Central Bank Decisions

The EUR/USD pair experienced its fifth consecutive day of losses as the Euro weakened ahead of central bank decisions. The European Central Bank (ECB) survey revealed a significant drop in loan demand from companies, indicating a deteriorating economic outlook. The German July IFO survey also disappointed expectations. While a 25-basis point rate hike from the ECB is anticipated, the future interest rate trajectory remains uncertain. The focus now shifts to the upcoming FOMC meeting, where the Federal Reserve’s rate decision and messaging will be critical for the EUR/USD direction, with potential for increased volatility in the market.

Chart EURUSD by TradingView

According to technical analysis, the EUR/USD pair is experiencing a downward movement on Tuesday, leading to a push towards the lower band of the Bollinger Bands. This movement has also resulted in a wider gap between the bands. The Relative Strength Index (RSI) currently stands at 29, indicating that there is potential for further downward movement in the EUR/USD pair.

Resistance: 1.1121, 1.1208

Support: 1.1022, 1.0950

XAU/USD (4 Hours)

XAU/USD Prices Up as US Dollar Surges Amidst Fragile Economic Balance

Gold prices have risen despite XAU/USD reaching a one-week low, as the US Dollar strengthened due to a bleak economic outlook. The upcoming monetary policy announcements by the US Federal Reserve and the European Central Bank are awaited with caution, with expectations of a rate hike. Traders are also keeping an eye on macroeconomic figures, including Q2 Gross Domestic Product and inflation updates for the US and Germany, to determine the direction of the FX board in the coming weeks.

Chart XAUUSD by TradingView

According to technical analysis, the XAU/USD pair initially experienced a slight decline on Monday. However, it subsequently rebounded and reached the middle band of the Bollinger Bands. At present, the price is slightly above the middle band. Furthermore, the Relative Strength Index (RSI) currently stands at 51, indicating that the XAU/USD pair is still in a neutral position.

Resistance: $1,971, $1,992

Support: $1,954, $1,941

Economic Data

CurrencyDataTime (GMT + 8)Forecast
AUDConsumer Price Index q/q09:301.0%
AUDConsumer Price Index y/y09:305.4%
USDFOMC Statement02:00 (27th) 
USDFederal Funds Rate02:00 (27th)5.50%
USDFOMC Press Conference02:30 (27th) 

Dow Jones Extends Winning Streak Amid Key Earnings Reports and Federal Reserve Policy Decision

The Dow Jones Industrial Average continued its impressive winning streak, marking the longest rally since February 2017, with an 11th consecutive day of gains. The 30-stock Dow rose 0.52%, reaching 35,411.24 points, supported by a 0.40% rise in the S&P 500 and a 0.19% gain in the Nasdaq Composite. Energy stocks led the upward trend, particularly with a 1.7% surge in the S&P 500’s energy sector following positive oil and gasoline futures. Notably, Chevron’s nearly 2% increase came after the company reported better-than-expected preliminary second-quarter earnings. However, market participants remain cautious as the upcoming week includes significant earnings reports from approximately 150 S&P 500 companies and the Federal Reserve’s policy decision. Traders are eager to gauge Chair Jerome Powell’s remarks to understand the central bank’s approach to the economy’s soft landing and the potential quarter-percentage-point rate increase anticipated at the meeting’s conclusion on Wednesday.

Investors are closely monitoring the potential impact of the earnings reports and the Fed’s policy decision on the recent bullish run. The upcoming week is marked by substantial earnings releases from major companies, including Alphabet, Microsoft, and Meta, as well as industrial firms and big oil. Furthermore, traders are eagerly awaiting the release of the personal consumption expenditures index, the Fed’s preferred inflation gauge, at the end of the week. As these critical events unfold, Wall Street remains on the lookout for any signs of market volatility and potential shifts in economic sentiment.

Data by Bloomberg

On Monday, the overall market showed positive performance, with all sectors gaining 0.40%. The energy sector led the way with a notable increase of 1.66%, followed closely by financials and real estate, which rose by 1.01% and 1.00%, respectively. Consumer discretionary stocks also performed well, posting a gain of 0.52%. Communication services and consumer staples sectors saw modest growth with increases of 0.46% and 0.38%, respectively. Materials and information technology sectors showed moderate gains of 0.31% and 0.26%. However, the health care sector experienced a slight decline of 0.23%, while utilities had a marginal decrease of 0.28% on Monday.

Major Pair Movement

The dollar index strengthened by 0.26% as both the euro and sterling faced losses due to disappointing flash euro zone and UK PMI data. This rise in the dollar index was partially offset by a 0.25% drop in USD/JPY, which followed steady Japan PMI figures. Market participants were closely monitoring the upcoming meetings of major central banks, including the Federal Reserve, the European Central Bank (ECB), and the Bank of Japan (BoJ), all scheduled later in the week.

The dollar’s resilience was supported by a rebound in Treasury yields, which had initially fallen in response to lower European yields and mixed U.S. PMI data. However, the retreat in yields was short-lived, bolstered by increased corporate supply and expectations surrounding this week’s 2, 5, and 7-year Treasury auctions. The future direction of Treasury yields and the dollar hinges largely on the statements issued by the Federal Reserve after the expected 25 basis point rate hike on Wednesday. Market sentiment remains uncertain, given broader indications of a cooling U.S. economy and lower inflation, which may potentially favor rate cuts in the coming year.

During this period of central bank activity, investors were also closely monitoring the impact of Russian attacks on Ukraine ports, which contributed to a surge in wheat prices, and the ongoing recovery in fuel prices. Additionally, traders kept a keen eye on other crucial economic indicators such as German Ifo data and U.S. consumer confidence. The ECB is expected to implement a 25 basis point rate hike on Wednesday, with further increases largely priced in by year-end. Consequently, the euro experienced a decline of 0.49%, while sterling also faced a 0.23% drop, as the Bank of England (BoE) is likely to pursue a 25 basis point rate hike in August, followed by additional hikes to tackle higher inflation in the UK. USD/JPY experienced fluctuations in line with Treasury yields, fueled by lingering hopes that the BoJ would raise its JGB yield cap on Friday. Moreover, Japanese government efforts to limit yen depreciation, which contribute to cost-push inflation rather than demand-pull inflation, also influenced the currency pair’s movements.

Picks of the Day Analysis

EUR/USD (4 Hours)

EUR/USD Extends Decline as Eurozone PMIs Miss Expectations Ahead of Central Bank Meetings

The EUR/USD currency pair continued its downward trajectory, marking its fifth consecutive day of losses and reaching its lowest daily close since July 12. The euro’s correction lower follows its earlier peak at around 1.1300, which was the highest level in over a year. Economic data from the Eurozone, particularly the disappointing Manufacturing PMI at 42.7 and Services PMI at 51.1 in June, along with a Composite Index of 48.9, the lowest since November, raised concerns about the region’s economic strength and potential recession risks. Despite this backdrop of economic weakness, the European Central Bank (ECB) is still anticipated to implement a 25 basis point interest rate hike on Thursday, with the market closely watching the bank’s messaging for further cues.

As market participants positioned themselves for the Federal Reserve’s decision, US Treasury yields experienced a slight increase. The Fed is expected to raise its key rate by 25 basis points on Wednesday, making the central bank’s statements crucial for the direction of the US Dollar and financial markets overall. The US PMI data showed mixed results, with the Services PMI falling to 52.4 in July, below the expected 54, while the Manufacturing PMI rebounded to 49, exceeding the market consensus of 46.4. Amidst these developments, the DXY (Dollar Index) continued to rise, exerting downward pressure on the EUR/USD pair. Though some stabilization may occur prior to the Fed meeting, increased volatility is expected in the coming sessions. Key events to monitor include the German IFO survey and US housing data on Tuesday.

Chart EURUSD by TradingView

According to technical analysis, the EUR/USD pair is moving lower on Monday creating a push to the lower band of the Bollinger Band and creating a wider gap between the bands. The Relative Strength Index (RSI) is currently at 31, suggesting that the EUR/USD pair has the potential of moving lower.

Resistance: 1.1121, 1.1208

Support: 1.1022, 1.0950

XAU/USD (4 Hours)

XAU/USD Under Mild Pressure as US Dollar Gains Favor Amid Encouraging Data

Gold started the week facing mild pressure and remained at the lower end of the previous week’s range, with XAU/USD trading below $1,960 per troy ounce. The US Dollar saw some market favor after mixed yet encouraging data from the United States. S&P Global’s preliminary estimates of the July Purchasing Managers’ Index (PMI) showed a higher-than-expected increase in the Manufacturing PMI, reaching 49, its highest level in three months. However, the Services PMI, though still in expansionary territory, slowed to 52.4 from the previous 54.4. Despite this, US companies indicated continued business activity growth in July, with the service sector leading the expansion. Wall Street remained resilient, disregarding negative cues from international markets, as investors focused on upcoming earnings reports and significant events, including decisions on monetary policy from the US Federal Reserve and the European Central Bank. Furthermore, crucial economic indicators such as the preliminary Q2 Gross Domestic Product (GDP) estimate and the June Personal Consumption Expenditures (PCE) Price Index were also anticipated.

Chart XAUUSD by TradingView

According to technical analysis, the XAU/USD pair moved lower on Monday but then managed to move back higher and try to reach the middle band of the Bollinger Bands. Currently, the price is slightly below the middle band. Additionally, the Relative Strength Index (RSI) is at 48, suggesting that the XAU/USD pair has returned to a neutral stance.

Resistance: $1,971, $1,992

Support: $1,954, $1,941

Economic Data

CurrencyDataTime (GMT + 8)Forecast
USDCB Consumer Confidence22:00112.1

A Comprehensive Guide to Fundamental Analysis in Forex Trading

Let’s say you are a Forex trader who is interested in trading the EUR/USD currency pair. You know that the European Central Bank (ECB) is scheduled to announce its interest rate decision tomorrow. The ECB’s interest rate decision is a major event that can have a significant impact on the value of the euro. 

Using fundamental analysis, you can assess the potential impact of the ECB’s interest rate decision on the EUR/USD currency pair. If you believe that the ECB is likely to raise interest rates, you might expect the euro to appreciate in value. Conversely, if you believe that the ECB is likely to keep interest rates unchanged, you might expect the euro to depreciate in value. 

By understanding the potential impact of the ECB’s interest rate decision, you can make a more informed decision about whether to buy or sell the EUR/USD currency pair. This is fundamental analysis use example. 

Understanding Fundamental Analysis in Forex Trading 

Fundamental analysis is a method used by Forex traders to understand the true value of a currency pair based on economic, financial, and geopolitical factors. By understanding these factors, traders can make more informed decisions about when to buy or sell currencies and other assets. 

Fundamental analysis is based on the idea that the price of a currency is ultimately determined by its underlying value. This value is influenced by a variety of factors, including: 

Economic indicators 

  • GDP growth: GDP growth is a measure of the overall size of an economy. A strong GDP growth rate is typically seen as a positive sign for a country’s currency, as it suggests that the economy is growing and becoming more prosperous. 
  • Employment data: Employment data measures the number of people who are employed in a country. A strong employment report can be a positive sign for a country’s currency, as it suggests that the economy is creating jobs and people are spending money. 
  • Inflation rates: Inflation is a measure of the rate at which prices are rising in a country. A high inflation rate can be a negative sign for a country’s currency, as it suggests that the value of the currency is decreasing. 

Central bank policies 

  • Interest rates: Interest rates are the rates at which banks lend money to each other. When interest rates are raised, it makes it more expensive for businesses to borrow money, which can slow down economic growth. This can lead to a depreciation in the value of the currency. 
  • Monetary policy: Monetary policy is the set of tools that central banks use to manage the money supply and interest rates in an economy. A central bank’s monetary policy can have a significant impact on the value of a currency. 
source: Los Angeles Times

Geopolitical events 

  • Elections: Elections can have a significant impact on the value of a currency. If a new government is elected that is seen as being more favourable to business, the value of the currency may appreciate. Conversely, if a new government is elected that is seen as being less favourable to business, the value of the currency may depreciate. 
  • Wars: Wars can have a significant impact on the value of a currency. If a war breaks out in a country, the value of the currency may depreciate as investors lose confidence in the country’s economy. 
  • Natural disasters: Natural disasters can also have a significant impact on the value of a currency. If a natural disaster strikes a country, the value of the currency may depreciate as investors lose confidence in the country’s economy. 

Market sentiment 

The overall mood of traders towards a currency pair can also have a significant impact on its value. If traders are bullish on a currency pair, they are more likely to buy it, which can drive up its value. Conversely, if traders are bearish on a currency pair, they are more likely to sell it, which can drive down its value. 

For example, a positive economic report, such as better-than-expected employment data, can boost investor confidence in a country’s economy, leading to increased demand for its currency. 

How to Use Fundamental Analysis 

Fundamental analysis can be used to inform both short-term and long-term trading decisions. However, it is more commonly used for long-term trading, as it takes time for fundamental factors to have a significant impact on currency prices. 

To use fundamental analysis, traders need to track economic data releases, central bank announcements, and other geopolitical events that could impact currency values. They can then use this information to assess the underlying value of a currency pair and make trading decisions accordingly. 

For example, if a country’s GDP growth is strong, it is likely that its currency will appreciate in value. This is because a strong economy is seen as being more stable and attractive to investors. Conversely, if a country’s GDP growth is weak, its currency is likely to depreciate in value. 

The Economic Calendar 

One of the most important tools for fundamental analysis is the economic calendar. This is a schedule of upcoming economic events and news releases that could impact currency pairs. The economic calendar is a valuable tool for traders because it allows them to stay informed about upcoming events and make informed trading decisions. 

The economic calendar typically includes information about the following: 

  • The date and time of the event 
  • The name of the event 
  • The country where the event is taking place 
  • The impact of the event on currency markets 

VT Markets offers a user-friendly Economic calendar that is accessible to beginners. The calendar is easy to navigate and provides clear information about upcoming economic events. It also includes an “importance” rating, which helps traders gauge the potential effect of an event on the market. 

Additionally, you can use a Daily market analysis by VT Markets that can be a valuable tool for fundamental analysis. The Daily market analysis provides an overview of the key economic events and geopolitical developments that could impact currency values. It also includes a technical analysis section that provides insights into the short-term trends in currency prices. 

Tips for using Fundamental Analysis in Forex trading: 

  • Start by learning about the basics of economic analysis. This includes understanding key economic indicators, central bank policies, and geopolitical events. 
  • Use a reliable economic calendar to stay informed about upcoming events. This will help you identify potential trading opportunities and avoid making uninformed decisions. 
  • Combine fundamental analysis with technical analysis to make more informed trading decisions. Technical analysis can help you identify trends and patterns in currency prices, while fundamental analysis can help you understand the underlying reasons for these trends. 
  • Don’t be afraid to experiment with different trading strategies. There is no one-size-fits-all approach to fundamental analysis, so it’s important to find a strategy that works for you. VT Markets provides a Demo account for risk-free strategy testing. 
  • Most importantly, be patient and persistent. It takes time and effort to master fundamental analysis, but it can be a valuable tool for successful Forex trading. 

Pros & Cons of Fundamental Analysis 

Pros: 

  • Fundamental analysis can help you understand the underlying factors that influence currency values. 
  • This can help you make more informed trading decisions. 
  • Fundamental analysis can be used to identify potential trading opportunities. 
  • It can also help you avoid making uninformed decisions. 

Cons: 

  • Fundamental analysis can be time-consuming and complex. 
  • It can be difficult to predict the future, even with a good understanding of fundamental factors. 
  • Fundamental analysis is not the only factor that influences currency prices. 
  • Other factors, such as technical analysis and market sentiment, can also play a role. 

In conclusion, fundamental analysis is a valuable tool for Forex traders who want to make informed trading decisions. However, it is important to remember that fundamental analysis is not the only factor that influences currency prices. By combining fundamental analysis with other trading tools, you can make more informed and confident trading decisions. 

Summary: 
  • Fundamental analysis is a method used by Forex traders to understand the true value of a currency pair based on economic, financial, and geopolitical factors. 
  • Economic indicators, central bank policies, geopolitical events, and market sentiment are key factors influencing currency values. 
  • Beginners are advised to combine fundamental analysis with technical analysis for comprehensive decision-making. 

How to trade indices? 

Transport yourself back to the remarkable year of 1896, a time characterised by industrial revolution and transformative economic changes. Amid the bustling streets of New York City, the brilliant mind of Charles Dow sparked an idea that would send ripples through the financial world. 

With a mere selection of 12 carefully chosen companies, he crafted what we know today as the Dow Jones Industrial Average (DJIA) – a beacon of brilliance among stock indices. 

Fast-forward to the present day, and these luminous indicators continue to captivate investors and economists alike. They offer a unique glimpse into a country’s economic performance, providing invaluable insights into the ever-changing global financial landscape. 

If you’re interested in understanding how indices trading works, what these indices represent, and how to analyse their price movements, continue reading to explore our detailed guide. 

Understanding Indices 

Indices are numerical representations of the top-performing shares from a particular stock exchange. They provide a snapshot of the exchange’s major players by averaging individual stock movements, consolidating a vast amount of financial activity into a single figure. 

Some of the largest indices in the world are: 

  • Dow Jones (in the US) 
  • Nasdaq (US) 
  • S&P 500 (US) 
  • DAX 40 (in Germany) 
  • CAC (in France) 
  • FTSE (in the UK) 
  • Hang Seng (in Hong Kong) 
  • Nikkei (in Japan) 
  • ASX (in Australia) 

Stock indices can be calculated using two distinct approaches: one involves considering the performance of the largest companies, known as a market capitalisation-weighted average. This method is employed for indices like the S&P 500, FTSE, and ASX, where the movements of high-value companies carry greater influence over the overall index. 

While the majority of stock indices adopt this approach, there are exceptions, and some indices are calculated using a price-weighted average. The Dow Jones and Nikkei are prime examples of indices using this method, where shares with higher prices wield more significant sway. 

Since indices represent the overall stock value of multiple top-performing companies or high-value stocks, they tend to be more volatile compared to individual company stocks, providing both trading opportunities and increased risk for traders. 

What is Index Trading? 

Since indices are just numbers representing the performance of a group of shares on an exchange, they cannot be directly bought or sold. 

Instead, traders need to choose products that mirror their performance, such as: 

  • Index funds
  • Exchange-traded funds (ETFs)
  • Futures
  • Options
  • Contracts for differences (CFDs). 

These products track the underlying index’s price, allowing traders to speculate on whether the index’s price will rise or fall and take positions accordingly. 

Image shows index drops amid the covid-19 outbreak
U.S stock indexes drops since 31/12/2019 (as %)
source: howmuch.net

Factors Influencing Index Prices 

Various factors can cause index prices to rise or fall, and understanding these factors is essential for trading indices effectively. These factors include: 

  • General economic news: As indices summarise multiple companies’ stock performances, they serve as indicators of an economy’s health and are influenced by economic news. 
  • Global news: Multinational corporations within local indices are affected by global events, such as pandemics, natural disasters, commodity price fluctuations, supply chain disruptions, and global economic turmoil. 
  • Company financial results: Individual companies’ performance within an index affects the overall index, especially for highly valued companies with significant stock price movements. 
  • Company announcements: Changes in company leadership, mergers, manufacturing updates, and other announcements have broader implications for individual stock prices and the index price. 
  • Index composition changes: Adding or removing companies from an index can impact its overall price and requires traders to reevaluate their positions. 

How to Trade Indices 

When trading stock indices, thorough research, a good understanding of the chosen product, and proper risk management strategies are crucial. Index CFDs are among the most popular trading products. They allow traders to profit from both rising and falling index prices by predicting the price direction accurately. 

Traders can approach index CFDs in two ways: going long or going short. Going long involves buying index trading products when expecting the price to rise, while going short involves selling or closing positions when expecting a price decline. Profit or loss depends on the accuracy of the prediction and the market’s overall movement. 

CFD trading involves leverage, allowing traders to open positions with a small initial deposit (margin) that represents a percentage of the total asset value. While leverage provides exposure to larger markets with less capital, it also carries the risk of incurring losses greater than the initial deposit. Traders should choose suitable strategies for their portfolios when trading CFDs. 

Tips on Successful Trading Indices 

  • Do your research: Before you start trading, it is important to do your research and understand the risks involved. Read books and articles about index trading and watch educational videos. This will help you understand how the market works and how to make informed trading decisions. 
  • Start small: Don’t start trading with a large amount of money. Start with a small amount and gradually increase your investment as you gain experience. This will help you minimise your losses if you make any mistakes. 
  • Use a demo account: VT Markets offers a Demo account [internal link: https://www.vtmarkets.com/get-trading/open-demo-account/] that allow you to trade with virtual money. This is a great way to learn the basics of trading without risking any real money. Once you feel comfortable with the process, you can start trading with real money. 
  • Be patient: Trading indices can be a volatile market, so it is important to be patient and not expect to get rich quick. It takes time and experience to become a successful trader. 
  • Use stop-loss orders: Stop-loss orders are a way to limit your losses. If the price of an index falls below a certain level, your trade will be automatically sold, preventing you from losing more money than you are comfortable with. 
  • Use take-profit orders: Take-profit orders are a way to lock in your profits. If the price of an index rises above a certain level, your trade will be automatically sold, ensuring that you don’t miss out on potential profits. 
  • Don’t trade emotionally: It is important to stay calm and make rational decisions when trading indices. Don’t let your emotions get the best of you, or you will likely make bad trading decisions. 

Starting Index Trading 

To begin trading indices in live markets, follow these steps: 

  • Select your preferred trading method: VT Markets offers indices CFDs, providing opportunities to profit from rising and falling prices. 
  • Choose between cash indices and index futures: Cash indices have tighter spreads and offer on-the-spot trade pricing, suitable for day traders. Index futures are preferred for longer-term views with fewer overnight funding charges. 
  • Create and log in to your trading account: Opening a live account [internal link: https://www.vtmarkets.com/get-trading/forex-trading-account/] with VT Markets is quick and easy. 
  • Choose the index to trade: Select from popular global indices [internal link: https://www.vtmarkets.com/trading/markets/indices/] based on available analysis and market insights. 
  • Decide to go long or short: Choose the direction based on the outlook for the economic sector or domestic market. 
  • Implement risk management strategies: Utilise stop-loss and limit orders to prevent excessive losses. 
  • Open your first position: Seize opportunities by monitoring and closing positions at the right time. 

In conclusion, trading stock indices offers a window into the performance of major companies and economies worldwide. Understanding the factors influencing index prices and utilising products like index CFDs can provide traders with both opportunities and risks. 

With proper research, risk management, and the support of a reliable broker like VT Markets, traders can confidently navigate the exciting world of index trading, diversify their portfolios, and hedge against market fluctuations. Happy trading! 

Summary: 
  • Stock indices represent the overall performance of top-performing shares from specific stock exchanges, providing a snapshot of the economy’s health. 
  • Indices can be calculated using market capitalisation-weighted or price-weighted averages, affecting their volatility and risk levels. 
  • Traders can’t directly buy or sell indices but can trade products like index funds, ETFs, futures, options, and CFDs, mirroring index performance. 
  • Several factors influence index prices, including economic news, global events, company financial results, announcements, and changes in index composition. 
  • Index CFDs are popular trading products that allow traders to profit from both rising and falling index prices with leverage. 
  • Proper research, risk management, and selecting the right trading strategy are crucial for successful index trading. 

Week Ahead: All Eyes on FOMC Meeting Minutes and ECB, BOJ Rate Decisions

The graph displays stocks with an uptrend represented in green, indicating bullish markets.

This week’s economic calendar includes important events that can significantly impact the markets: the FOMC Meeting Minutes, as well as the ECB and BOJ Rate Decisions. Traders should be well-prepared for potential market volatility resulting from these announcements and be ready to adjust their strategies accordingly.

Keep an eye on the following economic releases:

German, UK and US Flash Manufacturing PMI (24 July 2023)

Germany’s Manufacturing PMI experienced a downward revision in June 2023, reaching 40.6. In contrast, the UK’s PMI was revised upward to 46.5, while the US confirmed a PMI of 46.3, marking a six-month low. 

The figures for July 2023 will be released on 24 July. Analysts predict Manufacturing PMIs as follows: Germany at 40, the UK at 46, and the US at 46.

German, UK and US Flash Services PMI (24 July 2023)

US Services PMI was revised slightly higher to 54.4 in June 2023, while Germany’s was confirmed at 54.1, the lowest reading in three months. UK’s was confirmed at 53.7, the lowest in three months. 

Analysts predict Services PMIs for July 2023 as follows: Germany at 53.3, the UK at 53, and the US at 54.

Australia Consumer Price Index (26 July 2023) 

The annual inflation rate in Australia declined to 7% in Q1 2023, falling from an over-30-year high of 7.8% in the previous period. This marked the lowest recorded rate since Q2 2022. 

Looking ahead, analysts are forecasting a slower growth rate of 6.3% for the data covering the year up to June 2023. This information is scheduled for release on 26 July.

US FOMC Meeting Minutes (26 July 2023) 

The Fed decided to maintain its funds rate target at 5.25% in June 2023. Following the FOMC decision, the Fed Chair emphasised multiple times the necessity of raising rates further within the current year. 

For the upcoming meeting on 26 July, analysts forecast that the Fed will raise its interest rates to 5.5%.

European Central Bank Main Refinancing Rate (27 July 2023)

In its June meeting, the European Central Bank (ECB) raised its key interest rates by 25 bps to 4%. The ECB made it clear that future decisions would rely on incoming data and underscored its commitment to adopting a meeting-by-meeting approach in light of the uncertain economic environment, particularly as interest rates were nearing a potential peak level. 

For the upcoming 27 July meeting, analysts expect the central bank to implement another 25 bps increase to 4.25%.

US Advance GDP (27 July 2023)

The US economy expanded at an annualised rate of 2% on a quarter-on-quarter basis in Q1 2023. This growth was higher than the previous second estimate of 1.3%. 

The figures for Q2 2023 will be released on 27 July, with analysts projecting a slower growth rate of 1.9%. 

BOJ Rate Statement (28 July 2023) 

In its June meeting, the Bank of Japan decided to maintain its key short-term interest rate at -0.1% and kept the 10-year bond yields at 0%

For its upcoming meeting on 28 July, analysts anticipate the central bank to maintain the current interest rate levels.

服务器升级维护通知 – 2023年07月21日

尊敬的用户:

您好! VT Markets 致力于为客户提供更快速且稳定的交易环境,我们将于周末进行服务器 (MT4/MT5) 升级维护。

维护时段:
2023 年 07 月 22 日 (星期六) 07:00 至 12:00

上述时段采用 GMT+8

维护期间请您务必留意下列事项:

1. 服务器报价将会暂停,客户将无法建立新仓位或是关闭既有持仓。

2. 维护前后的市场价格可能发生跳空,在跳空范围内的挂单或止损/止盈设置将在维护结束后的市场价格成交。

3. 具体维护完毕与开盘时间请依据MT4/MT5软件为准。

望您谅解因此次升级维护为您所带来的不便,我们将继续为您提供更优质的服务。

如您有任何疑问,我们的团队将十分乐意为您解答。
请留言或发邮件至 [email protected] 或联系在线客服。

Dow Jones Rises on Johnson & Johnson’s Earnings Beat, While Netflix and Tesla Struggle

The Dow Jones Industrial Average continued its impressive winning streak for the ninth consecutive day, fueled by the better-than-expected earnings results of pharmaceutical giant Johnson & Johnson. With a 6% rise in Johnson & Johnson’s shares, the Dow recorded its best daily performance since 2017. Additionally, insurer Travelers surpassed revenue expectations for the quarter, contributing to the Dow’s overall gains.

However, the broader market faced challenges as post-earnings declines hit popular tech stocks like Netflix and Tesla. Netflix’s revenue fell short of analysts’ estimates, causing a more than 8% drop in its stock value, despite a positive year leading up to the report. Meanwhile, Tesla’s shares tumbled by 9.7% after CEO Elon Musk announced a slowdown in vehicle production during the third quarter for factory improvements.

Overall, corporate earnings have shown strength, with 74% of S&P 500 companies surpassing expectations. This has generated optimism for a favorable economic outlook, despite concerns from some about a potential bear market rally. The Dow’s outperformance compared to the tech-heavy Nasdaq 100 index marked a significant trend, emphasizing the market’s current dynamics.

Data by Bloomberg

On Thursday, the market declined by 0.68%. Utilities, Health Care, and Energy sectors showed gains of 1.85%, 1.65%, and 1.29%, respectively. Information Technology and Communication Services sectors experienced the most significant declines, dropping by 2.04% and 2.49%, while Consumer Discretionary sector faced the largest setback, declining by 3.40%.

Major Pair Movement

On Thursday, the dollar index rose by 0.6% as positive jobless claims and Philly Fed data boosted Treasury yields, leading to a risk-off sentiment in the market. The Nasdaq declined by about 2% as investors turned cautious. The dollar’s recovery was driven by its earlier decline in July, caused by hopes of U.S. disinflation, despite steady core PCE figures.

The dollar’s gains were fueled by the Bank of Japan’s Governor dismissing tightening speculation, doubts raised by an ECB hawk about multiple rate hikes, and below-forecast UK CPI affecting BoE rate hike expectations. The EUR/USD fell by 0.67% due to Germany’s real estate crisis and uncertainty surrounding China’s efforts to boost the yuan and economic growth. Sterling sank by 0.6%, testing BoE rate hike expectations. USD/JPY gained 0.33%, but caution remains ahead of Japan’s CPI report. The AUD/USD’s earlier gains were trimmed amid dollar strength and derisking despite solid jobs data and PBoC’s action to weaken USD/CNY.

Picks of the Day Analysis

EUR/USD (4 Hours)

EUR/USD Falls on Stronger US Dollar Ahead of Fed and ECB Meetings

The EUR/USD pair experienced its second consecutive daily decline and worst daily loss in a month as the US Dollar gained strength, pushing the pair towards 1.1100. Market participants are closely monitoring next week’s Federal Reserve (Fed) and European Central Bank (ECB) meetings, which have contributed to short-term momentum favoring the Dollar. Data on both sides, including improved consumer sentiment in the Euro area and tight US labor market indicators, influenced the Dollar’s rise and bond yields on both sides of the Atlantic.

Chart EURUSD by TradingView

According to technical analysis, the EUR/USD pair is moving lower on Thursday creating a push to the lower band of the Bollinger Band and creating a wider gap between the bands. The Relative Strength Index (RSI) is currently at 37, suggesting that the EUR/USD pair has the potential of moving lower.

Resistance: 1.1208, 1.1291

Support: 1.1086, 1.0977

XAU/USD (4 Hours)

XAU/USD Slides as US Dollar Gains Ground: Fed Policy Decision Looms

On Thursday, the XAU/USD pair experienced a decline to $1,965.30 per troy ounce as the US Dollar strengthened. The Dollar Index (DXY) surged towards 101.00, prompted by an upward correction after a consolidative phase at multi-month lows. Market sentiment for XAU/USD was mixed, with initial pessimism during Asian trading hours but a return to optimism in the American afternoon. While Wall Street saw mixed trades, only the Dow Jones Industrial Average remained in the green, while rising Treasury yields provided additional support to the USD. Market participants assessed a range of US data ahead of the Federal Reserve (Fed) monetary policy decision, which includes an anticipated 25 basis points (bps) rate hike as indicated by the Federal Open Market Committee (FOMC) dot-plot.

Chart XAUUSD by TradingView

According to technical analysis, the XAU/USD pair moved lower on Thursday and managed to reach the middle band of the Bollinger Bands. Currently, the price is slightly below the middle band, indicating a potential move towards the lower band. Additionally, the Relative Strength Index (RSI) is at 53, suggesting that the XAU/USD pair has returned to a neutral stance.

Resistance: $1,992, $2,013

Support: $1,970, $1,954

Stocks Rise as Earnings Season Kicks Off with Dow’s Longest Winning Streak in Four Years

Stocks showed positive momentum on Wednesday during the ongoing corporate earnings season, with the Dow Jones Industrial Average achieving its longest winning streak in nearly four years. The Dow closed 0.31% higher, at 35,061.21 points, marking its eighth consecutive day of gains, a feat not seen since September 2019. The S&P 500 also climbed 0.24% to 4,565.72, while the Nasdaq Composite edged up 0.03% to finish at 14,358.02. The current earnings season has shown promising results, with 78% of S&P 500 companies surpassing expectations, signaling an optimistic outlook for a potential soft-landing scenario as inflation data remains encouraging.

Goldman Sachs reported mixed results on profit and revenue, primarily influenced by losses in real estate and GreenSky. Despite the anticipated lackluster quarter, Goldman’s shares gained nearly 1%. Other major companies, including U.S. Bancorp and J.B. Hunt, experienced notable stock jumps of about 6.5% and 3.7%, respectively. Additionally, as prominent firms such as Netflix, Tesla, IBM, and United Airlines prepare to release their earnings, the market remains hopeful for continued positive outcomes. The positive sentiment was further boosted by Carvana, a used car retailer, which saw its shares surge by 40% after securing a deal to reduce its debt, and releasing its quarterly earnings report ahead of schedule.

Data by Bloomberg

On Wednesday, all sectors in the market showed an overall increase of 0.24%. The real estate sector experienced the highest gain, rising by 1.12%, followed by utilities, which increased by 1.02%. Consumer staples also performed well with a rise of 0.93%, while both the energy and consumer discretionary sectors saw a moderate increase of 0.52%. Health care and financials sectors followed closely with gains of 0.50% and 0.45% respectively. The communication services sector showed a more modest growth of 0.23%.

However, not all sectors had a positive day, as some faced declines. The industrials sector experienced a slight decrease of -0.05%, while the information technology sector saw a more significant decline of -0.27%. The materials sector had the largest decline among all sectors, with a drop of -0.52%. Overall, the market exhibited a mix of positive and negative performances across different sectors on Wednesday.

Find out Share CFDs with VT Markets

Major Pair Movement

The dollar index saw a rise of 0.34%, largely driven by a significant 0.85% drop in sterling. This decline in sterling led to a sharp decrease in BoE policy rate pricing and gilts yields. The oversold dollar had been rebounding since its collapse in July and gained traction after finding support at the midpoint of its previous advance. As a result, two-year gilts yield fell 20bp, and the expectation for a 50bp August BoE hike was repriced to just 25bp, with the likelihood of a following hike now in doubt. On the other hand, two-year Treasury yields remained flat, and the Fed’s next rate hike is priced at 25bp next week, with only a 28% probability of another hike before rate cuts in 2024. EUR/USD also fell 0.25%.

Looking ahead, Thursday’s below-forecast U.S., UK, and Canadian inflation data may bring increased focus on the Fed’s mandate for maximum employment. If initial and continued claims remain above forecast, it could strengthen the dollar’s bearish outlook. However, initial claims remain relatively low compared to historical levels. Meanwhile, the yen rose 0.52%, facing resistance at 140 due to a series of large 140 options expiring in the coming week. The dollar’s rebound and lingering uncertainty influenced the Australian dollar and yuan, both of which saw declines of 0.6% and 0.5% respectively. Upcoming events include Philly Fed, existing home sales, leading indicators on Thursday, and Japan’s CPI report on Friday.

Picks of the Day Analysis

EUR/USD (4 Hours)

EUR/USD Pair Holds Steady Despite Mixed Economic Data in EU and US

The EUR/USD pair experienced slight downward movement on Wednesday, reaching a low of 1.1173 before settling just below the 1.1200 threshold by the end of the day. The Euro was supported above 1.1200 during the first half of the day due to positive European data, with the Eurozone confirming a 5.5% YoY increase in the June Harmonized Index of Consumer Prices (HICP), meeting preliminary estimates. Additionally, the European Union’s annual inflation rate in June decreased to 6.4% from May’s 7.1%. Meanwhile, financial markets remained optimistic during the American session, despite discouraging US macroeconomic figures, which showed a 3.7% decline in June Building Permits and an 8% decrease in Housing Starts for the same month. The Greenback gained momentum after Wall Street’s opening, even as US indexes extended their rallies, with the Dow Jones Industrial Average rising for a seventh consecutive session, and the Nasdaq Composite and S&P 500 up for the third straight day. On Thursday, the macroeconomic calendar will feature the June German Producer Price Index (PPI) and Eurozone May Current Account, along with July Consumer Confidence data. Meanwhile, the US is set to publish weekly unemployment figures and June Existing Home Sales.

Chart EURUSD by TradingView

According to technical analysis, the EUR/USD pair is currently experiencing a period of consolidation, with limited movement and a narrower gap between the upper and lower bands of the Bollinger Bands. The Relative Strength Index (RSI) is currently at 58, suggesting that the EUR/USD pair has returned to a neutral stance.

Resistance: 1.1291, 1.1382

Support: 1.1173, 1.1086

XAU/USD (4 Hours)

XAU/USD Prices Slightly Down as US Dollar Rebounds on Easing Global Inflation

Gold prices experienced a modest decline on Wednesday, as the US Dollar regained demand due to recent oversold conditions and its inability to continue last week’s downward trend. Despite the dollar’s resurgence, global financial markets remained optimistic as inflation showed signs of easing, with the UK’s annual Consumer Price Index rising below market expectations and the Eurozone’s Harmonized Index of Consumer Prices also showing a modest increase. Global stocks continued to perform well, with US indexes posting significant gains for the third consecutive day and government bond yields easing, which tempered the bullish potential for XAU/USD. As a result, the precious metal traded at around $1,974 per troy ounce.

Chart XAUUSD by TradingView

According to technical analysis, the XAU/USD pair moved higher on Wednesday and managed to reach the upper band of the Bollinger Bands. Currently, the price is slightly below the upper band, indicating a potential move towards the middle band. Additionally, the Relative Strength Index (RSI) is at 75, suggesting that the XAU/USD pair has returned to a bullish sentiment.

Resistance: $1,992, $2,013

Support: $1,970, $1,954

Economic Data

CurrencyDataTime (GMT + 8)Forecast
AUDEmployment Change09:3032.6K (Actual)
AUDUnemployment Rate09:303.5% (Actual)
USDUnemployment Claims20:30239K

Strong Corporate Earnings Propel Dow Jones to New Highs

In a positive turn for investors, the Dow Jones Industrial Average soared on Tuesday as traders reacted to impressive corporate earnings reports. The Dow closed the day with a gain of 366.58 points, marking a 1.06% increase and reaching a new high of 34,951.93. Similarly, the Nasdaq Composite rose by 0.76% to end at 14,353.64, while the S&P 500 recorded a 0.71% gain, closing at 4,554.98. This remarkable performance resulted in the Dow’s seventh consecutive day of gains and the longest winning streak since March 2021, with all three major indexes achieving their highest closes since April 2022.

The positive earnings reports were led by Bank of America, which exceeded expectations for the second quarter due to higher interest rates, resulting in a more than 4% increase in the bank’s shares. Bank of New York Mellon also reported better-than-expected earnings, contributing to the upward momentum in the market. Other notable companies, such as Morgan Stanley and PNC Financial, saw their stocks rise following strong revenue and earnings performances. As the earnings season progresses, it is worth noting that a significant 84% of the S&P 500 companies that have reported have surpassed profit estimates, according to FactSet.

Despite softer data from the Commerce Department, including a modest increase of 0.2% in advance retail sales for June, investors remain optimistic. The positive sentiment stems from the belief that recent inflation data supports the likelihood of a soft-landing scenario, easing concerns of an imminent interest rate hike by the Federal Reserve. As a result, the stock market continues its rally, providing a positive outlook for investors in the near term.

Data by Bloomberg

On Tuesday, the overall market saw a positive performance with a gain of 0.71%. The Information Technology sector led the way with a significant increase of 1.26%, followed closely by Financials, which rose by 1.12%. Energy and Materials sectors also performed well, gaining 0.98% and 0.78% respectively. Health Care and Industrials sectors experienced moderate growth with gains of 0.70% and 0.57% respectively. Communication Services and Consumer Discretionary sectors had smaller gains of 0.38% and 0.28% respectively. On the other hand, Consumer Staples sector showed a slight decline of 0.13%. Utilities and Real Estate sectors experienced losses of 0.78% and 0.82% respectively.

Overall, it was a positive day for most sectors, particularly Information Technology and Financials, while Utilities and Real Estate sectors faced some decline.

Major Pair Movement

The dollar index managed to recover from its recent 13-month lows, halting the decline in Treasury yields that followed the release of the Consumer Price Index (CPI) data. Initially, the dollar dipped briefly after U.S. retail sales rose by 0.2%, falling short of the 0.5% forecast. However, the May figures were revised upward, and the control group, which feeds into the GDP calculation, saw a 0.6% increase, double the forecast and with a revised higher figure for May. This positive data reassured investors that the economy was performing well and eased concerns about the Federal Reserve tightening its monetary policy excessively. Consequently, the dollar and Treasury yields rebounded, with two-year Treasury yields rising by 2 basis points after a previous 9 basis point fall, while two-year bund yields fell by 9.4 basis points.

The divergence between two-year bund and Treasury yields had already begun to affect EUR/USD prices since Thursday, contributing to the retreat from 13-month highs observed on Tuesday. The upcoming Federal Reserve and European Central Bank meetings will provide further guidance to the markets, which are currently pricing in a peak in Fed rates this month and a faster decline in ECB rates next year. Despite hitting a high of 1.1276 on EBS, EUR/USD slid and failed to close above the 61.8% Fibonacci retracement level of the 2021-2022 decline at 1.1271. Meanwhile, the yen rebounded sharply against other currencies after Bank of Japan (BoJ) Governor Haruhiko Kuroda dashed hopes of a JGB yield cap increase. The recovery of the yen crosses has been struggling to regain the uptrend line from March, which was broken below last week and currently stands at 139.51. The importance of Japan’s Consumer Price Index data, scheduled for release on Thursday, has been reduced due to Ueda’s stance.

In the currency markets, the pound depreciated by 0.25%, influenced by a drop of approximately 10 basis points in gilts yields and a correction in the pound’s overbought readings, which were at their highest level in nearly three years. These developments occurred ahead of the upcoming UK employment data, which could impact the decision between a 25 basis point or 50 basis point rate hike at the Bank of England’s August meeting.

Picks of the Day Analysis

EUR/USD (4 Hours)

EUR/USD Remains Steady Within Limited Range Despite Positive Wall Street Earnings

The EUR/USD pair maintained a narrow trading range on Tuesday, reaching a yearly high of 1.1275. Initially, the US Dollar benefited from a negative market sentiment in the first half of the day, but the mood shifted with the release of positive Wall Street earnings reports. While the Eurozone did not publish significant figures, the United States unveiled mixed data, including modest Retail Sales and declining Industrial Production. On Wednesday, market focus turns to the final estimates of the June Harmonized Index of Consumer Prices (HICP) in the EU, while the United States prepares to release June Housing Starts and Building Permits.

Chart EURUSD by TradingView

According to technical analysis, the EUR/USD pair is currently experiencing a period of consolidation, with limited movement and a narrower gap between the upper and lower bands of the Bollinger Bands. The Relative Strength Index (RSI) is currently at 58, suggesting that the EUR/USD pair has returned to a neutral stance.

Resistance: 1.1291, 1.1382

Support: 1.1173, 1.1086

XAU/USD (4 Hours)

XAU/USD Prices Driven by Worsened Market Mood as US Dollar Temporarily Strengthens

The XAU/USD pair experienced an upward trajectory on Tuesday, reaching $1,972.17 per troy ounce in the European session due to a deteriorating market sentiment. Although the US Dollar saw some short-term demand prior to Wall Street’s opening and after the release of mixed US data, it quickly resumed its climb, surpassing the mentioned high and reaching a fresh 2023 high of around $1,984.35. The US Census Bureau reported that Retail Sales in the US increased by 0.2% MoM in June, falling short of market expectations. However, the Retail Sales Control Group exceeded predictions with a growth of 0.6%. Despite these figures, US equities surged, placing additional downward pressure on the American currency, particularly propelled by better-than-expected earnings reports from major banks, driving the Dow Jones Industrial Average to new yearly highs around 35,000.

Chart XAUUSD by TradingView

According to technical analysis, the XAU/USD pair moved higher on Tuesday and managed to reach the upper band of the Bollinger Bands. Currently, the price is slightly below the upper band, indicating a potential move towards the middle band. Additionally, the Relative Strength Index (RSI) is at 68, suggesting that the XAU/USD pair has returned to a bullish sentiment.

Resistance: $1,984, $2,001

Support: $1,962, $1,939

Economic Data

CurrencyDataTime (GMT + 8)Forecast
NZDCPI q/q06:451.1% (Actual)
GBPCPI y/y14:008.2%
USDHousing Starts20:301.48M

How to Trade Coffee: A Comprehensive Guide 

The coffee industry, valued at over 100 billion US dollars annually, boasts a thriving global market and is regarded as one of the most highly traded and consumed soft commodities worldwide. Coffee trading presents lucrative opportunities for traders, as it can be influenced by various external factors, including the prices of other commodities. 

In this article, we will explore the process of trading coffee, delve into its historical significance as a soft commodity, and analyse the factors that impact its price, while also discussing the available trading options. 

The Historical Background of Coffee Trading 

Coffee, classified as a soft commodity, is an agricultural product that shares similarities with other crops. Unlike hard commodities, which are extracted or mined, coffee is grown naturally. 

It has been an essential part of diets across the globe for centuries. Originating in the Middle East, coffee gained popularity as a beverage in the 15th century

European merchants discovered the flavourful bean in the 17th century, leading to the emergence of coffee trading. Merchants often gathered in coffee houses, which served as meeting places for trade discussions. 

Over time, coffee plantations established by European colonists transformed into modern coffee suppliers. Today, the industry produces approximately 170 million bags of coffee beans each year, offering significant potential for traders. 

Distinct Coffee Varieties 

The global coffee trade primarily revolves around two main types of coffee: Arabica and Robusta. These varieties possess unique flavours and are influenced by external factors that impact their respective prices. To determine which type of coffee to trade, it is crucial to comprehend the factors that affect the price of each variety. 

source: coffeefriend.co.uk
  • Arabica coffee, renowned for its superior quality, is favoured by cafe chains and features prominently in high-quality roasted coffee blends. Despite the common perception that Arabica is consistently more expensive than Robusta, this is not always the case.  Arabica beans account for 60-70% of the world’s coffee supply and are predominantly sourced from Brazil and Colombia. Arabica coffee tends to exhibit more stable price fluctuations. 
  • Robusta coffee, distinguished by its higher caffeine content, thrives in warmer climates and at lower altitudes compared to Arabica. It generally possesses a more bitter and earthy flavour profile, in contrast to Arabica’s acidity and fruitiness. 

Robusta accounts for around 30% of the coffee trading market and often trades at higher prices due to its demand among multinational corporations like Nestlé, which utilise the beans in global product lines such as Nescafé instant coffee. Vietnam is the primary producer of Robusta beans. 

Coffee Cultivation Regions 

The specific geographic conditions necessary for coffee cultivation define the “coffee belt.” This belt extends from the equator to the Tropic of Cancer in the north and the Tropic of Capricorn in the south. 

source: shopify.com

Although coffee of various types can be grown at different altitudes, the major coffee-producing nations include Brazil, Vietnam, Colombia, Indonesia, and Ethiopia. 

Coffee trading occurs worldwide, with the largest importers of beans being the European Union, the United States, Japan, Russia, and Canada. 

Given the multifaceted process of growing, harvesting, roasting, and transporting coffee, the coffee trade is subject to speculation and influenced by numerous factors that affect its price. Gaining familiarity with these fundamental aspects of the market is essential to master coffee trading. 

Factors Influencing Coffee Prices 

The intricate nature of coffee production, which involves planting, growth, and harvesting, means that multiple factors must align for coffee to reach the market successfully and be traded. 

Unexpected triggers can swiftly disrupt the coffee trading market, resulting in volatility. While volatility offers short-term profit opportunities for traders, those seeking stability may prefer to engage in coffee trading with a more consistent price index, utilising trends as guidance. 

  • Climate: Unforeseen climate conditions, such as frost, floods, or droughts, can devastate crops, driving up prices as suppliers struggle to meet demand. Conversely, favourable weather can result in an oversupply of coffee beans, causing prices to plummet. 
  • Consumer habits: Contemporary consumer preferences and evolving coffee culture impact the demand side of coffee trading. Specialised coffee varieties and concerns about caffeine’s effects and addictive properties have influenced prices. Additionally, during financial downturns or reduced consumer spending, the coffee trade may be negatively affected. 
  • Plant disease: Coffea plants are susceptible to climate and disease, with fungal infections like “coffee leaf rust” posing significant risks. Robusta coffee, being more resilient in the face of such diseases, can affect the prices of both major coffee bean types. 
  • Oil market: The prices of coffee transportation are influenced by the oil market, given that major coffee producers (e.g., Colombia, Brazil, and Vietnam) are located far from the main coffee-consuming regions. Spikes in oil prices subsequently impact coffee trading costs. 
  • Distribution costs: Apart from transportation-related expenses, shipping and freight costs also play a role in the coffee trade’s dynamics and overall pricing. 
  • Geopolitics: Geopolitical issues and instabilities in coffee-producing developing nations, which constitute a significant portion of the global supply, can cause price fluctuations. Similarly, political crises in major consumer nations can drive changes in demand. For instance, the Russia-Ukraine war has impacted Russia’s coffee consumption. 
  • US dollar: Like many commodities markets, coffee trading is priced in US dollars. Fluctuations in the value of the US currency consequently influence the commodity’s price. 

Coffee Trading Methods 

For those interested in coffee trading, selecting a preferred trading method is the first step. 

  • Spread betting on coffee: This financial derivative allows speculation on coffee’s price movements as an asset. Spread betting on coffee is tax-free in the UK and particularly suitable for short-term trading. 
  • Coffee CFDs: Similar to spread betting, trading coffee CFDs involves trading the difference between the opening and closing positions of a contract, reflecting the coffee market’s price movements. At the contract’s end, the parties exchange the difference, resulting in either profit or loss. Coffee CFDs are taxable in the UK and involve leveraging or margin rate trades, offering the potential for increased profits but also carrying higher risks of losses. 
  • Coffee futures: Trading coffee futures is a popular method that capitalises on the volatility of the coffee market. This approach establishes an exchange at a predetermined future date for a fixed price, enabling traders to benefit from market movements. 

Ready to Begin Coffee Trading? 

VT Markets provides a user-friendly trading environment, simplifying the process of starting your coffee trading journey. 

You can initiate your coffee trading experience by signing up for a free demo account, allowing you to practice trading coffee CFDs and futures on a risk-free platform for 90 days. 

Alternatively, you can create a live trading account to jump straight into the action. 

If you need guidance on opening your coffee trading account or wish to establish your trading portfolio, feel free to contact us. We are here to assist you in embarking on your trading endeavours. 

Summary: 
  • Coffee trading is a highly profitable market worth over 100 billion US dollars annually. 
  • Coffee, a soft commodity, has a rich history as an agricultural product and has been traded for centuries. 
  • Arabica and Robusta are the main types of coffee traded globally, each with its own flavour profile and price dynamics. 
  • Coffee is primarily grown in the “coffee belt,” with major producers including Brazil, Vietnam, Colombia, Indonesia, and Ethiopia. 
  • Various factors influence coffee prices, such as climate conditions, consumer habits, plant diseases, the oil market, distribution costs, geopolitics, and the value of the US dollar. 
  • Traders can engage in coffee trading through spread betting, coffee CFDs, or coffee futures. 
Back To Top
server

您好 👋

我能帮您什么吗?

立即与我们的团队聊天

在线客服

通过以下方式开始对话...

  • Telegram
    hold 维护中
  • 即将推出...

您好 👋

我能帮您什么吗?

telegram

用手机扫描二维码即可开始与我们聊天,或 点击这里.

没有安装 Telegram 应用或桌面版?请使用 Web Telegram .

QR code