Stock Market Soars on Debt Ceiling Optimism and Strong Earnings: S&P 500 and Nasdaq Reach Yearly Highs

On Thursday, the S&P 500 and Nasdaq Composite surged to their highest closing levels since August 2022, driven by ongoing debt ceiling negotiations. The S&P 500 rose by 0.94% to reach 4,198.05, while the Dow Jones Industrial Average ended the day up 0.34% at 33,535.91, and the Nasdaq gained 1.51% to close at 12,688.84. This marked the second consecutive positive session for the major stock indexes. The weekly gains for the indexes were also boosted by the advance, with the Nasdaq leading the way with a 3.3% increase, followed by the S&P 500 up 1.8% and the Dow up 0.7%.

Debt ceiling negotiations remained a focal point for Wall Street, with House Speaker Kevin McCarthy expressing optimism that a deal could be reached before a House vote next week. Traders appeared to be cautiously optimistic, looking past some of the drama surrounding the negotiations. The positive market sentiment was supported by strong financial results from retail giant Walmart, which saw its stock rise by 1.3% after beating Wall Street forecasts and raising its full-year performance expectations. However, the market’s sentiment was somewhat tempered by comments from Dallas Fed President Lorie Logan, who indicated that the latest economic data does not warrant a pause in rate hikes yet, suggesting the possibility of another rate hike at the June policy meeting based on forthcoming inflation and employment data.

All sectors performance based on debt ceiling optimism

Data by Bloomberg

On Thursday, the stock market experienced overall gains, with the S&P 500 rising by 0.94%. The Information Technology sector performed particularly well, surging by 2.06%, followed by the Communication Services sector, which saw a gain of 1.79%. The Consumer Discretionary sector also showed strong growth, increasing by 1.54%. Financials and Industrials sectors both had more modest gains of 0.70% and 0.67% respectively, while the Materials and Energy sectors experienced smaller increases of 0.55% and 0.49%. However, the Health Care sector saw a decline of 0.24%, and the Utilities and Consumer Staples sectors also experienced losses, down by 0.36% and 0.44% respectively. The Real Estate sector had the largest decline, falling by 0.68%.

Major Pair Movement

The dollar index saw a significant increase of 0.67%, reaching its highest level since May 20. This surge was driven by positive U.S. jobless claims data and reduced concerns about bank and debt defaults. As Treasury yields improved and the outlook for the U.S. economy brightened, the market adjusted its expectations, with the likelihood of aggressive rate cuts in the second half of the year diminishing and the possibility of a rate hike in June increasing.

EUR/USD continued its downward trend, falling below key levels such as the 100-day moving average, the 50% retracement of its March-April rise, and the uptrend line from last year’s lows. Several factors contributed to the euro’s decline, including disappointing economic data in the eurozone, China’s underwhelming reopening after the pandemic, and reduced concerns about banking and Treasury defaults in the United States.

Meanwhile, USD/JPY experienced a surge as Treasury-JGB yield spreads widened and risk appetite improved. The pair surpassed previous peaks and reached halfway between its peak and low from last year. The 0.67% gain in USD/JPY was similar to the dollar’s gains against other major currencies like the yuan, euro, and sterling. However, caution remains as the upcoming Japanese CPI report and the possibility of the Bank of Japan tightening its policies in response to rising inflation could lead to a correction in overbought USD/JPY prices.

Picks of the Day Analysis

EUR/USD (4 Hours)

EUR/USD Continues Downward Trend as US Dollar Strengthens Amid Rate Hike Speculations

The EUR/USD continued its downward trend, dropping for the fifth time in six days. There are no signs of stabilization as the US dollar gains strength in the market. Comments from the Federal Reserve indicating the lack of support for skipping a rate hike at the next meeting boosted US yields, leading to increased expectations of a rate hike (although still below 50%).

Recent US economic data, such as declining Initial Jobless Claims and an improved Philly Fed index, contributed to the strengthening of the US dollar. On the other hand, the European Central Bank’s concerns about inflation in the service sector have reduced expectations of further rate hikes for the Euro. Germany’s upcoming release of wholesale inflation numbers is anticipated to show a decline in the Producer Price Index and a decrease in the annual rate.

Chart EURUSD as a result of debt ceiling optimism

Chart EURUSD by TradingView

According to technical analysis, the EUR/USD pair is moving lower and creating a push to the lower band of the Bollinger Bands. It is expected that the EUR/USD will make a slight upward move towards the middle band before determining its next direction. The Relative Strength Index (RSI) is currently at 25, indicating an overall bearish trend in the EUR/USD market.

Resistance: 1.0815, 1.0848

Support: 1.0750, 1.0715

XAU/USD (4 Hours)

Gold (XAU/USD) Extends Bearish Route as US Dollar Gains Amid Debt Ceiling Optimism and Hawkish Fed Comments

Spot gold (XAU/USD)continued its downward trend, hitting its lowest level since April 3 at $1,951.92 per troy ounce. Despite optimism in the financial markets regarding the extension of the US debt ceiling, the US dollar remained strong and gained further ground during the American session. House Speaker Kevin McCarthy expressed confidence in reaching a debt limit deal, while Federal Reserve speakers surprised with a hawkish tone, suggesting the possibility of an interest rate hike in June.

Economic data showed better-than-expected initial jobless claims and an improvement in the May Philadelphia Fed Manufacturing Survey, but existing home sales declined in April. US stock indexes traded mixed, with the Nasdaq Composite performing the best, and US Treasury yields rebounded, supporting the strength of the US dollar.

Chart XAUUSD as a result of debt ceiling optimism

Chart XAUUSD by TradingView

According to technical analysis, XAU/USD continued to fall on Thursday, leading to further downward pressure on the lower band of the Bollinger Bands. There is a possibility that XAU/USD may experience an upward movement towards the middle band of the Bollinger Bands. Currently, the Relative Strength Index (RSI) stands at 23, indicating that XAU/USD is in a bearish trend.

Resistance: $1,974, $1,991

Support: $1,950, $1,934
Notification of Server Upgrade – May 18, 2023

Dear Client,

As part of our commitment to provide the most reliable service to our clients, there will be server maintenance this weekend.

Maintenance Hours : 20th of May 2023 (Saturday) 02:00 – 24:00 (GMT+3)

Please note that the following aspects might be affected during the maintenance:

1. The price quote feature on the Client Portal will be temporarily unavailable. You will not be able to open new positions or close existing positions.

2. There might be a gap between the original price and the price after maintenance. The gaps between Pending Orders, Stop Loss and Take Profit will be filled at the market price once the maintenance is completed.

3. Certain features on the Client Portal will be temporarily unavailable.

4. Please refer to MT4/MT5 for the latest update on the completion and market opening time.

Our services will be back online once the maintenance is completed.

Thank you for your patience and understanding about this important initiative. If you’d like more information, please don’t hesitate to contact [email protected].

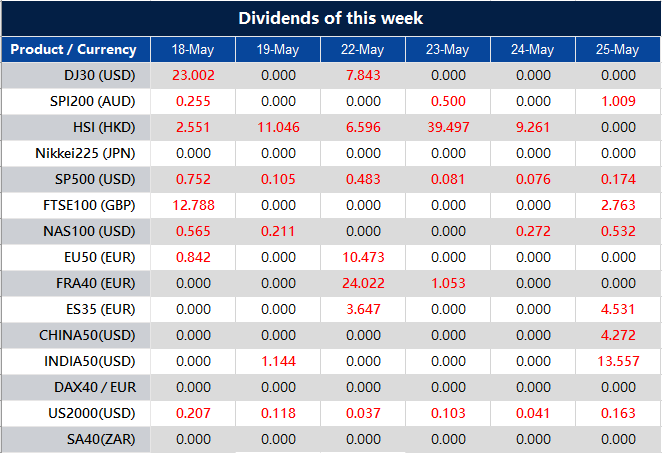
Weekly Dividend Adjustment Notice – May 18, 2023

Dear Client,

Please note that the dividends of the following products will be adjusted accordingly. Index dividends will be executed separately through a balance statement directly to your trading account, and the comment will be in the following format “Div & Product Name & Net Volume ”.

Please refer to the table below for more details:

The above data is for reference only, please refer to the MT4/MT5 software for specific data.

If you’d like more information, please don’t hesitate to contact [email protected]

Market Outlook – Interesting week ahead for Australia, New Zealand, and Canada

Stocks Rise as Hope Grows for U.S. Debt Ceiling Deal, Averting Default

Stocks experienced a positive surge as investors remained hopeful that an agreement on the U.S. debt ceiling could be reached between congressional leaders and President Joe Biden, thereby averting a catastrophic default. The Dow Jones Industrial Average rose by 408.63 points or 1.24%, reaching 33,420.77, while the S&P 500 increased by 1.19% to 4,158.77, and the Nasdaq Composite advanced 1.28% to 12,500.57. Following a meeting with Biden, House Speaker Kevin McCarthy stated that progress had been made and a potential deal could be reached by the end of the week. Biden cancelled part of an international trip to focus on the negotiations, expressing confidence in avoiding a default.

Concerns regarding a potential default had been impacting the markets, with the Dow experiencing a 2% decline this month, including a 1% drop on Tuesday. Treasury Secretary Janet Yellen emphasized the immediate need to raise the debt limit, as the country faced the risk of defaulting as early as June 1. The market sentiment improved on Wednesday as regional bank shares rebounded, particularly Western Alliance Bancorp, which reported positive deposit growth. This led to a 10.2% surge in Western Alliance’s stock and a more than 7% increase in the SPDR S&P Regional Bank ETF (KRE), contributing to the overall positive market trend.

All sectors stocks performance for the upcoming U.S. Debt Ceiling Deal

Data by Bloomberg

On Wednesday, all sectors experienced an overall positive performance in the market. The financial sector led the gains with a significant increase of 2.09%, followed closely by the energy sector at 2.07%. Consumer discretionary stocks also saw a notable rise of 2.04%, while industrials recorded a gain of 1.70%. Real estate and information technology sectors both contributed to the positive trend, rising by 1.29% and 1.28% respectively. Communication services also saw a modest increase of 1.18%. However, the materials sector showed a relatively lower growth of 0.67%.

In contrast, the health care sector had a marginal gain of 0.10%, while consumer staples experienced a slight decline of -0.10%. The utilities sector saw a relatively larger decrease of -0.36%. Overall, Wednesday’s market performance indicated a broad positive sentiment, particularly driven by strong performances in the financial, energy, and consumer discretionary sectors.

Major Pair Movement

The dollar initially strengthened on Wednesday due to rising Treasury yields but later lost some of its gains as risk-on sentiment increased. The yen was the exception, weakening broadly against the dollar. The Japanese currency fell 0.9% against the dollar as USD/JPY approached key resistance levels.

EUR/USD experienced a rebound from its lows, although it still declined by 0.2%. Market expectations for aggressive rate cuts by the Federal Reserve in the second half of the year decreased, while the European Central Bank’s rate hike expectations remained limited. Concerns over euro zone data and a weaker reopening in China impacted demand prospects. The U.S. inflation rate remained high, and the Federal Reserve is monitoring it closely. Sterling, being more sensitive to risk, recovered to near-flat levels from its recent lows.

In addition to the ongoing U.S. debt ceiling negotiations, Thursday’s focus will be on U.S. initial jobless claims, with a decrease anticipated. The outcome of these claims will impact the dollar. Other key data to be released on Thursday includes the Philly Fed index and existing home sales.

Picks of the Day Analysis

EUR/USD (4 Hours)

EUR/USD Drops to Monthly Lows Against Dollar Amid ECB Divergence and Rate Hike Uncertainty

On Wednesday, the EUR/USD dropped to monthly lows near 1.0800 but later recovered some losses during the American session. The Euro faced downward pressure due to divergence among European Central Bank (ECB) officials and uncertainty regarding future rate hikes. Eurozone bond yields rose, although US yields outpaced them. Risk sentiment improved, leading to a slight weakening of the US Dollar. The Federal Reserve showed some division on their next course of action, with a 28% chance of a rate hike at the June meeting according to the CME Fed Watch Tool. Mixed US housing data was released, and upcoming data includes Jobless Claims, the Philly Fed index, and Existing Home Sales. While the debt ceiling situation has become less dramatic, a resolution is still pending.

Chart EURUSD as a result of the upcoming U.S. Debt Ceiling Deal

Chart EURUSD by TradingView

According to technical analysis, the EUR/USD pair is currently moving sideways after a downward movement on Wednesday. The price is currently trading between the lower and middle bands of the Bollinger Bands. It is expected that the EUR/USD will make a slight upward move towards the middle band before determining its next direction. The Relative Strength Index (RSI) is currently at 36, indicating an overall bearish trend in the EUR/USD market.

Resistance: 1.0885, 1.0930

Support: 1.0820, 1.0785

XAU/USD (4 Hours)

Gold (XAU/USD) Extends Decline as Dollar Strengthens Despite Positive Market Sentiment

Spot Gold (XAU/USD) experienced a decline, reaching its lowest level for May at $1,974.99 per troy ounce. The XAU/USD pair rebounded slightly after the opening of Wall Street and traded around $1,980. The fall in gold prices was driven by renewed demand for the US Dollar, despite an improved market mood. President Joe Biden and congressional leaders met to discuss extending the debt ceiling, and positive statements from Republican Kevin McCarthy raised hopes of reaching a deal by the end of the week. Asian and European stock markets closed with mixed results, while American markets showed substantial gains, which had a dampening effect on the US Dollar. Federal Reserve officials attempted to downplay the likelihood of a rate cut later in the year, emphasizing that more work needs to be done. Cleveland Fed President Loretta Mester stated that she believes the central bank has not yet reached a point where interest rates can be held steady, as inflation remains persistent. While financial markets have priced in a pause in rate hikes for June and July, Fed members are still discussing whether or not to proceed with the pause.

Chart XAUUSD as a result of the upcoming U.S. Debt Ceiling Deal

Chart XAUUSD by TradingView

According to technical analysis, XAU/USD continued to fall on Wednesday, leading to further downward pressure on the lower band of the Bollinger Bands. There is a possibility that XAU/USD may experience an upward movement towards the middle band of the Bollinger Bands. Currently, the Relative Strength Index (RSI) stands at 34, indicating that XAU/USD is in a bearish trend.

Resistance: $1,991, $2,002

Support: $1,974, $1,966

Economic Data

CurrencyDataTime (GMT + 8)Forecast
AUDEmployment Change09:30-4.3K (Actual)
AUDUnemployment Rate09:303.7% (Actual)
USDUnemployment Claims20:30253K
CADBOC Gov Macklem Speaks23:00

Stocks Slide as Home Depot Disappoints and Debt Ceiling Talks Intensify

Stocks experienced a decline on Tuesday, influenced by Home Depot’s underwhelming forecast. The financial market also focused on a crucial meeting between President Joe Biden and congressional leaders regarding the U.S. debt ceiling. The Dow Jones Industrial Average closed below its 50-day average for the first time since March 30, with a drop of 336.46 points or 1.01% to 33,012.14. Similarly, the S&P 500 decreased by 0.64% to 4,109.90, while the Nasdaq Composite fell 0.18% to 12,343.05.

The disappointing performance of Home Depot, a Dow member, contributed to the overall decline. The company reported lower-than-expected quarterly revenue and revised its full-year guidance due to consumers postponing major home improvement projects. Furthermore, April’s retail sales figures were weaker than economists predicted, with a 0.4% increase instead of the anticipated 0.8%.

The financial market has remained stuck within a range of 3800 to 4200 on the S&P 500 since November, indicating the uncertainty felt by investors regarding policy outcomes. Questions surrounding the economy’s response, consumer spending sustainability, and the duration of these conditions have contributed to this stagnant state, according to U.S. Bank Wealth Management’s Bill Merz.

Investors are anxiously awaiting progress on debt ceiling negotiations, with Treasury Secretary Janet Yellen warning of a potential default as early as June 1 if no agreement is reached. Yellen emphasized the severe consequences of a default, including a potential breakdown of financial markets and worldwide panic.

President Biden maintains optimism about the ongoing negotiations, while House Speaker Kevin McCarthy highlights significant obstacles that still need to be overcome. Biden has stood firm on his position that raising the debt ceiling is non-negotiable, while McCarthy has advocated for a deal linking the increase to spending cuts. In response to the pressing matters, Biden will curtail his upcoming international trip and prioritize the debt ceiling negotiations.

All sectors' performance as Home Depot Disappoints and Debt Ceiling Talks Intensify

Data by Bloomberg

On Tuesday, the overall market experienced a decline of 0.64% in price change across all sectors. However, some sectors managed to show positive gains, with Communication Services leading the way with a 0.59% increase, followed by Information Technology with a modest gain of 0.16%.

On the other hand, several sectors faced notable losses, with Real Estate taking the biggest hit, declining by 2.61%. Energy and Utilities also struggled significantly, with both sectors experiencing declines of 2.54% and 2.30%, respectively. Industrials and Materials also faced notable losses, dropping by 1.36% and 1.64%, respectively. Other sectors that experienced negative price changes include Consumer Staples (-0.88%), Financials (-0.97%), Health Care (-0.82%), and Consumer Discretionary (-0.25%).

Major Pair Movement

The dollar index rebounded on Tuesday, recovering from initial losses as strong U.S. data and opposition to rate cuts by Federal Reserve speakers lifted Treasury yields. However, the dollar’s gains were limited as 2- and 10-year rates faced resistance from their 200-day moving averages, resulting in modest pullbacks.

While U.S. data showed solid performance, it was marred by downward revisions to previous months and April’s retail sales rise of 0.4% fell short of the forecasted 0.8%. However, the control group’s 0.7% increase, surpassing the 0.3% forecast, provided some offsetting positive news. Industrial production was revised down, almost offsetting the beat in April.

As a result, EUR/USD remained largely unchanged, while sterling experienced a 0.36% loss. USD/JPY surged after the U.S. data release, reaching a high of 136.69 on EBS. Despite this, the pullback in Treasury yields limited USD/JPY’s gain to only 0.15%.

Picks of the Day Analysis

EUR/USD (4 Hours)

EUR/USD Retreats as Stronger US Dollar and Hawkish Sentiment Drive Market Dynamics

On Tuesday, the EUR/USD briefly surpassed 1.0900 but retreated to 1.0855 due to a stronger US Dollar. The Dollar gained strength due to risk aversion, higher US yields, and hawkish comments from Federal Reserve officials, despite mixed US data. In Europe, the German ZEW Economic Sentiment index declined, while Eurozone Preliminary GDP data showed modest growth.

The Euro was largely unaffected by these numbers. Market participants anticipate another rate hike in June, and upcoming releases include Eurostat’s final inflation for April and a speech by the European Central Bank’s De Guindos. In the US, Retail Sales and Industrial Production had mixed results. Fed officials’ remarks supported the Greenback, pushing US yields higher and impacting the EUR/USD exchange rate. At present, the US Dollar maintains its dominant position.

Chart EURUSD as Home Depot Disappoints and Debt Ceiling Talks Intensify

Chart EURUSD by TradingView

According to technical analysis, the EUR/USD pair is moving in consolidating mode and keep moving between the lower and middle band of the Bollinger band. It is anticipated that the EUR/USD will make a lower move and push the lower band and reach the support level. The Relative Strength Index (RSI) is currently at 38, indicating an overall bearish trend in the EUR/USD market.

Resistance: 1.0885, 1.0930

Support: 1.0820, 1.0785

XAU/USD (4 Hours)

Gold (XAU/USD) Drops Below $2,000 as US Dollar Strengthens on Retail Sales

On Tuesday, Spot Gold (XAU/USD)experienced a decline, falling below the $2,000 mark due to increased buying of the US Dollar by market participants following the release of several US economic data. While US Retail Sales in April showed a modest 0.4% monthly increase, it fell short of expectations.

However, there was some positive news as April Capacity Utilization met expectations and Industrial Production surpassed predictions with a 0.5% rise. Additionally, the NAHB Housing Market Index improved to 50 in May from its previous level of 45.

These data outcomes affected the market sentiment negatively, leading to US indexes trading in the red and European indexes ending the session with modest losses. Furthermore, government bond yields surged, with the 10-year Treasury note yielding 3.56% (up 5 basis points) and the 2-year note offering 4.10% (up 10 bps) on the day.

The ongoing debt-ceiling negotiations between President Joe Biden and lawmakers also contributed to the cautious sentiment as investors awaited updates to avoid a default.

Chart XAUUSD as Home Depot Disappoints and Debt Ceiling Talks Intensify

Chart XAUUSD by TradingView

According to technical analysis, XAU/USD fell on Tuesday after some flat movement in the last few days, creating a push lower movement for the lower band of the Bollinger Band. There’s a possibility that XAU/USD might move higher to reach the middle band of the Bollinger band. Currently, the Relative Strength Index (RSI) stands at 34, indicating that XAU/USD is in the bearish mode.

Resistance: $2,002, $2,017

Support: $1,986, $1,974

Economic Data

CurrencyDataTime (GMT + 8)Forecast
AUDWage Price Index q/q09:300.9%
GBPBOE Gov Bailey Speaks17:50

Debt Ceiling Negotiations and Economic Data Influence Stock Market, Retail Reports Awaited

The S&P 500 experienced a slight increase at the beginning of the week as traders analyzed ongoing negotiations regarding the debt ceiling. The broader index rose by 0.3% to reach 4,136.28 points. Meanwhile, the Dow Jones Industrial Average ended its five-day losing streak, gaining 47.98 points (0.14%) and reaching 33,348.60 points. The tech-heavy Nasdaq Composite outperformed both indices, rising by 0.66% to reach 12,365.21 points. The focus for investors was on the debt ceiling talks, which were rescheduled to this week after being postponed from Friday. President Joe Biden is expected to meet with top congressional leaders on Tuesday to discuss this matter.

Investors are closely monitoring the debt ceiling negotiations, as failure to reach an agreement could have severe financial consequences. Treasury Secretary Janet Yellen warned that a failure to address the debt ceiling could lead to “financial chaos.” However, Yellen expressed optimism over the weekend, stating that negotiations were active and that areas of agreement had been found.

The market remains cautious, as each day of delay and lack of progress makes it increasingly challenging for the market to gain momentum. Additionally, investors are analyzing the latest economic data, including the May data for the Empire State Manufacturing survey, which showed a significant decline in manufacturing activity in New York. Throughout the week, investors will also be paying attention to major retail reports from Home Depot, Target, and Walmart, which will provide further insight into the state of the consumer.

All sectors' performance as a result of Debt Ceiling Negotiations and Economic Data

Data by Bloomberg

On Monday, the stock market witnessed varied price changes across different sectors. Overall, the market experienced a positive trend with an increase of 0.30%. The materials sector performed particularly well, showing a significant rise of 0.85%. Financials and information technology sectors also displayed strong gains, with increases of 0.82% and 0.74% respectively. Industrials saw a moderate increase of 0.51%. However, energy and consumer discretionary sectors had more modest gains of 0.20% and 0.14% respectively. On the other hand, the communication services sector experienced a slight decline of -0.03%. Health care, real estate, consumer staples, and utilities sectors witnessed negative trends, with price decreases of -0.16%, -0.24%, -0.27%, and -1.24% respectively.

Major Pair Movement

On Monday, the US dollar retreated across the board after last week’s risk-off gains, as investors prepared for the upcoming US retail sales report and debt ceiling talks. Market sentiment was mixed as a volatile NY Fed report was met with caution, and several Federal Reserve speakers pushed back against expectations of rate cuts. The dollar index lost 0.25%, while the euro gained in response.

The Australian dollar, considered a high-beta currency, rebounded strongly against the low-beta yen, with AUD/JPY rising over 1% compared to USD/JPY’s modest 0.22% gain. The market remained hopeful that China would increase stimulus measures to support economic growth, and there was speculation that the US would avoid a debt default, boosting risk appetite. Additionally, there was a bounce in US bank stocks, contributing to the positive risk sentiment.

The British pound rallied throughout the day, influenced by risk acceptance flows and anticipation of employment and wage data that could support the Bank of England’s rate hiking stance. The Japanese yen’s gains were limited as the government showed lukewarm reception to the Bank of Japan’s policy review, reducing expectations of accommodative measures being scaled back.

Picks of the Day Analysis

EUR/USD (4 Hours)

Euro Makes Modest Gains Against Weakening US Dollar, Concerns Remain Over Eurozone Data and Debt Ceiling Drama

EUR/USD rose slightly on Monday as the US Dollar weakened following disappointing economic data. However, the Euro faced further losses against the Pound, nearing multi-month lows. Industrial Production in the Eurozone declined by 4.1% in March, surpassing the expected 2.5% decrease. In Germany, the Wholesale Price Index fell 0.4% in April, better than the anticipated -0.9%, while the annual index dropped from 2% in March to -0.5% in April. On Tuesday, Eurozone employment and GDP data for Q1 will be released, along with the May German ZEW survey. The Eurozone is expected to see a marginal expansion, avoiding contraction.

The US Dollar weakened on Monday amid mixed market conditions, influenced by the sharp decline in the US New York Empire Manufacturing index from 10.8 in April to -31.8 in May. Key data to watch on Tuesday includes April’s Retail Sales report. President Biden is set to meet with House Speaker Kevin McCarthy to discuss the debt ceiling issue. Despite higher US bond yields, the decline in the Dollar occurred alongside an improvement in market sentiment.

Chart EURUSD as a result of Debt Ceiling Negotiations and Economic Data

Chart EURUSD by TradingView

According to technical analysis, the EUR/USD pair is currently attempting to recover after a few days of downward movement, aiming to reach the middle band of the Bollinger band. It is anticipated that the EUR/USD will make a slight upward move and endeavor to reach the middle band. The Relative Strength Index (RSI) is currently at 36, indicating an overall bearish trend in the EUR/USD market.

Resistance: 1.0885, 1.0930

Support: 1.0820, 1.0785

XAU/USD (4 Hours)

Gold (XAU/USD) Gains Modestly Amid Debt Ceiling Concerns, Stocks and Bond Yields Mixed

Spot gold (XAU/USD) started the week with modest gains, trading around $2,020 per troy ounce. The advance in XAU/USD was supported by a decrease in demand for the US Dollar and an improved market mood. However, caution remained as negotiations related to the US debt ceiling were extended. Investors are closely watching the potential for a US default, with President Joe Biden scheduled to meet with lawmakers on Tuesday to find a resolution.

In the stock markets, there was a positive trend, although momentum was limited. The Dow Jones and S&P 500 saw gains of less than 0.10%, while the Nasdaq Composite performed the best, rising by 56 basis points (bps). Concurrently, government bond yields also increased, with the 10-year Treasury note reaching a yield of 3.51%, up by 4 bps, and the 2-year note remaining unchanged at 4.0%. The rise in US yields acted as a limiting factor for the bullish potential of XAU/USD.

Chart XAUUSD as a result of Debt Ceiling Negotiations and Economic Data

Chart XAUUSD by TradingView

According to technical analysis, XAU/USD has been trading in a flat range for the past few days and has recently reached and is moving around the middle band of the Bollinger Band. The proximity of the upper band to the lower band suggests a potential consolidation phase for XAU/USD. Currently, the Relative Strength Index (RSI) stands at 48, indicating that XAU/USD is in a consolidation mode.

Resistance: $2,023, $2,036

Support: $2,010, $2,000

Economic Data

CurrencyDataTime (GMT + 8)Forecast
GBPClaimant Count Change14:000.0%
CADConsumer Price Index20:300.5%
USDRetail Sales20:300.8%

Week Ahead: Markets to Focus on US Retail Sales and Australia Wage Price and Employment Change

The financial industry anticipates major economic reports this week, focusing on the US Retail Sales and Australia Wage Price Index and Employment Change. These reports are crucial for traders navigating the markets and making informed decisions.

NY Empire State Manufacturing Index | US (15 May)
The NY Empire State Manufacturing Index unexpectedly jumped to 10.8 in April 2023 from -24.6 in March 2023.
Analysts expect a reading of 8 for May 2023.

Claimant Count Change | UK (16 May)
The number of people claiming for unemployment benefits in the UK rose by 28,200 in March 2023, the first increase in three months, and the biggest since February 2021.
The UK Claimant Count Change for April will be released on 16 May, with analysts expecting a decrease of 15,000.

Consumer Price Index | Canada (16 May)
Canada’s CPI increased by 0.5% in March 2023 compared to February 2023 figures.
Data for April will be released on 16 May, with analysts expecting an increase of 0.3%.

Retail Sales | US (16 May)
US retail sales dropped 0.6% in March 2023, after falling 0.7% in February 2023.
Analysts project a 0.7% increase for April 2023, with the data set to be published on 16 May.

Wage Price Index | Australia (17 May)
Australia’s seasonally adjusted Wage Price Index jumped 3.3% year-on-year in Q4 2022, after an upwardly revised 3.2% growth in Q3 2022.
Data for Q1 2023 will be released on 17 May, with analysts expecting another increase of 3.5%.

Employment Change | Australia (18 May)
Australia’s employment rate increased to 13.88 million, with a surge of 53,000 in March 2023. The unemployment rate stood at 3.5%.
The data for April 2023 is set to release on 18 May, with analysts expecting the employment rate to increase by 25,000. The unemployment rate is likely to remain at 3.5%.

When to Trade Forex: Is there a best time?

Forex trading is a global market that operates 24 hours a day. And it is important to know the best times to trade in order to maximise your profits. 

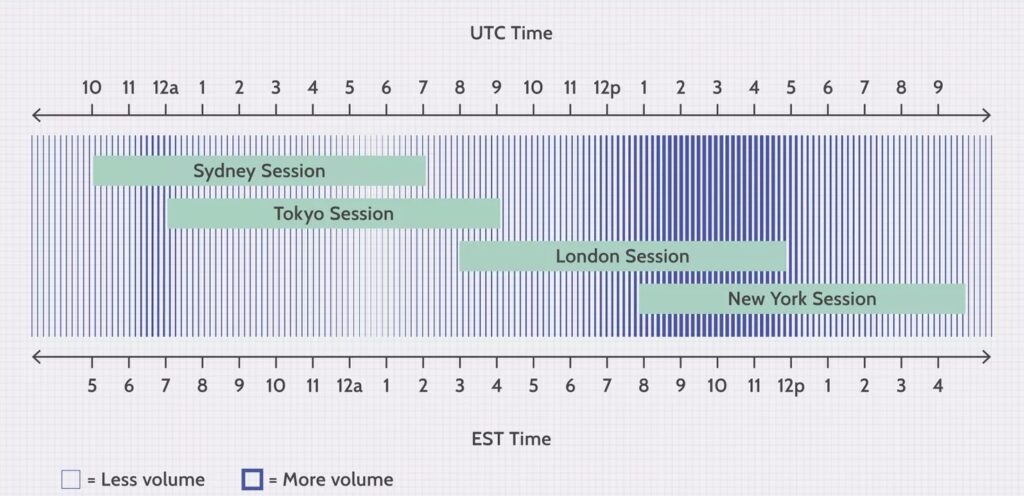
The Forex market can be divided into four major trading sessions: the Sydney session, the Tokyo session, the London session, and the New York session.  

source: investopedia.com

The Forex market opens in New Zealand on Monday morning, while it is still Sunday in most parts of the world. The market operates continuously from Monday to Friday, and there are no formal closing times during the week. 

As one region’s Forex market closes, another region’s market opens or is already open, resulting in overlapping trading periods, which are often the most active times in Forex trading. 

Apart from weekends, there are only two public holidays when the Forex market remains closed worldwide: Christmas and New Year’s Day. 

You should be aware that the opening hours of the Forex market may vary in March, April, October, and November due to different countries’ daylight savings schedules. This is an important consideration if you plan to trade during those times. 

Traditionally, the Forex market has had three main trading sessions that traders tend to focus on instead of trading all day and night. This is referred to as the “Forex 3-session system”, which includes the Asian, European, and North American sessions, also known as Tokyo, London, and New York. 

Tokyo session 

The Tokyo session starts at 12:00 am GMT. Japan is the world’s third-largest Forex trading centre. During the Asian session, around 20% of all Forex trading volume occurs. 

Economic data from Australia, New Zealand, China and Japan are released early in the session, and this could provide an excellent opportunity to trade news events. 

The Tokyo session’s moves could set the tone for the rest of the day, and traders in later sessions often evaluate what strategies to take in other sessions 

London session 

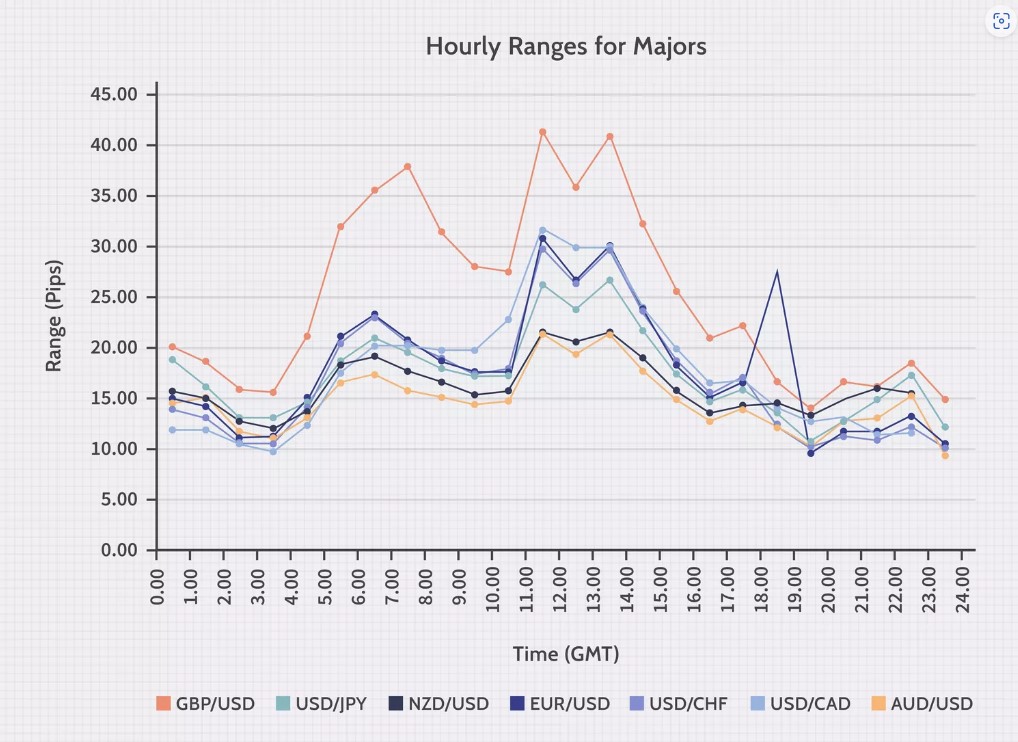
London’s strategic location benefits from its time zone, as its morning overlaps with late trading in Asia, and its afternoon overlaps with New York City. 43% of all Forex transactions happen in London. 

The London session is also known as the “European” trading session. Other major financial centres such as Geneva, Frankfurt, Zurich, Luxembourg, Paris, Hamburg, Edinburgh, and Amsterdam are also open during this time. 

Most trends begin during the London session and continue until the beginning of the New York session. 

Due to the high volume of transactions, the London session is typically the most volatile, making almost any pair tradable. However, sticking to the major pairs (EUR/USD, GBP/USD, USD/JPY, and USD/CHF) is generally best due to their tight spreads.

source: investopedia.com

New York Session 

The US session begins at 8:00 am EST (12:00 pm GMT). New York is responsible for about 17% of all Forex transactions. 

This session is also referred to as the “North American” trading session, as major financial centres like New York, Toronto and Chicago in North America are open at the same time. 

Economic reports are usually released at the start of the New York session, with 85% of all trades involving the dollar. Hence, significant US economic data releases can move the market. 

During the US and European markets’ simultaneous opening, abundant liquidity allows traders to virtually trade any pair. During the afternoon US session, volatility and liquidity tend to drop when European markets close. 

source: fxmedia.com

So, when is the best time to trade Forex?

According to the analytical reports, the most favourable trading time is around 10 am and 3 pm London time (10 am NY time) when there is optimal liquidity. This is the busiest time of day when traders from London and New York engage in trading, and it can be affected by news reports from the US, Canada, and Europe. 

Additionally, this is the time when the WM/Refinitiv Spot Benchmark Rate is set, also known as the “London fix”. Banks and financial institutions use it as a reference point for daily currency exchange rates. For traders, there may be a surge in market activity before the fixing time that abruptly disappears exactly at the fixing time. 

In general, it is recommended to trade in the middle of the week when the most action occurs. Fridays are generally busy until 04:00 pm GMT, and then the market becomes quiet until it closes at 9:00 pm GMT. 

Summary: 
  • Forex trading operates 24 hours a day, Monday to Friday. 
  • The Forex market is divided into four major trading sessions: Sydney, Tokyo, London, and New York. 
  • The market overlaps during different sessions, which are often the most active times in Forex trading. 
  • The traditional “Forex 3-session system” includes the Asian, European, and North American sessions. 
  • Tokyo session starts at 12:00 am GMT and accounts for around 20% of all Forex trading volume. 
  • London session accounts for 43% of all Forex transactions and is typically the most volatile. 
  • New York session is responsible for about 17% of all Forex transactions and is affected by significant US economic data releases. 
  • The best trading time of day is around 10 am and 3 pm London time when traders from London and New York engage in trading, and it can be affected by news reports from the US, Canada, and Europe. 
  • In general, it is recommended to trade in the middle of the week when the most action occurs. 

US Stock Futures Stable as Elon Musk Steps Down as Twitter CEO; Dow Jones Faces Fourth Consecutive Loss

US stock futures remained relatively stable on Thursday night, with the Dow Jones Industrial Average futures up 0.08%, while the S&P 500 and Nasdaq 100 futures increased by 0.12%. Elon Musk announced he would be stepping down as the CEO of Twitter, with Tesla’s shares increasing following the news.

On Thursday, the Dow Jones Industrial Average fell by over 200 points, or 0.66%, resulting in its fourth consecutive losing session. The decline was attributed to various factors, including Disney’s poor subscriber numbers and stress in the regional banking sector after PacWest Bancorp reported a drop in deposits. Investors remain concerned about a potential market downturn, despite weaker-than-expected wholesale prices data indicating easing inflation.

Investors are now waiting for preliminary consumer sentiment data and April import prices data, set to release on Friday. The Dow and S&P 500 are heading towards their second negative week in a row, while the Nasdaq Composite is on track for its third straight positive week.

Data by Bloomberg

On Thursday, the overall market experienced a slight decline of 0.17%. However, there were some sectors that performed well. Communication Services showed a positive growth of 1.65%, followed by Consumer Discretionary with a gain of 0.55% and Consumer Staples with a modest increase of 0.31%. On the other hand, several sectors saw decreases in their values. Financials declined by 0.20%, Health Care dropped by 0.34%, and Information Technology experienced a decrease of 0.45%. Industrials, Materials, Real Estate, Utilities, and Energy sectors all had larger declines, ranging from -0.65% to -1.24%.

Major Pair Movement

On Thursday, the trading market saw an increase in demand for the safe-haven currencies such as the US dollar and yen, as investors’ concerns over excess demand and inflation following pandemic reopenings faded. The yields of 10-year Treasuries declined by 4bp, due to several quarters of central bank tightening and yield curve inversion, which increased recession fears and reduced financial risk-taking. Moreover, there was an increase in demand for relatively high-yielding Treasuries and a decrease in regional banks’ pressure.

The Euro fell by 0.6%, and Sterling fell nearly 1% after the Bank of England (BoE) raised interest rates to 4.5%. However, this increase was oddly paired with higher than the previous inflation and growth forecasts, indicating the potential for a future slowdown. UK inflation remains above 10%, which is more than twice the new BoE projection. High beta and commodity-linked currencies experienced a decline due to the dollar’s risk-on rise and China demand doubts. Key risks ahead include US retail sales on Tuesday, as well as banks and the debt ceiling.


Technical Analysis

EUR/USD (4 Hours)

EUR/USD Drops to One-Month Low Amid Stronger US Dollar and Deteriorating Market Sentimen

The EUR/USD pair is heading towards its lowest daily close in a month due to a stronger US Dollar and worsening market sentiment. The pair has retreated from near 1.1100 and briefly dipped below 1.0900. The European Central Bank (ECB) Vice President, Luis de Guindos, expressed concerns about service and core inflation but did not provide any commitment on rates, while Joachim Nagel mentioned that decisions would be made on a meeting-by-meeting basis. Risk aversion benefited the US Dollar, and government bond yields rebounded during the American session.

US data indicated a slowdown in inflation and an increase in the labor market, with Initial Jobless Claims reaching the highest level since October 2021. Market sentiment will continue to be the main driver, and if concerns persist, the EUR/USD pair may experience further losses, contributing to increased volatility.

Chart EURUSD by TradingView

According to technical analysis, the EUR/USD pair is currently trending lower after reached the lower band of the Bollinger band. It is expected that the EUR/USD will continue to move lower and push the lower band. The Relative Strength Index (RSI) is presently at 37, suggesting a lower trend in the EUR/USD market.

Resistance: 1.0950, 1.0986

Support: 1.0911, 1.0881

XAU/USD (4 Hours)

Gold (XAU/USD)Prices Plunge on Surge in US Dollar and Market Sell-Off Amidst Banking Issues and US Debt Ceiling Concerns

Gold (XAU/USD)prices experienced a sharp decline on Thursday, hitting a new weekly low of $2,011.09, due to a surge in the US dollar amid a persistent dismal mood, resulting in a sell-off in the stock markets. The mood was impacted by banking issues, as the FDIC proposed extra fees for large banks to cover the $16 billion lost on the rescue of Silicon Valley Bank and Signature Bank in March. Furthermore, concerns around the US debt ceiling continued to undermine the sentiment, as Republican lawmakers are reluctant to back President Joe Biden’s plan. Additionally, government bond yields remain depressed, with the 10-year Treasury note yields at 3.38%, down 5 basis points, and the 2-year note offers at 3.86%, shedding 3 bps, due to the easing of inflation-related figures in April, as the PPI increased by 2.3% YoY.

Chart XAUUSD by TradingView

The technical analysis indicates that XAU/USD is moving lower on Thursday. The price is currently pushing the lower band of the Bollinger Band, indicating the potential for a slight lower movement for XAU/USD. Moreover, the Relative Strength Index (RSI) is currently at 38, indicating that XAU/USD is considered in bearish trend.

Resistance: $2,023, $2,036

Support: $2,010, $2,000

Economic Data

CurrencyDataTime (GMT + 8)Forecast
 GBP Gross Domestic Product 14:00 0.0%
USDMonetary Policy Summary22:0063.0
Back To Top
server

Hai 👋

Bagaimana saya boleh membantu?

Segera berbual dengan pasukan kami

Chat Langsung

Mulakan perbualan secara langsung melalui...

  • Telegram
    hold Ditangguh
  • Akan datang...

Hai 👋

Bagaimana saya boleh membantu?

telegram

Imbas kod QR dengan telefon pintar anda untuk mula berbual dengan kami, atau klik di sini.

Tidak ada aplikasi Telegram atau versi Desktop terpasang? Gunakan Web Telegram sebaliknya.

QR code