Markets Cautious with more Fed officials supporting rate hikes ahead of Jackson Hole Symposium

US stocks declined on Friday and snapped the longest weekly rally since November. Investors turned cautious and short-sellers resurfaced after Federal Reserve officials beat the drum on hiking rates. The pullback in equities this week follows a rally that has propelled the S&P500 from its mid-June nadir amid speculation that the Fed may scale back its aggressive path of rate hikes. However, more Fed officials joined the chorus of a hawkish stance in the runup to the annual symposium at Jackson Hole Aug. 25-27. Which makes a force that contributed to the rally now showing signs of fatigue, with hedge funds dialing down purchases of shares.

The benchmarks, S&P 500 and Dow Jones Industrial Average both dropped on Friday, as S&P500 notched its biggest daily decline since June, its first weekly loss in five weeks. Nine out of eleven sectors stayed in negative territory, and six of them fell more than 1% on daily basis. It’s worth noting that, the Consumers Discretion and Financials sectors performed the worst among all groups, sliding with 2.10% and 2.02% loss for the day. The Dow Jones Industrial Average fell 0.9%, the Nasdaq 100 dropped 1.9%, and the MSCI world index decreased 1.3% on Friday.

Main Pairs Movement

The US dollar surged on Friday, which posts the biggest weekly advance since April 2020.  The minutes of the July meeting suggested that the Fed will continue to raise interest rates at the next few meetings, but the pace of the rate hikes will be data-dependent, which supports the greenback. The DXY index witnessed fresh transactions since the UK trading session and edged higher to a level above 108.1.

The GBP/USD dropped with a 0.85% loss on daily basis for the day, as sentiment shifted sour after Fed’s hawkish commentary. The cables were weighted to a daily low level below 1.180 during the middle of the US trading session as the strong US dollar across the board, then oscillate in a range from 1.181 to 1.184. Meantime, EUR/USD slid to a level below 1.004. The pair decreased by 0.50% on Friday.

Gold plunged 0.66% daily for the day, with a fifth-consecutive day as market mood amid a backdrop of fear and volatility.  Although under selling pressure, XAU/USD observed fresh transactions before the US trading session and touched a daily high of $1,758 marks. However, gold then witnessed downside traction and fell to the daily low below $1,746 marks at the beginning of the US trading session.

Technical Analysis

EUR/USD (4-Hour Chart)

The EUR/USD pair declined on Friday, extending its previous slide and held lower ground near the monthly low below the 1.005 mark amid fears of German recession and geopolitical concerns. The pair is now trading at 1.0048, posting a 0.36% loss daily. EUR/USD stays in the negative territory amid a stronger US dollar across the board, as the DXY just prints new multi-week tops above the 108.00 hurdle on Friday and exerted bearish pressure on the EUR/USD pair. The hawkish comments from the Fed policymakers in recent days continued to drive flows toward safety assets like the greenback, as markets seem convinced that the Fed will stick to its policy tightening cycle amid the incoming positive US macro data. For the Euro, Germany’s Producer Price Index (PPI) for July came at 5.3% MoM, which is higher than markets’ expectations.

For the technical aspect, RSI indicator is 24 as of writing, suggesting that the pair might witness some upside correction as the RSI stays in the oversold zone. As for the Bollinger Bands, the price continued to move alongside the lower band, therefore the downside traction should persist. In conclusion, we think the market will be bearish as long as the 1.0082 resistance line holds. But the pair could see some short-term correction before edging lower amid the oversold RSI.

Resistance:  1.0082, 1.0111, 1.0188

Support: 1.0111, 0.9991

GBP/USD (4-Hour Chart)

The GBP/USD pair tumbled on Friday, coming under heavy selling pressure and dropped to a monthly low below 1.1840 level in the US trading session amid renewed US dollar strength. At the time of writing, the cable stays in negative territory with a 0.88% loss for the day. The prospects for further rate increases by the Fed and the prevalent risk-off mood both acted as a headwind for the GBP/USD pair, as the US central bank is expected to stick to its policy tightening path due to recent comments by several Fed officials. For the British pound, the better-than-expected UK Retail Sales rose 0.3% in July but failed to provide bullish strength to the cable, which is being weighed by the Bank of England’s gloomy economic outlook and a possible recession that would start in the fourth quarter.

For the technical aspect, the RSI indicator is 30 as of writing, suggesting that the pair could stage a correction before extending its slide as the RSI dropped below 30. As for the Bollinger Bands, the price preserved its downside traction and move alongside the lower band, therefore a continuation of the downtrend can be expected. In conclusion, we think the market will be bearish as the pair is testing the 1.183 support. A break below that level could drag the pair toward the next support at 1.1780.

Resistance: 1.1922, 1.2050, 1.2119

Support: 1.1830, 1.1780

XAU/USD (4-Hour Chart)

Gold price declined to $1,750 during the European trading hours on Friday. Price continually slumped to below $1,750 in the US session after managing to erase its losses in the late EU session. With the 10-year US Treasury bond yield rising on the trade of the day and a stronger US dollar, the gold price seems hard to gather bullish momentum. Any further advance is taken as a selling opportunity by investors now.

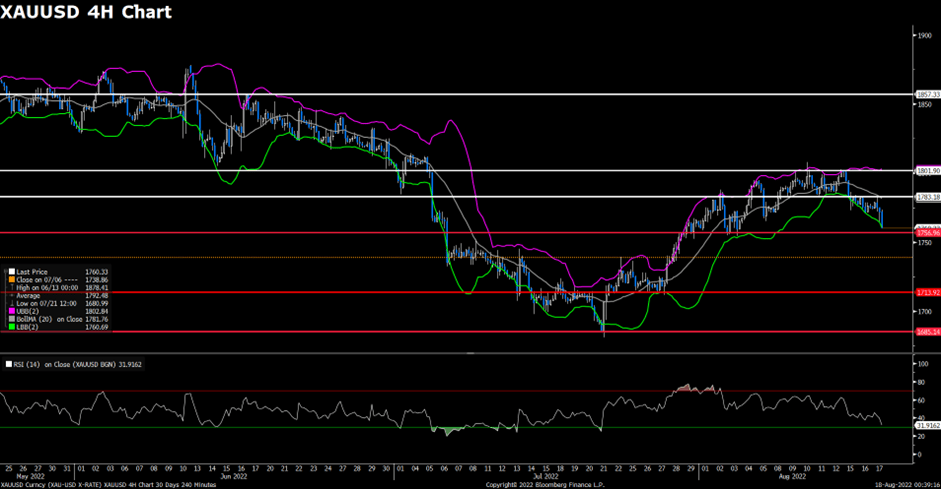
From a technical aspect, the gold price drops below the $1,757 support level, and it turns out to be the pressure level to the upside. RSI indicator is 32 as of writing, suggesting downside momentum.  As for the Bollinger Bands, the price tumbled along with the lower bound, staying right above it rather than dropping into the oversold zone, which means a decline before is acceptable and further decline to the downside could be expected. In conclusion, the gold price has dropped below the previous support zone at $1,757 and failed to regain the losses. The price could head to the next pivotal support zone for gold at the $1,714 level, which is the most possible path for gold price from technical analysis.

Looking ahead, in absence of any top-tier US economic events, the repricing of Fed expectations will play a key role in the gold price action. For more price action, all eyes now turn towards the Fed’s Jackson Hole Symposium this week.

Resistance: $1,757, $1,783, $1,803

Support: $1,714, $1,685

Economic Data

CurrencyDataTime (GMT + 8)Forecast
CNYPBoC Loan Prime Rate21:152.75%

VT Markets TSLA股票分割调整通知

尊敬的用户:

您好!

特斯拉公司即将在 2022 年 08 月 25 日 进行股票分割。
届时,特斯拉公司的股票(TSLA)将会以分割后的合约提供投资者交易。

股票分割的客户须知 :

1. 每个客户的TSLA持仓量将变为 3 倍。

2. 所有TSLA仓位的「开仓价格」与「止盈 / 止损设置价格」将会在股票分割后,变为原始价格的 3 分之 1。

3. 分割 / 拆分后的TSLA报价将大约落在 08 月 24 日收盘价格的 3 分之 1。

4. 股票分割时,所有的TSLA挂单设置将会被取消。

5. 「模拟账户」内所有的TSLA仓位将会因股票分割而关闭。

注意:以上数据仅供参考,实际执行数据有可能会有变动,具体请依据 MT4/MT5 软件为准。

您可能想知道更多有关股票分割的详情?

更多详情有关股票分割,请浏览以下文章:
https://helpcentre.vtmarkets.com/hc/zh-cn/articles/8597160316697

如您有任何疑问,我们的团队将十分乐意为您解答。
请留言或发邮件至 [email protected] 或联系在线客服。

VT Markets 服务器升级维护通知

尊敬的用户:

您好!

VT Markets 致力于为客户提供更快速且稳定的交易环境,我们将于周末进行服务器(MT4/MT5) 升级维护。

维护时段: 2022 年 08 月 20 日 (星期六) 18:00 至 23:00

上述时段采用 GMT+8 时区

请您务必留意下列事项:

本周末维护期间,客户仍可照常参与交易

产品报价的稳定及市场流动性将可能受影响而降低,我们建议客户谨慎操作。

望您谅解因此次升级维护为您所带来的不便,我们将继续为您提供更优质的服务。

如您有任何疑问,我们的团队将十分乐意为您解答。
请留言或发邮件至 [email protected] 或联系在线客服。

Weekly Jobless Claims Fell, Strength Demand in Labour?

US stocks edged higher on Thursday, as mixed economic and earnings reports failed to spark a broad conviction trade.  The weekly jobless claims data fell for the first time in three weeks, a sign of strength in demand for labour, while a gauge of manufacturing activity in the Philadelphia area unexpectedly expanded in August. Meantime, following the equity rally from June lows, sentiment turned fragile Wednesday after the Fed minutes signalled inflation-busting rate hikes will continue despite a weakening economy. Further clues for policy makers’ views may come at the Fed’s annual symposium in Jackson Hole, Wyoming next week.

The benchmarks, both S& P500 and Nasdaq 100 advanced after swinging between modest gains and losses on Thursday. Seven out of eleven sectors of S& P500 stayed in the positive territory, as Energy got the best performance among all groups, which rose 2.53% on daily basis, while Real Estate underperformed and slid 0.75% for the day as existing-home sales fell for six straight months, indicating housing market’s rapid decline. The Dow Jones Industrial Average was little changed, the Nasdaq 100 rose 0.3%, and the MSCI World index was little changed on Thursday.

Main Pairs Movement

US dollar surged on Thursday, as Federal Reserve officials spoke of the need for further rate hikes, and investors need to reevaluate minutes from the US central bank’s July meeting on Wednesday as being more hawkish. The DXY index gained bullish momentum during the US trading session and broke through to a month-high level above 107.5 amid a cautious market mood.

The GBP/USD dropped 0.98% on Thursday, as the strong US dollar across the board was caused by the hawkish speech from Fed officials. The safe-haven greenback has witnessed strong transactions weighting the cables since the US trading session, and the pair touched nearly a month-low level below 1.193. Meanwhile, EUR/USD holds lower ground after refreshing its monthly bottom the previous day and fell to a level below 1.008 at the end of the day. The pair dropped 0.91% daily on Thursday.

Gold slid with a 0.18% loss for the day, as a four consecutive days decline. With hawkish Fed speech and fears surrounding China’s recession exert downside pressure. XAU/USD observed fresh tractions during the UK session and touched a daily-high level above $1,772 marks, but then lost upward momentum and dropped to a level below $1,760 marks during the US trading session. WTI and Brent oil surged on Thursday, rising 2.71% and 3.09% respectively.

Technical Analysis

EURUSD (4-Hour Chart)

The EUR/USD pair declined on Thursday, being surrounded by bearish pressure and dropped to a daily low below 1.012 level at the start of the US session amid the risk aversion market environment. The pair is now trading at 1.0134, posting a 0.42% loss daily. EUR/USD stays in the negative territory amid renewed US dollar strength, as the better-than-expected US macro data provide some support to the safe-haven greenback and dragged the EUR/USD lower. The US Weekly Initial Jobless Claims declined to 250K and came in lower than the market expectation of 265K, which underpinned the expectations that the Fed would continue to tighten its monetary policy. For the Euro, the Eurozone inflation arrives at 8.9% YoY in July, meeting the market’s estimates. But the energy supply-related concerns keep being a key factor acting as a headwind for the shared currency.

For the technical aspect, the RSI indicator is 31 as of writing, suggesting that the pair is facing heavy selling pressure as the RSI is approaching the oversold zone. As for the Bollinger Bands, the price has moved out of the lower band so a strong downside trend continuation can be expected. In conclusion, we think the market will be bearish as the pair is testing the 1.0111 support. A break below that level could confirm the bearish bias in the near term and drag the pair lower toward 1.0062.

Resistance:  1.0188, 1.0246, 1.0287

Support: 1.0111, 1.0062, 0.9991

GBPUSD (4-Hour Chart)

The GBP/USD pair tumbled on Thursday, extending its previous slide and refreshing its daily low below the 1.200 mark heading into the US trading session amid a souring market mood. At the time of writing, the cable stays in negative territory with a 0.49% loss for the day. The hawkish commentary from Fed’s official helped the safe-haven Dollar to find demand, as San Francisco Fed President Mary Daly reiterated that it was way too early to declare victory on inflation in an interview with CNN on Thursday. She also said that either 50 bps or a 75 bps hike would be appropriate. For the British pound, the currency remained under pressure despite the hotter-than-expected UK CPI data, as investors now speculate that an economic downturn might force the BoE to adopt a gradual approach to raising interest rates.

For the technical aspect, the RSI indicator is 30 as of writing, suggesting the pair’s bearish outlook in the near term as the RSI is reaching the oversold zone. As for the Bollinger Bands, the price witnessed heavy selling pressure and dropped below the lower band, therefore the downside traction should persist. In conclusion, we think the market will be bearish as the pair is heading to test the 1.1940 support. Additional losses toward 1.1897 could be witnessed if the pair break below the aforementioned support.

Resistance: 1.2071, 1.2119, 1.2188

Support: 1.1940, 1.1897, 1.1830

XAUUSD (4-Hour Chart)

Gold gains some positive traction on Thursday, but immediately declined back to the $1,760 level. A stronger US dollar is still weighing on Gold prices.

The dollar surged to a fresh monthly high on firm expectations that the Federal Reserve will continue to tighten monetary policy. Although the FOMC minutes released on Wednesday did not hint at a specific pace of future rate hikes, still show that policy makers remained committed to raising rates to tame inflation, which still supported bullish sentiment around the US dollar.

For the technical aspect, the RSI is 33 as of writing, are still in bearish mode but not reaching the oversold zone. As for the Bollinger Bands, the gold price keeps moving between the moving average and lower bound, forming a clear downward tunnel. The price seems to test support above the $1,757 level. If the price closes with negative price action below the $1,757 level on the 4H chart, it might head to test the next support level at the $1,714 level.

In conclusion, the fundamental background suggests that the most likely path for gold is to the downside. Even from a technical perspective, the recent positive moves are still seen as selling opportunities by investors, gold price, therefore, declined downward on the 4H Chart and hardly gained positive traction. We think the market is still bearish as fundamental background and technical analysis both support downward traction. Now, investors are looking forward to the US economic data, seeking broader risk sentiment which could provide clear direction and fresh momentum for gold prices.

Resistance: $1,783, $1,803, $1,857

Support: $1,757, $1,714, $1,685

Economic Data

CurrencyDataTime (GMT + 8)Forecast
GBPRetail Sales (MoM) (Jul)14:00-0.2%
CADCore Retail Sales (MoM) (Jun)20:300.9%

The Fed’s Rate hikes to Control Inflation Weighed on the Market Sentiment

US stocks declined for the first time in four days as investors assessed the outlook for the path of interest-rate hikes after a minute of Federal Reserve’s last meeting noted officials saw risks from tightening more than necessary. Moreover, the stock market rallied on signs of peaking inflation and an earnings reporting season that saw four out of five companies meeting or beating estimates. However, prospects of the Fed continuing to raise rates to cool inflation and tip the economy into recession have weighed on market sentiments.

The benchmarks, both S&P 500 and Dow Jones Industrial Average slid on Wednesday, as Fed minutes note it may be appropriate to slow increases. Ten out of eleven sectors of S&P 500 stayed in the negative territory, as Communication Service and Material sectors performed worst among all groups, falling 1.40% and 1.85% on daily basis respectively. Energy is the only section in positive territory, rose with a 0.81% gain for the day. The Dow Jones Industrial Average decreased 0.5%, the Nasdaq 100 dropped 1.2%, and the MSCI World index fell 0.6% on Wednesday.

Main Pairs Movement

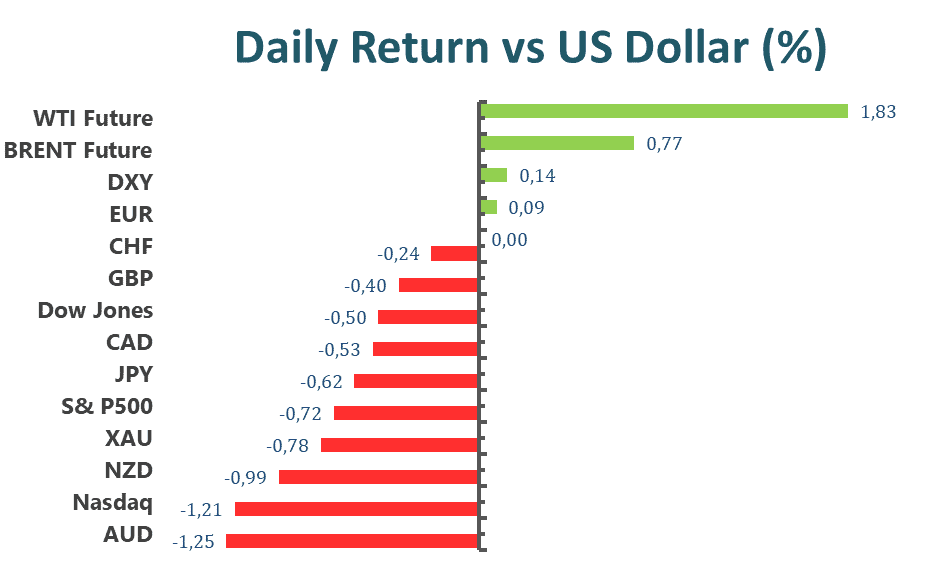
The US dollar little advanced on Wednesday, as the minutes from Federal Reserve’s July meeting, showed that Fed officials are concerned the US central bank could raise interest rates too far as part of its commitment to get inflation under control. The DXY index witnessed fresh transactions during the UK trading session and touched a daily high level of nearly 106.9 level, however, paring most gains and reached a daily low level below 106.4 after the FOMC minute.

The GBP/USD dropped with a 0.40% loss on daily basis after a volatile day, as UK’s 40-year high inflation propelled recession woes and the minute of the Federal Reserve. The cables were under heavy selling pressure during the UK trading session amid a pessimistic market mood towards economic growth. However, GBP/USD rebounded after the Fed minute and oscillate around the 1.2045 level. Meanwhile, EUR/USD touched a daily-high level above 1.020 after the minute by Fed. The pair rose 0.09% for the day.

Gold dropped on Wednesday, and remains under pressure around a two-week low, down for the fourth consecutive day. XAU/USD edged lower since the UK trading session as a strong greenback across the board and touched a daily low below $1,760 in the middle of the US trading session.
WTI and Brent oil advanced for the day, rising 1.83% and 0.77% respectively.

Technical Analysis

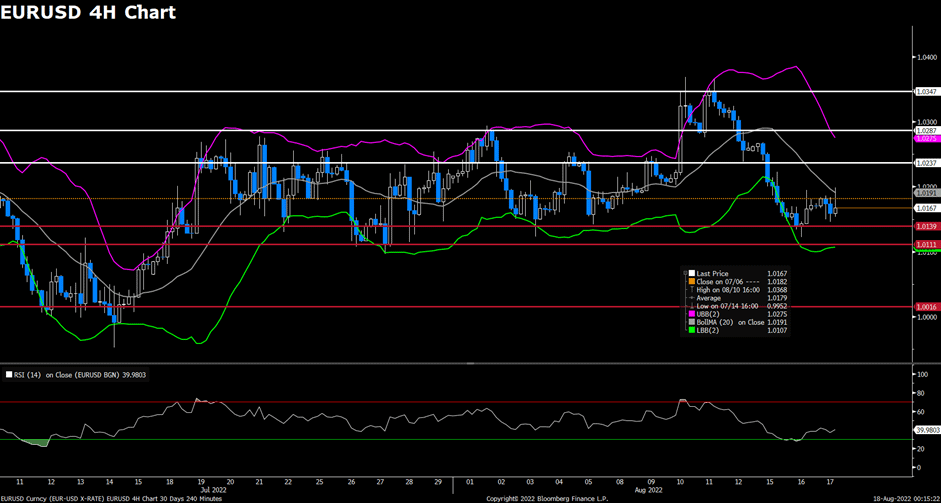
EURUSD (4-Hour Chart)

The EUR/USD pair edged lower on Wednesday, remaining under pressure and surrendered most of its daily gains after touching a daily high above the 1.019 mark amid a soured market mood. The pair is now trading at 1.0164, posting a 0.08% loss daily. EUR/USD stays in the negative territory amid renewed US dollar strength, as global stocks turned sharply lower ahead of the release of the latest FOMC Meeting Minutes and lend support to the safe-haven greenback. The US Retail Sales stay unchanged in July and came in slightly weaker than the market expectation of +0.1%, which failed to provide impetus to the markets as the focus now shifts to FOMC minutes. For the Euro, the Eurozone GDP expanded by 0.6% QoQ in the second quarter of this year, but the markets react little to the economic data.

For the technical aspect, the RSI indicator is 39 as of writing, suggesting that the downside is more favoured as the RSI stays below the mid-line. As for the Bollinger Bands, the price retreated and failed to cross above the moving average, therefore some downside traction can be expected. In conclusion, we think the market will be bearish as the pair might head to test the 1.0139 support. The risk is also skewed to the downside as the pair is developing below all of its moving averages.

Resistance: 1.0237, 1.0287, 1.0347

Support: 1.0139, 1.0111, 1.0016

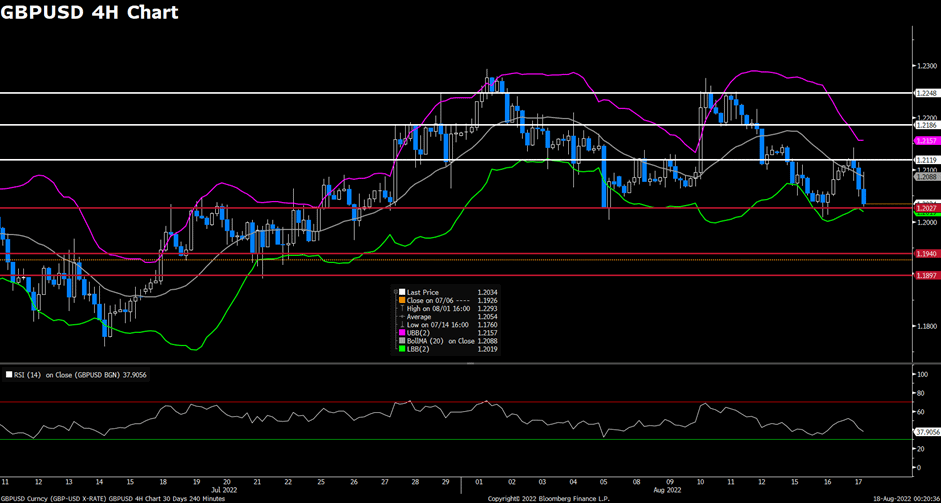
GBPUSD (4-Hour Chart)

The GBP/USD pair declined on Wednesday, failing to preserve its upside traction that was witnessed earlier in the Asia session and refreshed its daily low below 1.205 level ahead of FOMC meeting minutes. At the time of writing, the cable stays in negative territory with a 0.53% loss for the day. The speculations that the Fed would stick to its policy tightening path have been fueled by the recent hawkish remarks by several Fed officials. On top of that, the rising US Treasury bond yields also helped the US dollar to find demand and undermined the GBP/USD pair. For the British pound, the UK Consumer Prices Index (CPI) rose to 10.1% YoY in July, which came in hotter-than-expected but failed to provide strong support to the cable as the US economic data have lifted bets for a larger Fed rate hike move at the September meeting.

For the technical aspect, the RSI indicator is 37 as of writing, suggesting the pair’s bearish outlook in the near term as the RSI keeps heading south. As for the Bollinger Bands, the price witnessed fresh selling and dropped toward the lower band, therefore a continuation of the downside trend can be expected. In conclusion, we think the market will be bearish as the pair is testing the 1.2027 support. A break below that level could open the door for additional losses and the falling RSI also reflects bear signals.

Resistance: 1.2119, 1.2186, 1.2248

Support: 1.2027, 1.1940, 1.1897

XAUUSD (4-Hour Chart)

Gold slumps below $1,770 on Wednesday, dropping to its two weeks low. Rising yields and a stronger US dollar are weighing on the gold price. The benchmark 10-year US Treasury bond yield is up nearly 3% on the trade of the day, forcing XAU/USD to come under more bearish pressure.

For the technical aspect, XAU/USD drifts in negative for the third successive day forming a clear downward trend and slumps below the $1,770 level in the European session. The price continued to drop in the early US session. At the time of writing, the price is $1,760 level testing the support level at $1,757. The RSI indicator is 33 as of writing, suggesting that the price is still under downside pressure. For the Bollinger Bands, the price tumbled but still maintained slightly above the lower bound, indicating that the price is not yet dropped below oversell zone. In conclusion, we think the market is still in bearish mode as the RSI indicator keeps in a downtrend and the price keeps edging low.

Markets are now pricing in at least a 50 bps rate hike at the September FOMC meeting. As such, clues about the possibility of a larger 75 bps move will play a key role in influencing the recent USD price and determining the next move for gold. For more price action, eye on the tier 1 US economic data.

Resistance: 1783, 1803, 1857

Support: 1757, 1714, 1685

Economic Data

CurrencyDataTime (GMT + 8)Forecast
AUDEmployment Change (Jul)09:3025.0k
EURCPI (YoY) (Jul)17:008.9%
USDInitial Jobless Claims20:30265k
USDPhiladelphia Fed Manufacturing Index (Aug)20:30-5.0
USDExisting Home Sales (Jul)22:004.89M

VT Markets 新产品上线通知

尊敬的用户:

您好!

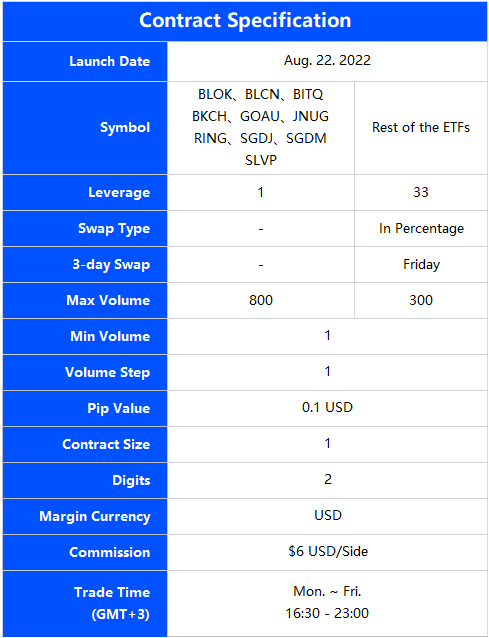
VT Markets 为进一步丰富广大客户的投资选择,我们预计将于 2022 年 08 月 22 日 (周一) ,MT5 服务器上新增51只ETF产品。

新产品交易细则如下:

注意:以上数据仅供参考,实际执行数据有可能会有变动,具体请依据MT4/MT5软件为准。

温馨提醒:
1. 此次上新产品仅限于 MT5 上可交易。
2. 其他交易细则请至 MT5 软件查看各产品规格。
3. 因市场风险因素,部份产品只开放交易多单。

此次上线的新产品,将更好地满足广大客户对产品多元化的需求。
未来,VT Markets 将会持续更新产品列表,致力于产品优化、技术革新、服务创新等全方位提供客户崭新良好的投资体验。

如您有任何疑问,我们的团队将十分乐意为您解答。
请留言或发邮件至 [email protected] 或联系在线客服。

Sudden Pullback in Tech Shares, US Stocks Move Higher

US stocks advanced on Tuesday, and closed higher following a sudden pullback in tech shares, as investors assessed the latest round of upbeat earnings against a backdrop of growing concerns over slowing growth and rising borrowing costs. Moreover, reports Monday indicating a sharp drop in New York state manufacturing along with the longest streak of declines since 2007 in homebuilder sentiment sparked optimism in equity markets that the Fed may slow interest rates hike. A critical clue on how sensitive the Fed is to unfolding economic data may be known when the minutes of the last meeting of the Federal Open Market Committee on Wednesday.

The benchmarks, S&P 500 and Dow Jones Industrial Average both edged higher on Tuesday. Six out of eleven sectors stayed in the positive territory, as Consumer Staples and Consumer Discretion performed best among all groups, rising with 1.21% and 1.09% gains on daily basis. The Dow Jones Industrial Average kept its leadership role within major benchmarks, rallying 0.7% for the day. The Nasdaq 100 ended lower, sliding 0.2%, and the MSCI World index was little changed on Tuesday.

Main Pairs Movement

The US dollar was little changed down on Tuesday, as investors waited on the US retail sales and minutes from the Federal Reserve’s July meeting on Wednesday. The DXY index witnessed fresh transactions and edged higher as recession fears boost the safe-haven greenback during the UK trading session. However, after touching a daily level above 106.9, DXY lost bullish momentum and pullback to oscillate in a range from 106.3 to 106.6 level.

The GBP/USD advanced with a 0.34% gain on a daily basis for the day, as UK employment figures were better-than-expected, further cementing the case for a 50 bps BOE rate hike. The cables suffered heavy selling pressure during the UK trading session as US dollars strengthen across the board. Then, GBP/USD rebounded and touched a daily high level above 1.211 during the early US trading session. Meanwhile, EUR/USD reached a daily high level above 1.019 in the period of the early US trading session. The pairs rose 0.11% on Tuesday.

Gold slid with a 0.23% loss on a daily basis for the day, holding lower ground near one week after a two-day downtrend. Investors were cautious as fears of the economic slowdown in China and Europe and waited for a clue on Fed’s decision to interest rates hike shown when FOMC meeting happens on Wednesday. Meantime, WTI and Brent oil dropped on Tuesday, falling 2.90% and 3.22% respectively.

Technical Analysis

EURUSD (4-Hour Chart)

The EUR/USD pair edged higher on Tuesday, ending its previous slide and regained upside momentum to touch a daily top near the 1.019 mark despite the prevalent cautious market mood. The pair is now trading at 1.0174, posting a 0.16% gain daily. EUR/USD stays in the positive territory amid a weaker US dollar across the board, as the disappointing Housing Starts data from the US exerted bearish pressure on the safe-haven greenback and lifted the EUR/USD pair higher. The US Housing Starts decline sharply by 9.6% in July and Building Permits also dropped by 1.3% MoM, causing the US dollar to lose some strength. For the Euro, the German ZEW Economic Sentiment Index came in at -55.3 in August, which showed that the economic sentiment continued to deteriorate in the euro area and limit the upside for the shared currency.

For the technical aspect, the RSI indicator is 37 as of writing, suggesting the pair’s bullish outlook in the near term as the RSI keeps rising toward the mid-line. As for the Bollinger Bands, the price regained upside traction and started to climb toward the moving average, therefore the upside momentum should persist. In conclusion, we think the market will be bullish as long as the 1.0111 support line holds. On the upside, a break above 1.0237 could lead to additional gains for the pair.

Resistance:  1.0237, 1.0287, 1.0347

Support: 1.0111, 1.0062, 0.9988

GBPUSD (4-Hour Chart)

The GBP/USD pair advanced on Tuesday, witnessing some upside traction and climbed to a daily top above 1.211 level during the US trading session after the release of downbeat US housing data. At the time of writing, the cable stays in positive territory with a 0.30% gain for the day. Traders might prefer to move on the sidelines ahead of the FOMC meeting minutes on Wednesday, which could provide clues about the possibility of a 75 bps rate hike in September. For the British pound, the mixed UK employment data fail to impress bullish traders as the number of people claiming unemployment-related benefits fell by 10.5K in July and the UK unemployment rate was unchanged at 3.8%. On top of that, the concerns about a global economic downturn and the BoE’s gloomy economic outlook both limit the gains for the GBP/USD pair today.

For the technical aspect, the RSI indicator is 44 as of writing, suggesting that the risk is skewed to the upside as the RSI has climbed further toward the mid-line. For the Bollinger Bands, the price preserved its bullish movement and kept heading toward the moving average, therefore a continuation of the upside trend can be expected. In conclusion, we think the market will be bullish as long as the 1.2027 support line holds. The rising RSI also reflects bull signals.

Resistance: 1.2143, 1.2248, 1.2277

Support: 1.2027, 1.1940, 1.1897

XAUUSD (4-Hour Chart)

Gold price continued the trend of yesterday coming under bearish pressure on the trade of the day and declined toward the $1,770 level. Despite last week’s softer US CPI report, Fed officials warned that it is far too early for the US central bank to declare victory on inflation. Suggesting that the Fed would stick to its policy and have maintained a hawkish tone. The benchmark 10-year US Treasury bond yield is up more than 2% on the day. supporting the US dollar. This, in turn, undermines the dollar-denominated commodity. That said, traders might refrain from placing aggressive bets ahead of the key central bank event ­ — the FOMC minutes on Wednesday. For more price actions, eye on the tier 1 economic data from the US.

For the technical aspect, the RSI indicator is 42 as of writing, suggesting that the downside is more favoured as the RSI keeps in a downtrend and stays below the mid-line. For the Bollinger Bands, the price edged slightly down along with the lower bound, and the downward moving average seems to take pressure from the upside. In conclusion, we think the market will be bearish as the RSI indicator keeps in a downtrend and the price keeps edging lower below the moving average. At the time of writing, the price is slightly above the $1,770 level. If XAU/USD closes with negative price action below $1,770 on the four-hour chart, it might head to test the next support level at $1,757.

Resistance: 1803, 1857, 1876

Support: 1770, 1757, 1714

Economic Data

CurrencyDataTime (GMT + 8)Forecast
NZDRBNZ Interest Rate Decision10:003.00%
NZDRBNZ Press Conference11:00 
GBPCPI (YoY) (Jul)14:009.8%
USDCore Retail Sales (MoM) (Jul)20:30-0.1%
USDRetail Sales (MoM) (Jul)20:300.1%
USDCrude Oil Inventories22:30-0.275M

US Stocks Rallied for the Second Day

The US stocks rallied for the second day in a row, as investors digested weak data on New York manufacturing and the Chinese economy. The market is coming off a fourth straight weekly gain, the longest run this year, with sentiment buoyed by signs of slowing inflation pressures that stirred hopes of a shift by the Fed to less hawkish rate hikes and a gradual slowdown in the economy. Still, the rally has left market breadth looking stretched with stocks vulnerable to a pullback. Meanwhile, data showed China’s July retail sales, investment and industrial output missed economists’ estimates, and in the Eurozone, the risk of recession has reached the highest level since November 2020.

The benchmarks, S&P500 and Dow Jones Industrial Average both advanced on Monday. The S&P500 closed near the highs of the day, reversing losses of as much as 0.5%, with nine out of eleven sectors staying in the positive territory. Moreover, the Consumer Staples sectors got the best performance among all groups, rising with a 1.05% gain on daily basis, while Energy slid with 1.98% losses for the day, performing the worst. The Dow Jones Industrial Average rose 0.4%, Nasdaq 100 increased 0.7% as big tech-led gains, and the MSCI world index moved up 0.2%.

Main Pairs Movement

US dollar edged higher on Monday, benefiting its haven status, while the Chinese yuan dipped after a batch of disappointing data prompted the country’s central bank to cut interest rates. The DXY index surged unstoppably and closed near a daily high above 106.4 for the day.

The GBP/USD slid for the day, as market mood amid undermining risk sentiment and provided a boost to the safe-haven greenback. The cables witnessed heavy selling pressure at the beginning of this week and closed near a daily-low level of 1.205. Meanwhile, EUR/USD was also under bearish momentum and dropped to a level below 1.016. It’s worth noting that investors prefer to pile onto the greenback ahead of Wednesday’s FOMC minute showdown, which may reveal some clues to the next move by Fed officials.

Gold dropped by 1.26% on a daily basis on Monday, as China data triggers risk-aversion and investors resort to selling everything amid a pessimistic market mood. XAU/USD was driven by bearish momentum almost all the day and fell from $1802 to $1780 marks. Moreover, WTI and BRENT oil declined with 2.91% and 4.53% losses on a daily basis respectively.

Technical Analysis

EURUSD (4-Hour Chart)

The EUR/USD pair tumbled on Monday, extending its slide that started last week and dropped to a daily low below the 1.020 mark amid the risk-averse market environment. The pair is now trading at 1.01935, posting a 0.62% loss daily. EUR/USD stays in the negative territory amid a stronger US dollar across the board, as the poor results from the Chinese docket earlier in the session underpinned the safe-haven greenback and dragged the EUR/USD pair lower. The weaker-than-expected Industrial Production in China rose by 3.8% in July, indicating signs of slowing economic activity in the country and escalating concerns about recession. For the Euro, the German energy crisis continued to be the main factor of the fears about the Eurozone recession, which might act as a headwind for the shared currency.

For the technical aspect, the RSI indicator is 33 as of writing, suggesting that the pair is facing heavy bearish pressure as the RSI drops toward 30. As for the Bollinger Bands, the price preserved its downside traction and moved alongside the lower band, therefore the downside momentum should persist. In conclusion, we think the market will be bearish as the pair is heading to test the 1.0150 support line. The near-term outlook stays bearish as the technical indicators have extended their declines to negative levels.

Resistance:  1.0287, 1.0347, 1.0430

Support: 1.0150, 1.0111, 0.9988

GBPUSD (4-Hour Chart)

The GBP/USD pair declined on Monday, coming under selling pressure and refreshed its daily low near the 1.206 mark during the European session as the US dollar continues to capitalize on safe-haven flows at the beginning of the week. At the time of writing, the cable stays in negative territory with a 0.46% loss for the day. The US Dollar Index extended its rally toward the 106.00 area as the escalating geopolitical tensions between the US and China and weak data releases from China both helped the safe-haven greenback to find demand. For the British pound, the latest news on Monday reported that 30 of 51 economists expect the Bank of England to hike the policy rate by 50 bps at its September meeting in a recently conducted survey, but the news failed to lift the GBP/USD pair higher today.

For the technical aspect, the RSI indicator is 39 as of writing, suggesting that the downside is more favoured as the RSI stays below the mid-line. For the Bollinger Bands, the price regained the downside traction and dropped toward the moving average, therefore a continuation of the downside trend can be expected. In conclusion, we think the market will be bearish as the pair might head to test the 1.2027 support. The RSI also reflects bear signals and confirms the lack of buyers’ interest in the British pound.

Resistance: 1.2178, 1.2248, 1.2309

Support: 1.2027, 1.19400, 1.1897

XAUUSD (4-Hour Chart)

The XAU/USD pair fell on Monday amid a risk-aversion mood. The price declined toward the $1,780 level in the European session, having struggled around $1,800 earlier in the Asian session. The risk-off market remains still after China’s activity came in below forecasts. In addition, an unexpected rate cut by PBOC fueled fears over a slowdown of the world’s second-largest economy, therefore making the safe-haven US dollar more attractive. Investors seek safety in the US dollar amid market panic as US-China tension remains. The key event risk this week is Wednesday’s FOMC minutes, which could set a clear direction for gold prices if it tells the Fed’s future policy path.

For the technical aspect, the RSI indicator is 41 as of writing, suggesting that the downside is more favoured as the RSI stays below the mid-line. For the Bollinger Bands, the price dropped below the moving average, the downside traction should persist. In conclusion, we think the market will be bearish as the RSI indicator stands at 41 and the price drops below the moving average. The price might head to test the next support level at 1769. For more price action, eyes on the next support level.

Resistance: 1803, 1857, 1874

Support: 1769, 1757, 1714

Economic Data

CurrencyDataTime (GMT + 8)Forecast
AUDRBA Meeting Minutes09:30 
GBPAverage Earnings Index +Bonus (Jun)14:004.5%
GBPClaimant Count Change (Jul)14:00-32.0K
EURGerman ZEW Economic Sentiment (Aug)17:00-53.8
USDBuilding Permits (Jul)20:301.650M
CADCore CPI (MoM) (Jul)20:30 

Market Outlook – Interesting week ahead for Australia, New Zealand, and Canada

The economic data from Australia, New Zealand, and Canada will be interesting this week. The markets are looking forward to the release of Australia’s Employment Data on 18 August 2022, which will provide an insight into whether the country’s jobs market is in good shape. 

In addition, the Reserve Bank of New Zealand’s Rate Statement will be released on 17 August 2022, which could give investors a clue about how much rates would rise if inflation remains high.

Image source: forexfactory.com 

Australia’s Monetary Policy Meeting Minutes | 16 August 2022

This month, the Reserve Bank of Australia (RBA) raised the cash rate by 50 basis points (bps) to 1.85% — the third consecutive hike since June 2022. The last time the cash rate was this high was in April 2016.

The bank believes inflation will return to its target level while paying attention to the global outlook, which remains clouded by geopolitical tensions in Ukraine and its potential effect on energy and commodity prices as well as China’s zero-COVID policy.

Canada’s Consumer Price Index | 16 August 2022

The Consumer Price Index (CPI) in Canada increased 0.7% in June of 2022, according to Statistics Canada. The CPI is one of the many indicators that Canadian analysts use to assess the health of the domestic economy and the likelihood that the Bank of Canada might raise interest rates. 

Analysts forecast that Canada’s CPI for July would be slower at 0.1%.

Reserve Bank of New Zealand Rate Statement | 17 August 2022

The Reserve Bank of New Zealand will release its cash rate decision on Wednesday, 17 August 2022. 

The Reserve Bank of New Zealand’s most recent interest rate hike will push up the official cash rate to a level not seen since March 2016. The central bank raised its benchmark rate by 50 bps to 2.5%. According to the bank’s statement, it would continue to tighten policy until it was sure that monetary conditions were sufficient to cool inflation and bring it in line with the target range of 1-3%. Acknowledging medium-term downside risks to economic activity, policymakers said they were aware that the global economic outlook had weakened amid ongoing supply issues, geopolitical tensions, and health curbs in China. 

UK’s Consumer Price Index | 17 August 2022

The CPI in the UK increased 0.8% in June over the previous month. The CPI data is a key indicator to measure inflation in that country. 

Analysts forecast that UK CPI for July would be slower at 0.4%.

US Retail Sales | 17 August 2022

Retail sales in the US rose 1% in June of 2022, edging up from a 0.1% decline in May and beating forecasts of 0.8% growth. The jump reflects robust consumer spending but also marks an increase in prices for goods and services.

July forecasts for retail sales will be higher by 0.2%.

FOMC Meeting Minutes | 18 August 2022

In its July 2022 statement, the Federal Reserve raised the target range for the fed funds rate by 75 bps to 2.25%-2.5% and indicated that it would continue to increase rates as long as projected inflation remains in line with or below its target of 2%. 

Fed Chair Jerome Powell said he was unable to predict what the target range for next year’s fed funds rate might be, but that he expected rates to increase moderately over the course of the rest of this year.

Australia’s Employment Data | 18 August 2022

In June 2022, employment in Australia jumped sharply to a fresh record high of 13.6 million while unemployment fell to a fresh record low of 3.5%. Forecasters expect the unemployment rate to fall further, to 3.6%, while employment is expected to grow by another 25,000.

The Australian economy has been going through a rough patch over the past few years, but it looks like things are now turning around with this recent boost from employment data.

With a slowdown in Inflation, will Fed Ease Monetary Policy?

US stock rallied on Friday, with investors assessing whether an inflation slowdown could soon make the Federal Reserve reduce the pace of its most-aggressive tightening campaign in decades and prevent a hard landing. The next few weeks will be crucial in determining the sustainability of the rally. As the earnings season is almost over, economic reports are mixed at best and many Fed speakers are unwilling to sound too dovish. Apart from that, data Friday indicated that US consumer sentiment climbed to a three-month high on firmer expectations about the economy and personal finances. Inflation expectations were mixed, with consumers boosting their long-term views for prices slightly while reducing their year-ahead outlook for costs.

The benchmarks, S&P500 and Dow Jones Industrial Average both advanced on Friday, as S&P500 had a fourth straight week of gains, the longest such run since November. All eleven sectors stayed in positive territory, with Consumer Discretion, Information Technology, and Communication Service performing the best among all groups, rising 2.30%, 2.07%, and 2.02% respectively. Dow Jones Industrial Average rose 1.3%, Nasdaq 100 surged by 2.1% on daily basis, and the MSCI World index increased 1.1%.

Main Pairs Movement

US dollar advanced with a 0.56% gain on daily basis on Friday, as U.S. import prices declined for the first time in seven months on lower costs for both fuel and non-fuel products in the third report this week to hint inflation may have topped out. The DXY index witnessed fresh transactions and touched a daily high level above 105.8 during the US trading session, then lost bullish momentum and closed around the 105.7 level.

GBP/USD declined with a 0.55% loss on daily basis for the day, amid a strong pickup in USD demand. Moreover, the Preliminary GDP report showed that the UK economy contracted by 0.1% in Q2 as compared to the 0.8% rise in the previous quarter. Under such pressures, the cables dropped from 1.220 level to a level around 1.210 ahead of the US trading session. Meanwhile, EURUSD dropped and touched a daily low level below 1.024, and the pair fell 0.59% on Friday.

Gold rallied with a 0.71% gain on daily basis for the day, amid an upbeat market mood due to lower US inflation data. The XAUUSD observed fresh upward tractions and reached a daily -high level above $1802 marks during the US trading session. The WTI and BRENT oil dropped dramatically on Friday, falling 2.38% and 1.62% respectively.

Technical Analysis

EURUSD (4-Hour Chart)

The EUR/USD pair declined on Friday, coming under selling pressure and dropped to a daily low near the 1.027 mark heading into the US session amid the recovery witnessed in the US dollar. The pair is now trading at 1.02762, posting a 0.40% loss daily. EUR/USD stays in the negative territory amid a stronger US dollar across the board, as the mixed market mood helps the safe-haven greenback to find demand and undermined the EUR/USD pair. Moreover, The US Consumer Confidence Index improves to 55.1 in August, providing some support to the US dollar. For the Euro, the Eurozone Industrial Production rises 0.7% MoM in June, which surpassed the market’s expectations but failed to lift the shared currency higher.

For the technical aspect, the RSI indicator is 48 as of writing, suggesting the pair’s bearish outlook in the near term as the RSI falls below the mid-line. As for the Bollinger Bands, the price witnessed fresh selling and dropped below the moving average, therefore the downside momentum should persist. In conclusion, we think the market will be bearish as the pair is heading to test the 1.0246 support line. Additional losses toward 1.0158 could be witnessed if the pair dropped below that support.

Resistance:  1.0347, 1.0438, 1.0484

Support: 1.0246, 1.0158, 1.0111

GBPUSD (4-Hour Chart)

The GBP/USD pair tumbled on Friday, being surrounded by bearish momentum and refreshed its daily low near the 1.210 mark during the US trading session amid renewed US dollar strength. At the time of writing, the cable stays in negative territory with a 0.67% loss for the day. The US dollar makes a solid comeback on the last day of the week and moved higher toward the $106 area, as investors are accessing the Fed’s rate hike move in the September meeting. Currently, the markets are pricing in a 60% probability of a 50 bps rate increase next month. For the British pound, the UK Preliminary GDP report showed that the UK economy contracted by 0.1% in Q2, which reinforce the speculations of a possible recession in Q4 and acted as a headwind for the GBP/USD pair.

For the technical aspect, the RSI indicator is 44 as of writing, suggesting that the downside is more favoured as the RSI stays below the mid-line. For the Bollinger Bands, the price dropped below the moving average and remained under pressure, therefore a continuation of the downside trend can be expected. In conclusion, we think the market will be bearish as long as the 1.2178 resistance line holds. Sellers could take action and trigger an extended downward correction if the pair break below the 1.2068 support.

Resistance: 1.2178, 1.2248, 1.2277

Support: 1.2068, 1.2027, 1.1940

XAUUSD (4-Hour Chart)

Despite the US dollar regaining upside traction amid the mixed market mood and recent hawkish comments by Fed officials on Friday, the pair XAU/USD managed to stay relatively resilient and climbed modestly higher above the $1,795 area during the US trading session. XAU/USD is trading at 1795.01 at the time of writing, rising 0.27% daily. The softer-than-expected US inflation data during the week keeps investors hopeful that the Fed will tighten its policy less aggressively, expecting a 50 bps rate hike by the central bank. However, San Francisco Fed President Mary Daly said that she is open to a bigger rate hike if data warrants it. On top of that, the falling US Treasury bond yields also provided some support to the safe-haven metal.

For the technical aspect, the RSI indicator is 58 as of writing, suggesting that the upside is preserving strength as the RSI keeps heading north. For the Bollinger Bands, the price extended its bullish momentum and climbed above the moving average, therefore the upside traction should persist. In conclusion, we think the market will be bullish as the pair is testing the 1798 resistance line. A break above that level could favour the bull and open the door for additional gains.

Resistance: 1798, 1812, 1822

Support: 1769, 1756, 1738

Economic Data

CurrencyDataTime (GMT + 8)Forecast
JPYGDP (QoQ) (Q2)07:500.6%
CNYIndustrial Production (YoY) (Jul)10:004.6%
Back To Top
server

您好 👋

我能帮您什么吗?

立即与我们的团队聊天

在线客服

通过以下方式开始对话...

  • Telegram
    hold 维护中
  • 即将推出...

您好 👋

我能帮您什么吗?

telegram

用手机扫描二维码即可开始与我们聊天,或 点击这里.

没有安装 Telegram 应用或桌面版?请使用 Web Telegram .

QR code