立即开始交易 – 点击这里创建您的 VT Markets 真实账户
Back
立即开始交易 – 点击这里创建您的 VT Markets 真实账户
立即开始交易 – 点击这里创建您的 VT Markets 真实账户
立即开始交易 – 点击这里创建您的 VT Markets 真实账户
立即开始交易 – 点击这里创建您的 VT Markets 真实账户
立即开始交易 – 点击这里创建您的 VT Markets 真实账户
立即开始交易 – 点击这里创建您的 VT Markets 真实账户
立即开始交易 – 点击这里创建您的 VT Markets 真实账户
尊敬的用户:
您好!
温馨提醒您,在股指现货中的成分股产生股利,分红时,VT Markets 将于派息日前一天收盘后,对持有该股指产品的账户进行派息的费用扣补。
请务必留意,目前派息调整(Dividend)已「不再」与 持仓利率(Overnight Financing)合并计算在调期库存费率(Swap)中。完成派息后,投资者可在账户历史中查看到包含有以下注释「Div & 股指名称 & 净手数 」的资金扣补记录,即为派息调整,其中多单手数以「正值」计算,空单手数以「负值」计算,两者相加即为「净手数」。
VT Markets 股指产品隔夜仓息变化具体调整内容如下:
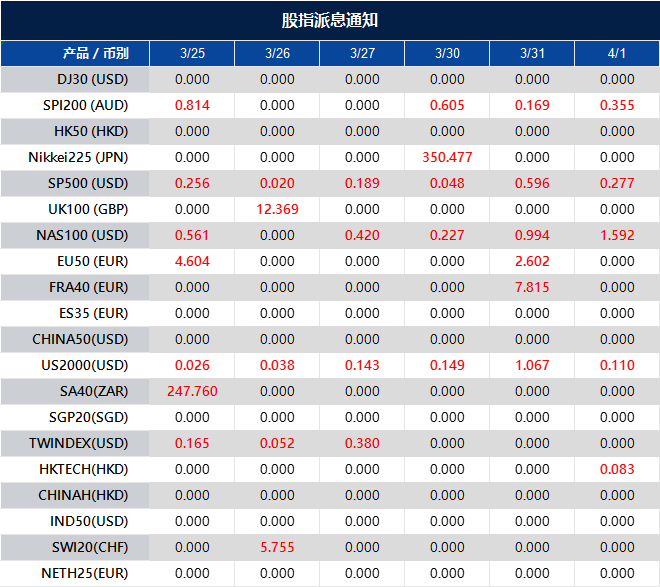
注意:以上数据仅供参考,实际执行数据有可能会有变动,具体请依据 MT4/MT5 软件为准。
如您有任何疑问,我们的团队将十分乐意为您解答。
请留言或发邮件至 [email protected] 或联系在线客服。
立即开始交易 – 点击这里创建您的 VT Markets 真实账户
立即开始交易 – 点击这里创建您的 VT Markets 真实账户


