Fed signalling a slower pace of rate hikes

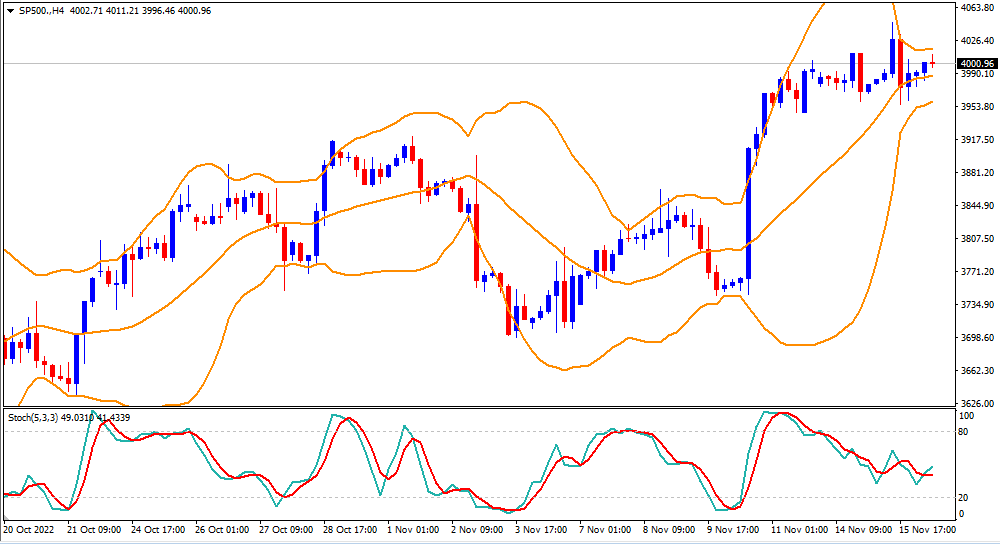
US stocks rebounded sharply on Tuesday, regaining upside momentum and ending their previous slide as investors adjusted their expectations in response to Federal Reserve officials indicating that they’ll continue to raise interest rates but are open to slowing their tempo.

The market’s expectations of softer rate hikes from the Federal Reserve continued to provide support to the equity markets but activity was limited ahead of the FOMC Meeting Minutes and US Durable Goods Orders to be out on Wednesday. Market sentiment has improved despite the looming Covid woes from China and fears of economic slowdown in major economies challenge the energy demand. The focus now shifts to the FOMC Meeting Minutes, which may shed some light on whatever the Fed may do in December.

On the Eurozone front, most of the European Central Bank officials were paving the way for another 75 bps rate hike at the December meeting. ECB policymaker Robert Holzmann supported calls for a third straight 75 basis points (bps) rate increase.

The benchmarks, S&P 500 and Dow Jones Industrial Average both advanced higher on Tuesday as the S&P 500 closed at its highest level since Sept. 12 following upbeat earnings from a handful of retailers. The S&P 500 was up 1.4% daily and the Dow Jones Industrial Average climbed higher with a 1.2% gain for the day. All of the eleven sectors in the S&P 500 stayed in positive territory as the Energy sector and the Materials sector are the best performing among all groups, rising 3.18% and 2.23%, respectively. The Nasdaq 100 meanwhile advanced the most with a 1.5% gain on Tuesday and the MSCI World index was down 0.8% for the day.

Main Pairs Movement

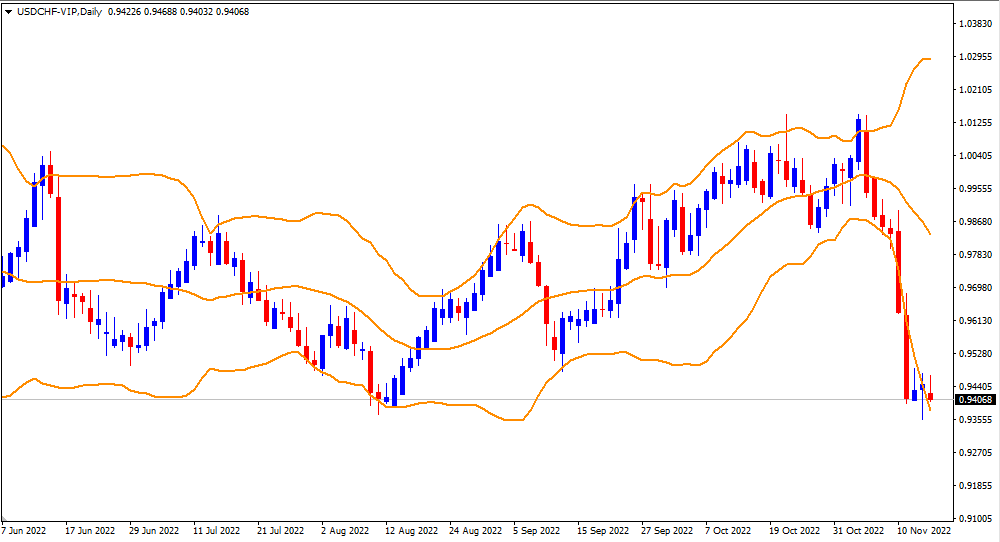
The US dollar declined lower on Tuesday, remaining under pressure and extended its daily losses amid the better performance of global equities and weaker US Treasury yields. The greenback has marked broad losses ahead of crucial catalysts scheduled for publication today. Meanwhile, the Fed’s latest meeting minutes will be closely observed to confirm the chatters surrounding the economic transition and the 50 bps rate hike chatters.

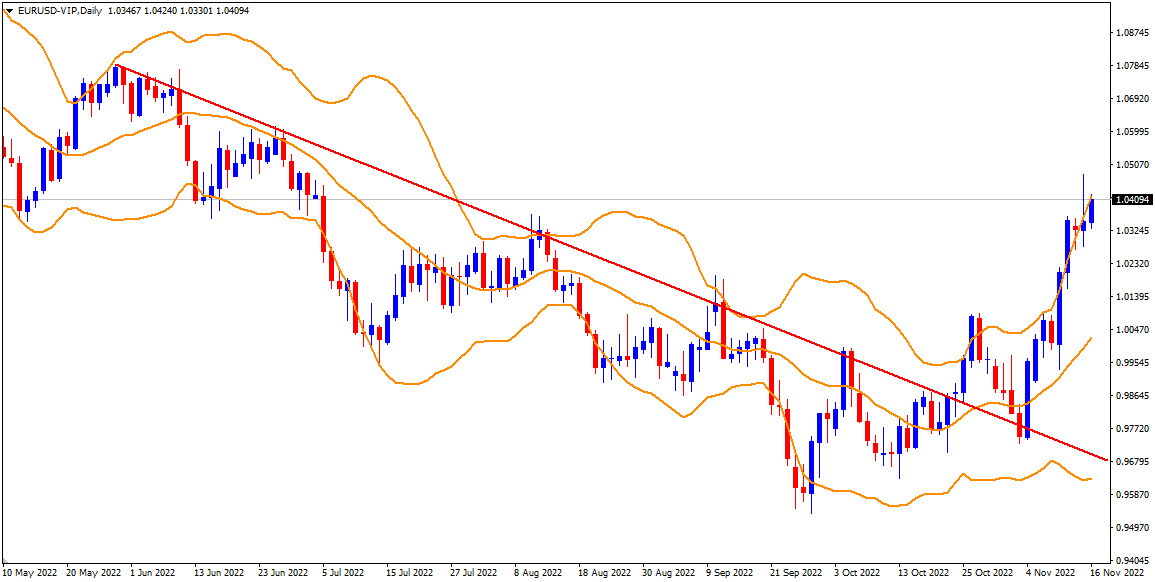
GBP/USD climbed higher on Tuesday with a 0.53% gain as the cable regained upside traction and aimed to recapture the 1.1900 level during the US session as the market mood soars ahead of FOMC minutes. On the UK front, the release of the S&P PMI numbers will be significant for the market participants. Meanwhile, EUR/USD manages to regain some composure and rebounded towards the 1.0310 area amid a weaker US dollar across the board. The pair was up almost 0.60% for the day.

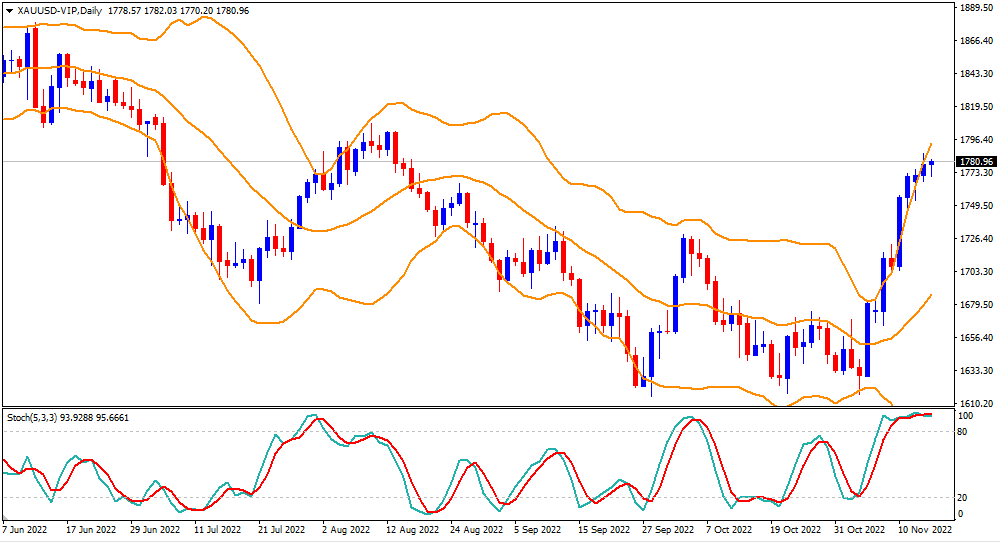
Gold advanced slightly with a 0.13% gain for the day after retreating from a daily high near the $1750 mark during the US trading session, as the expectations for Fed’s 50 bps rate hike keep acting as a tailwind for the precious metal. Meanwhile, WTI Oil picked up bids with a 1.14% gain for the day amid the headlines surrounding the G7 nations’ discussions on the oil price cap on Russian exports.

Technical Analysis

EURUSD (4-Hour Chart)

The EURUSD pair recovered some ground on Tuesday after shedding over 100 pips at the beginning of the week. The advance, however, was modest, with the pair trading around the 1.0280 level as of writing. The equities market performed better, with most stock indices holding on to modest gains and putting pressure on the US dollar. Meanwhile, US Treasury yields remain subdued, giving up most of their Monday’s gains. In Eurozone, European Central Bank officials continue to favour a 75 bps rate hike, and the move would raise the deposit rate to 2.25%. Furthermore, Finnish ECB policymaker Olli Rehn said the ECB would continue to raise interest rates, and the pace of its hikes will be determined by the rate of inflation and the overall economic situation. Elsewhere, concerns about the coronavirus situation in China remain the same. The country reported another increase in national cases, and Beijing shut down public places such as parks and museums. The potential economy limits high-yielding assets’ gains.

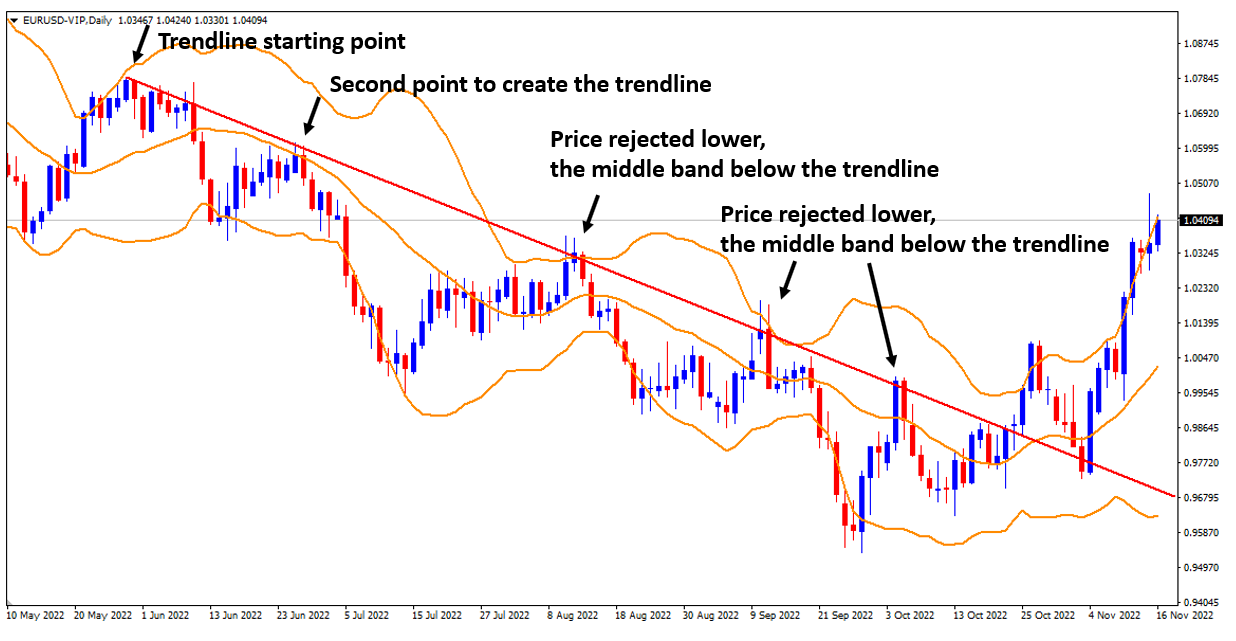
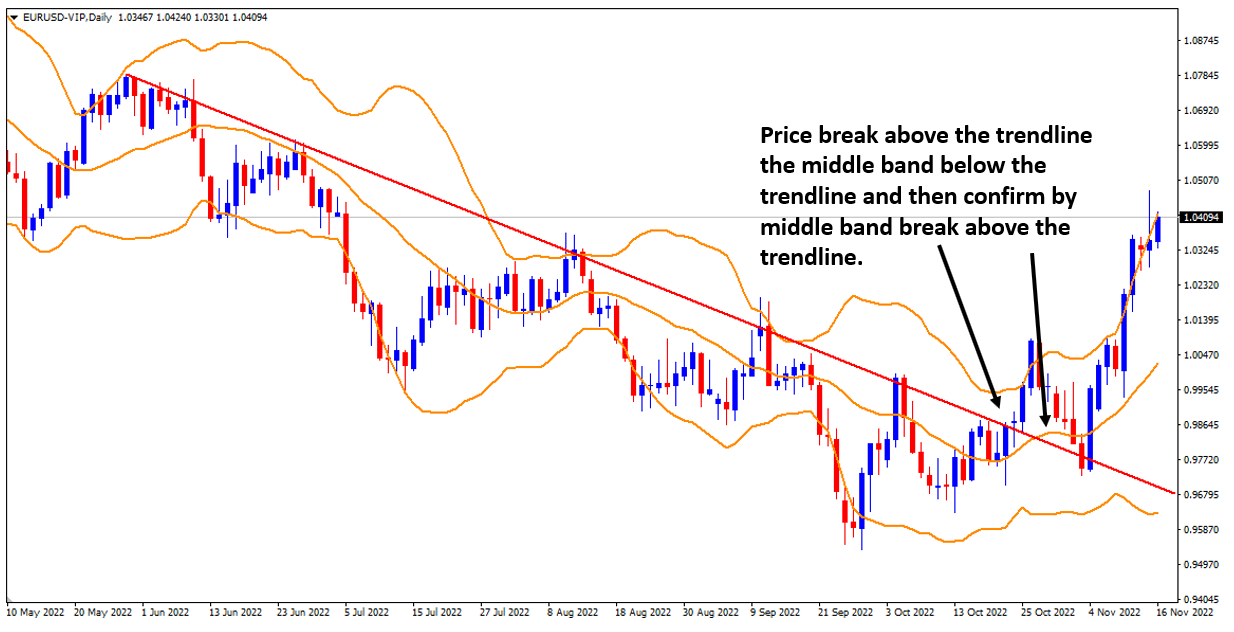
From the technical perspective, the four-hour scale RSI indicator modestly climbed to 50 figures as of writing, suggesting the pair was amid recovery momentum. As for the Bollinger Bands, the pair was pricing in the lower area and challenging the 20-period moving average resistance, which indicates that the pair have no decisive tendency. As a result, we think the pair would hover in a range from 1.0200 to 1.0400 shortly.

Resistance: 1.0475, 1.0604

Support: 1.0298, 1.0167, 0.9953

GBPUSD (4-Hour Chart)

The GBPUSD has managed to stage a rebound after having dropped below 1.1800 on Monday but confronting some sellings during the US trading session. The pair was priced at the 1.1870 level as of writing. In the absence of high-impact macroeconomic data releases, the risk perception is likely to drive the pair’s action. China reported more than 28000 new local cases on Monday and the city of Beijing announced that it will be shutting down parks and museums from Tuesday. Markets remain worried about a global economic downturn with China possibly refraining from moving away from its zero Covid policy. In domestic, the cables draw support from expectations that the Bank of England will continue to combat stubbornly high inflation. Moreover, reports that the UK government privately discussed the possibility of a Swiss-style relationship with the European Union further boosting the British pound. However, a bleak outlook for the UK economy could cap any further gain for the pair. The Uk Office of Budget Responsibility last projected the UK GDP to slump by 1.4% next year as compared to a growth of 1.8% forecast in March.

From the technical perspective, the four-hour scale RSI indicator rebounded to 56 figures as of writing, suggesting that the pair was surrounded by positive traction. As for the Bollinger Bands, the pair was breaking through the 20-period moving average and was trading in the upper area, and drawing support from the lower band of 1.1780 level, which is a signal that the pair has not made a decisive move.

Resistance: 1.2028, 1.2145

Support: 1.1765, 1.1647, 1.1366

XAUUSD (4-Hour Chart)

The XAUUSD regains some positive traction on Tuesday and snaps a four-day losing streak, as benefiting from the fresh US dollar selling. The US dollar was under some selling pressure and halts the recent rebound from its lowest level since August 12, which, in turn, is seen as a tailwind for the Dollar-denominated gold. Investors seem convinced that the Federal Reserve (Fed) will slow the pace of its rate-hiking cycle and have been pricing in a greater chance of a relatively smaller 50 bps lift-off at the December meeting. This is evident from a modest downtick in the US Treasury bond yields and weighs on the USD. However, the recent hawkish signals from several Fed officials suggest that the US central bank will continue to tighten its monetary policy to tame stubbornly high inflation. This should boost the US Treasury bond yields and help limit losses for the US dollar. In the meantime, worries about economic headwinds stemming from a new COVID-19 outbreak in China and the imposition of fresh lockdowns could benefit the greenback’s status as the global reserve currency. In addition, signs of stability in the financial markets might also contribute to capping the upside for the safe-haven precious metal.

From the technical perspective, the four-hour scale RSI indicator was wandering in a range from 35 to 50 as of writing, suggesting that the investors stay cautious for the day and the pair witnessed some negative traction. As for the Bollinger Bands, the pair was capped by a 20-period moving average and pricing at the lower area. Therefore, we think gold was more favoured to the downside path in the near term.

Resistance: 1784, 1800

Support: 1748, 1704, 1670

Economic Data

CurrencyDataTime (GMT + 8)Forecast
NZDRBNZ Interest Rate Decision09:00-4.25%
NZDRBNZ Rate Statement09:00 
NZDRBNZ Rate Statement10:00 
EURGerman Manufacturing PMI (Nov)16:3045.0
GBPComposite PMI17:3047.2
GBPManufacturing PMI17:3045.7
GBPServices PMI17:3048.0
USDBuilding Permits21:001.526M
USDCore Durable Goods Orders (MoM) (Oct)21:300.1%
USDInitial Jobless Claims21:30225K
USDNew Home Sales (Oct)23:00570K
USDCrude Oil Inventories23:30-1.055M

Markets await Fed next move

US stocks dropped lower on Monday, witnessing some downside traction and dropped as investors parsed comments from Federal Reserve officials who broadly remained steadfast in their fight against inflation. Investors are closely watching what Fed speakers say about the outlook for interest rates, as several central bank officials in recent days have restated their intention to remain relentless until inflation is under control.

On top of that, risk aversion dominated financial markets after China’s National Health Commission reported two deaths of Covid-19 patients in Beijing, which in turn raised doubts about the Chinese government’s easing of activity controls. Therefore, the worsening Covid conditions in China and indecision over Fed’s next move weighed on the market sentiment. On the Eurozone front, the mixed signals from Eurozone data and the European Central Bank (ECB) policymakers are acting as a headwind for the Euro. ECB Chief Economist Philip Lane favoured further rate hikes and expected the likely recession to be short-lived.

The benchmarks, S&P 500 and Dow Jones Industrial Average both edged lower on Monday as the S&P 500 was dragged down by the Technology stocks that are typically more sensitive to interest rates. The S&P 500 was down 0.4% daily and the Dow Jones Industrial Average retreated slightly lower with a 0.1% loss for the day. Four out of eleven sectors in the S&P 500 stayed in negative territory as the Consumer Discretionary and Energy sectors are the worst performing among all groups, losing 1.41% and 1.39%, respectively. The Nasdaq 100 meanwhile dropped the most with a 1.1% loss on Monday and the MSCI World index was up 0.6% for the day.

Main Pairs Movement

The US dollar advanced higher on Monday, continuing to find demand and extended its intra-day rally towards the 108 level amid fears of an economic downturn. The greenback rose the most in November the previous day as the market’s sentiment soured amid fresh fears of the Coronavirus. The 10-year US Treasury yields have rebounded to 3.83% despite a less-hawkish commentary from Cleveland Fed President Loretta Mester.

GBP/USD dropped lower on Monday with a 0.56% loss as the cable strumbled sharply below the 1.1900 figure in the North American session amid risk aversion. On the UK front, the UK Office for Budget Responsibility’s projection overshadows expectations that the Bank of England will continue raising rates to combat stubbornly high inflation. Meanwhile, EUR/USD retreated lower and held lower ground near a one-week low in the 1.0240 price zone amid a stronger US dollar across the board. The pair was down almost 0.80% for the day.

Gold declined lower with a 0.72% loss for the day after dropping to a daily low around the $1733 mark during the US trading session, as the precious metal is declining gradually amid a global correction in risk-perceived assets. Meanwhile, WTI Oil dropped slightly with a 0.09% loss for the day after Saudi Arabia denied an oil-production increase for the OPEC+ meeting next month.

Technical Analysis

EURUSD (4-Hour Chart)

The EURUSD managed to erase a small portion of its daily losses but lost recovery momentum around 1.0250, as Wall Street’s main indices trade in negative territory after the opening bell, allowing the US Dollar to preserve its strength and limiting the pair’s an upside. At the beginning of the week, the greenback extends the recent bounce backed by the recent hawkish message from some Fed speakers, which lent renewed oxygen to both the buck and yields. Apart from this, concerns arose during the Asian session, as China reported two new coronavirus deaths and a spike in cases as the outbreak extends in Beijing. Stay-home orders have been issued in different cities, and market players are concerned the situation can trigger fresh supply-chain issues, one of the main reasons global inflation soared earlier in the year. In the Eurozone, European Central Bank Executive Board member Philip Lane was on the wires and said that any recession in the Union would be mild and soft. He also noted that the ECB would make another hike in December, progressing towards the levels needed.

From the technical perspective, the four-hour scale RSI indicator dropped sharply below 40 figures as of writing, suggesting that the pair was confronting strong selling pressure. As for the Bollinger Bands, the euro was pricing around the lower band and the size between the upper and lower band became larger, indicating that the pair was surrounded by severe headwinds. As a result, we think the pair was more favoured to the downside path shortly.

Resistance: 1.0475, 1.0604

Support: 1.0298, 1.0167, 0.9953

GBPUSD (4-Hour Chart)

The GBPUSD stays on the back foot in the US trading session on Monday and trades at around the 1.1800 level as of writing. The negative shift witnessed in risk mood amid renewed China Covid worries helps the safe-haven US Dollar outperform its rivals and weighs heavily on the pair. China’s Covid-related news that three people died during the weekend sparked fears that authorities could reimpose strict measures to curb the outbreak. The economic docket in the United States (US) revealed the Chicago National Activity index fell into negative territory in October, to -0.05 from 0.17 in September. Aside from this, even though US October COI and PPI reports were softer-than-expected, a solid US Retail Sales report and hawkish Fed rhetoric increased the chances that the Fed will continue tightening monetary conditions. Besides, the British Pound remains undermined by the UK Autumn Budget, which failed to impress amid recession warnings.

From the technical perspective, the four-hour scale RSI indicator edged lower to 48 figures as of writing, suggesting that the pair was amid strong bearish momentum. As for the Bollinger Bands, the pair was underpinned by the lower band and hovering between the lower band and 20-period moving average, which is a signal that the pounds have no clear trading tendency. Hence, the pair need to find more clues about future movement.

Resistance: 1.2028, 1.2145

Support: 1.1748, 1.1640, 1.1366

XAUUSD (4-Hour Chart)

The XAUUSD dropped close to 0.8% on a strong US dollar and was trading at the $1739 mark as of writing. Gold price grinds lower amidst a risk-off impulse, which triggered a flight to safe-haven assets. The US Dollar (USD) remains underpinned by investors’ concerns that the recent Covid-19 outbreak in China could spur authorities to reimpose restrictions. Furthermore, sentiment remains negative, as shown by Wall Street posting losses between 0.32% and 1.08%. The financial markets’ narrative has not changed since both October’s Consumer Price Index (CPI) report and Producer Prices from the United States cooled down. However, last week’s solid US Retail Sales data increased the likelihood that the Fed would continue tightening conditions. Moreover, the US Federal Reserve officials continued to express their commitment to taming inflation toward the 2% goal, but the pace of rate hikes could moderate as soon as the December meeting. Elsewhere, US Treasury bond yields are extending their gains, particularly the 10-year benchmark note rate yielding 3.83%, drawing support for the greenback, which, in turn, hurts the non-yielding gold.

From the technical perspective, the four-hour scale RSI indicator further fell to 35 figures as of writing, suggesting that the gold was surrounded by selling transactions. As for the Bollinger Bands, the yellow metal was pricing along with the lower band, which indicates that the pair was more likely to move downward in the near term.

Resistance: 1784, 1800

Support: 1748, 1704, 1670

Economic Data

CurrencyDataTime (GMT + 8)Forecast
CADCore Retail Sales (MoM) (Sep)21:30-0.6%

Intermediate 10: Understanding Fibonacci

Fibonacci is one of the tools that Forex traders often use. Let’s figure out how the Fibonacci instrument works.

Leonardo Fibonacci, a mathematician from the 1300s, came up with a set of numbers (0, 1, 1, 2, 3, 5, 8, 13, 21, 34, 55, 89, 144, etc.), with every number in the list the sum of the two numbers that came before it. The relationship between these numbers is the same as in nature. For example, tree branches grow or split according to Fibo numbers, and the seed pods on a pinecone are arranged in a Fibonacci spiral pattern, etc.

Even in the financial markets, Fibonacci ratios are often used to explain how markets move.

There are a few constant ratios in the Fibonacci sequence. The Fibo ratios that matter the most are:

– 161.8%, the “golden ratio” (the ratio between the first number and the one before it, for example, 89/55 = 1.618).

– 61.8% (the ratio of the first number to the second number, like 55/89 = 0.618).

-38.2% (the ratio comes from a division jump of one order, like 55/144 = 0.382).

To put it on a chart in MetaTrader, click “Insert” and then “Fibonacci” from the menu. In your trading terminal, you can find the retracement, expansion, fan, arc, and time zone Fibonacci tools. All of these tools use Fibo ratios as their basis.

There are several Fibonacci tools, but Fibo retracement levels and Fibo expansion are used a lot.

Fibonacci retracement levels

Successful traders predict market price fluctuations using several approaches and tools, such as the Fibonacci retracement levels. The Fibonacci retracement lines represent price support and resistance on a price chart, helping traders determine when the price can retrace before continuing the trend.

Formulas for Fibonacci retracement levels

Math is the basis for the Fibonacci retracement tool. You need to use the following formula to find Fibonacci retracement levels:

For an uptrend, UR = H – ((H – L) x percentage); 

or

DR = L + ((H – L) x percentage) for a downtrend.

Where:

UR is a retracement of a trend going up, DR is a retracement of a trend going down, H is a high price, and L is a low price.

Even though most trading platforms can do these calculations for you, it’s good to know how to do it yourself.

How to calculate Fibonacci retracement levels

Now that you know the formula for calculating Fibonacci retracement levels, you can figure out how to do it.

First, look at the price chart and pick two price points—one high and one low. It is essential to make sure that there are no higher highs or lower lows. If you don’t find it right, your calculations won’t be correct, and you won’t find the right retracement level. Then, once you’ve found the high and low, you can use these two numbers in a formula to figure out the retracement levels for a specific area of price action.

What are the ratios of Fibonacci?

However, it’s not enough to know the highs and lows. You also need to know what percentage to put into the formula. Traders use Fibonacci ratios to figure out the levels of Fibonacci retracements.

The Fibonacci ratio is the percentage of the chosen price range that shows where the price movement will stop and start. Fibonacci ratios come from the Fibonacci numbers, a series of numbers where each is the sum of the two numbers before it. If you divide a Fibonacci number by the following number, you get 0.618, which is 61.8%. When you divide the same number by the following number to the right, you get 0.382 (38.2%) and then 0.236 (23.6%). This ratio and 50% are price support and resistance levels, so they are used to find Fibonacci retracement levels.

For instance, the price of an asset goes up from $15 to $18.43. Here’s how to find the Fibonacci retracement levels:

$18.43 – (($18.43 – $15) x percentage)

So, the retracement levels will be $17.62 (at 23.6%), $17.12 (at 38.2%), $16.71 (at 50%), and $16.31 (at 61.8%).

How can you use Fibonacci retracement levels in charts?

Fibonacci retracement levels can be used to find the best time to enter a trade by looking at charts. After a steady trade, the most common way to use this tool is to see if the price goes back to one of the Fibonacci levels. 

For example, if the cost of an asset drops 23.6% after a significant rise and then goes back up, it might be an excellent time to trade.

How to draw the retracements of Fibonacci?

Even though Fibonacci retracement levels are hard to explain, they are seen as a reliable way to predict how prices will move, primarily when used with other methods of technical analysis. 

However, some traders may find it hard to draw Fibonacci retracement lines because once done incorrectly, they can lead you to the wrong conclusions and mess up your whole trade. 

That is why it’s essential to know how to draw Fibonacci retracements correctly.

Most trading platforms already include the Fibonacci tool, so you don’t have to draw the lines and levels by hand. You must look at how prices have moved in the past and pick the swing highs and lows. 

Then, to draw a line, you need to move your cursor from low to high (for an uptrend) or high to low (for a downtrend).

Intermediate 9: Understanding Bollinger Band

What Is the Bollinger Band Indicator?

A Bollinger Band is a technical analysis tool consisting of a set of trendlines drawn to two standard deviations (up and down) from the simple moving average (SMA) of an instrument’s price. Traders can change these trendlines to suit their needs.

Bollinger Bands were made by the famous technical trader, John Bollinger, who owns their rights. The tool is intended to help investors identify market trends to determine when an asset has been oversold or overbought.

A Bollinger Band has three critical parts: 

  • Middle Band – a simple moving average
  • Lower Band – two standard deviations below the Middle Band
  • Upper Band – two standard deviations above the Middle Band. 

Note that the standard deviation determines the market’s probable movement range.

Bollinger Band charts

How to read Bollinger Bands 

Since the middle band is the same as the simple moving average, we can tell where the trend is going by understanding the concept of Moving Average from the previous lessons.

Knowing how to read the upper and lower bands is essential. Traders usually look at the upper band to see if the market is too high. 

Most of the time, if a price touches the Bollinger Bands, the price may be overbought. In the same way, the lower band shows a possible overbought level.

Bollinger Band charts

However, many new traders make the mistake of thinking that when they hear the words “overbought” or “oversold,” they must enter a reversal position immediately. Even though this isn’t always the case since overbought levels are estimates based on the past, there is a chance that more people will buy, and the trend will continue.

Bollinger Band charts

The image shows an oversold condition that doesn’t change immediately and keeps going lower before going up. This is because sellers keep coming in even though the lower band has already been hit.

It is crucial to confirm whether they are at overbought or oversold levels. In this case, we can use other indicators like the Stochastic or RSI, the price action, or the Bollinger Bands themselves.

Confirmation with Stochastic / RSI Oscillator

When a price moves from below the middle band to above the middle band, we can look at the Stochastic or RSI to see if it is in the middle or lower than level 50. If so, we can state that the increasing trend has been confirmed.

Bollinger Band charts

When the price reaches the top band, we may check the Stochastic or RSI to see if it is also in the overbought zone. If so, we can confirm that the price is indeed in the overbought zone.

Bollinger Band charts

Looking at the image above, we can see that both the Bollinger and the Stochastic Indicator show that the price is overbought, indicating that the Gold price might be slowing down from the upward movement.

However, we recommend that you wait to enter a reverse position.

Confirmation within the Bollinger Band

Bollinger Band charts

The Bollinger Bands can be confirmed by observing whether the band is widening or narrowing. If the price is above the upper Bollinger Band and the two bands are expanding, this indicates that the price will continue to rise. However, when we observe that the Bollinger band has begun to narrow, although the price is at the upper Bollinger, this is confirmation that the price will reverse lower.

Similarly, a further decrease will occur if the price is at the lower Bollinger with the extended band. However, a price reversal to the upside is highly probable when the band has begun to narrow.

Combining the Bollinger Band with trendline

In this strategy, we use Bollinger Bands and trendlines.

Bollinger Band charts

The image shows that the trendline is formed from the highest point and the next lower high but is controlled by the middle band.

The trading strategy is straightforward. If we observe that the price is in the upper band but below the trendline, indicating that the price is no longer able to rise and that it is time for the decrease to continue, there may be a few breaks as long as the price remains in the upper band and is not too far from the trendline. The potential will, after that, continue to decrease.

Bollinger Band charts

When the price breaks above the trendline near the middle band, the price begins to change the trend.

We may expect another movement. If the middle band crosses above the trendline, the downtrend is considered to have ended.

Bollinger Band charts

Week ahead: Will RBNZ continue to raise rates amid stronger domestic activities?

The Reserve Bank of New Zealand (RBNZ) raised its official cash rate in October by 50bps, its fifth increase since late last year. It follows a string of robust economic reports showing that domestic activities have strengthened. Will the central bank raise rates by another 75bps as forecasted?

Here is a roundup of the latest financial news for this week:

RBNZ Rate Statement (23 November)

In October, the Reserve Bank of New Zealand increased its official cash rate to 3.5%, the first raise since April 2015.

Inflation has been low in recent years, but domestic economic activities may have picked up in Q3 2022 as employment continues to rise. However, the value of purchases of durable goods such as consumer electronics and vehicles has decreased in recent years.

Analysts predict RBNZ will add another 75bps to the rate at this month’s meeting.

French Flash Services PMI (23 November)

The French Services Purchasing Managers’ Index dropped to 51.7 in October from a flash reading of 51.3 but down from 52.9 in September.

The business confidence index fell to its lowest level in almost two years, reflecting concerns over persistently high inflation and a drop in investment appetite.

German Flash Manufacturing and Services PMI (23 November)

In October, Germany’s Manufacturing Purchasing Managers’ Index declined to 45.1 from a preliminary estimate of 45.7, indicating the fourth consecutive month of falling factory activity and the most significant contraction since May 2020.

The Services PMI increased to 46.5 in October, compared to the previous month’s 28-month low of 45.0.

Analysts predict the Flash Manufacturing PMI to climb to 45.9 and the Services PMI to increase to 47.5.

UK Flash Manufacturing and Services PMI (23 November)

October’s UK Manufacturing Purchasing Managers Index increased to 46.2 and points to the steepest pace of contraction since May 2020.

UK Services PMI also climbed to 48.8, from a preliminary reading of 47.5 and the first overall decline in output since February 2021.

Analysts forecast both Flash Manufacturing and Services PMIs to be 47.2.

US Flash Services PMI (23 November)

The October US Flash Services PMI rose to 47.8, compared with 49.3 in the previous month. The reading was better than the preliminary estimate of 46.6.

We expect the next Flash Services reading to be 49.3.

FOMC Meeting Minutes (24 November)

In November, the Fed raised its target for the federal funds rate by 75bps to 3.75%-4%, making its highest level since 2008. The board aims to achieve a stance of monetary policy consistent with 2% inflation and maximum employment.

Fed Reserve: Future policy tightening is expected

US stocks advanced higher on Friday, regaining upside momentum and ended with a slight gain for the day after shrugging off Federal Reserve warnings that there was more policy tightening to come. Treasury yields rose again after hawkish comments from Fed policymakers as they reiterated their commitment to taming inflation down.

St. Louis Fed President James Bullard said that interest rates are not sufficiently restrictive and needed to rise at least 5%-5.25% to curb inflation. On the economic data front, the US Existing Home Sales for October plunged 5.9%, which came below a 4.17% increase estimated by analysts and was mainly caused by the Federal Reserve’s tightening monetary conditions as they try to curb stubbornly high inflation. However, market sentiment remains positive throughout the session on the back of soft CPI, and PPI October reports.

On the Eurozone front, European Central Bank (ECB) President Christine Lagarde said that the central bank is committed to bringing down medium-term inflation to 2% by escalating interest rates.

The benchmarks, S&P 500 and Dow Jones Industrial Average both edged higher on Friday as the S&P 500 posted decent gains amid falling chances for a consecutive 75 basis point (bps) rate hike by the Federal Reserve. The S&P 500 was up 0.5% daily and the Dow Jones Industrial Average climbed slightly higher with a 0.6% loss for the day. Nine out of eleven sectors in the S&P 500 stayed in positive territory as the Utility sector and the Real Estate sector is the best performing among all groups, rising 2.00% and 1.29%, respectively. The Nasdaq 100 meanwhile was little changed with a 0.3% loss on Thursday and the MSCI World index was down 0.6% for the day.

Main Pairs Movement

The US dollar advanced higher on Friday, preserving its upside momentum and extended its daily gains towards the 107 level amid a deterioration in market sentiment that did not last much. The greenback is posting modest weekly gains after more signs of a slowdown in inflation and better-than-expected retail sales numbers. The market focus now shifts to the release of the US Durable Goods Orders data on Wednesday and the FOMC meeting minutes on Thursday.

GBP/USD climbed higher on Friday with a 0.22% gain as the cable flirted with the 1.1880~1.1900 area amidst a risk-on impulse. On the UK front, the UK Retail Sales for October, rose by 0.6% MoM, coming in better than expected despite the Bank of England (BoE) acknowledging the UK economy entered a recession. Meanwhile, EUR/USD retreated slightly from a daily high and finished the day in the 1.0320 price zone amid a stronger US dollar across the board. The pair was down almost 0.36% for the day.

Gold declined lower with a 0.55% loss for the day after retreating from a daily high towards the $1750 mark during the late US trading session, as additional Fed officials emphasized the need for higher interest rates after two soft October inflation reports. Meanwhile, WTI Oil dropped sharply with a 2.04% loss for the day.

Technical Analysis

EURUSD (4-Hour Chart)

The EURUSD was wandering around the 1.0350 level during the US trading session as the US dollar regather strength and climbed above 106.68 as of writing. The pair was struggling to make a decisive move in either direction and fluctuating in its weekly range above 1.0300. While speaking at the Frankfurt Financial Conference, European Central Bank President (ECB) Christine Lagarde reiterated that they expect to raise rates further to levels needed to ensure that inflation returns to the 2% medium-term target. However, Lagarde’s hawkish comments failed to provide support for the Euro. The October Existing Home Sales data, which measures the change in the annualized number of existing residential buildings that were sold during the previous month, printed 4.43M compared to the market expectations of 4.38M and the previous 4.71M, with a -5.9% change. The pessimistic figures reminded investors of the downturn in the housing market, weighing on the US Dollar after a few minutes of the report release and limiting the pair’s losses.

From the technical perspective, the four-hour scale RSI indicator further traced back to 50 figures, suggesting the pair failed to find a clear direction to move. As for the Bollinger Bands, the EURUSD was pricing below the 20-period moving average and the size between upper and low bands remained small, which is a signal that the pair was amid a consolidation phase. Hence, our view is that the euro would wander between the 1.0300 to 1.0475 area shortly.

Resistance: 1.0475, 1.0604

Support: 1.0298, 1.0167, 0.9953

GBPUSD (4-Hour Chart)

The GBPUSD regained upside traction and climbed above 1.1900 following a sharp decline with the initial reaction to the UK’s Autumn Budget. On Thursday, British Chancellor Jeremy Hunt announced that they will be introducing a total of £55 billion in tax rises and spending cuts in the Autumn Budget. “Today’s statement delivers a consolidation of £55 billion and means inflation and interest rates end up significantly lower,” Hunt added. Which triggered heavy selling on the British Pound and the pair tumbled by more than 1% on Thursday. Apart from this, it’s also worth noting whether the UK’s fiscal policy will allow the Bank of England (BoE) to adopt a less-aggressive policy-tightening approach. Nevertheless, the negative impact of the budget on the cables faded away quickly, suggesting that investors are yet to decide how the fiscal policy will influence the monetary policy. Moreover, the Retail Sales released earlier in the day were surprisingly above forecasts, even though the Bank of England acknowledged the UK economy entered a recession. Retail sales for October rose by 0.6% MoM against 0.3% estimates.

From the technical perspective, the four-hour scale RSI indicator remained the 54 figures as of writing, suggesting that the pair is amid mild upside traction. As for the Bollinger Bands, the pair was trading around a 20-period moving average with small volatile, which is a signal that the pair would put into sideway and hover in a narrow range from 1.1800 to 1.1950 shortly.

Resistance: 1.2028, 1.2145

Support: 1.1742, 1.1633, 1.1365

XAUUSD (4-Hour Chart)

The XAUUSD remained on the back foot and was set to finish the week with 1% losses, as the US Existing Home Sales plunged severely under the continuously hawkish comments by Federal Reserve. The US National Association of Realtors reported that Existing Home Sales for October plunged a staggering 5.9%, below a 4.17% increase estimated by analysts. Home sales have fallen since February of 2022 due to the Federal Reserve’s tightening monetary conditions as they try to curb stubbornly high inflation, which peaked around 9%. However, market sentiment remains positive throughout the session on the back of soft CPI, and PPI October reports. In the meantime, Fed policymakers reiterated their commitment to taming inflation down. On Thursday, Minnesota’s Fed President Neil Kashkari commented that one-month data can’t over-persuade the Fed, as it needs to keep at it until they’re sure that inflation has stopped climbing. Besides, the US Treasury bond yields, namely the 10-year benchmark note rate, rise two bps, yielding 3.795%, putting a lid on the non-yielding yellow metal.

From the technical perspective, the four-hour scale RSI indicator dropped deeper to 42 figures as of writing, suggesting that the gold was amid severely negative momentum. As for the Bollinger Bands, the yellow metal was pricing around the lower band with low volatility, which indicates the pair was struggling to make a decisive move in either direction. As a result, we think gold would get into a consolidation phase in the near term.

Resistance: 1784, 1800

Support: 1748, 1704, 1670

Economic Data

CurrencyDataTime (GMT + 8)Forecast
EURECB President Lagarde Speaks03:30 

服务器升级维护通知

尊敬的用户:

您好!

VT Markets 致力于为客户提供更快速且稳定的交易环境,我们将于周末进行 (MT4/MT5) 升级维护。

维护时段: 2022 年 11 月 19 日 (星期六) 17:00 至 21:00

上述时段采用 GMT+8 时区

请您务必留意下列事项:

本周末维护期间,客户仍可照常参与交易。

产品报价的稳定及市场流动性将可能受影响而降低 ,我们建议客户谨慎操作。

望您谅解因此次升级维护为您所带来的不便,我们将继续为您提供更优质的服务。

如您有任何疑问,我们的团队将十分乐意为您解答。
请留言或发邮件至 [email protected] 或联系在线客服。

Fed promised to fight inflation

US stocks declined lower on Thursday, continuing their downside momentum and dropping for a second day as Federal Reserve officials are likely to remain persistent in their fight against inflation and warned of more pain to come. Fed speakers in recent days have emphasized that they need to go further to extinguish price pressures.

Moreover, the renewed concerns related to the Ukraine-Russia war and the worsening coronavirus outbreak in China both weighed on investors’ moods. The country reports increased cases daily, which raised potential supply-chain issues for the global economy.

On the economic data, the US Weekly Initial Jobless Claims declined to 222K, which came in slightly better than the market expectation of 225K.

On the Eurozone side, the negative sentiment could be due to recent events in Polonia, as NATO believes Russia was responsible for the missile strike that targeted a Polish city, despite the missile presumably originating from Ukraine’s defence.

The benchmarks, S&P 500 and Dow Jones Industrial Average both edged lower on Thursday as the S&P 500 declined for the second straight session amid the souring market mood. The S&P 500 was down 0.3% daily and the Dow Jones Industrial Average was little changed with a 0.1% loss for the day. Eight out of eleven sectors in the S&P 500 stayed in negative territory as the Utility sector and the Consumer Discretionary sector are the worst performing among all groups, losing 1.79% and 1.27%, respectively. The Nasdaq 100 meanwhile retreated slightly with a 0.2% loss on Thursday and the MSCI World index was down 0.8% for the day.

Main Pairs Movement

The US dollar advanced higher on Thursday, regaining some upside traction and recovering some of the ground lost earlier in the week in the late US trading session as the market mood remained sour. Despite the latest second-tier data from the United States coming in mixed, the Federal Reserve policymakers’ resistance to reiterate the statements favouring the 50 bps rate hike in December helped the US Dollar to find demand.

GBP/USD declined lower on Thursday with a 0.42% loss as the cable witnessed fresh selling and retreated towards the 1.1780 mark after the UK budget and US data. On the UK front, the UK government presented a fiscal plan, which presented an increase in taxes of £55 billion and spending cuts to restore the UK’s fiscal reputation. Meanwhile, EUR/USD retreated slightly from a daily high and finished the day in the 1.0360 price zone amid a stronger US dollar across the board. The pair was down almost 0.32% for the day.

Gold declined lower with a 0.76% loss for the day after extending the intra-day slide towards a daily low around the $1758 area during the US trading session, as Federal Reserve talks, Russia-Ukraine tussles and Covid woes both favoured the greenback. Meanwhile, WTI Oil dropped sharply with a 4.62% loss for the day.

Technical Analysis

EURUSD (4-Hour Chart)

The EURUSD continued to edge lower and traded deep in negative territory slightly above the 1.0300 level as of writing. As the market sentiment keeps undermining, helping the safe-haven greenback gather strength on Thursday and weighing on the euro. Geopolitical tensions and concerns about global economic setbacks came back to fashion this week, and weight on stock markets. The US Dollar is showing signs of responding to risk-off flows, although its gains are limited, as US Treasury yields are seeing limited activity. The 10-year Treasury yields note hovers around 3.73%, roughly 50 bps below its year’s peak, while that on the 2-year note stands at 4.38%. In data-wise, the European Area released September Construction Output, which rose 0.1% MoM as anticipated. The Union’s Consumer Price Index was revised to 10.6% YoY in October, slightly below the preliminary estimate of 10.7%. The United States Initial Jobless Claims for the week printed 222K, a little lower than the estimate of 225K, and Building Permits in October reads 1.526M, compared to the consensus of 1.512M, which provides some support for the US Dollar.

From the technical perspective, the four-hour scale RSI indicator further declined to 54 figures as of writing, suggesting that the pair was confronting a corrective pullback. As for the Bollinger Bands, the EURUSD was pricing below the 20-period moving average and the size between upper and lower got closer, which is a signal that the pair move with small volatility. As a result, we think the pair would be put into sideway shortly.

Resistance: 1.0475, 1.0604

Support: 1.0298, 1.0167, 0.9953

GBPUSD (4-Hour Chart)

The GBPUSD stayed deep in red and traded below the 1.1780 level as of writing, as investors assess the UK’s Autumn Budget and the US Dollar managed to regather strength from the deteriorated market mood. While testifying before the UK Treasury Select Committee, Bank of England Governor Andrew Bailey said that they are likely to raise interest rates further. However, this comment failed to provide a boost to the Pound Sterling as Bailey also acknowledged they were seeing signs that the supply chain shock was starting to fade. Also, the Chancellor of the Exchequer, Jeremy Hunt presented the Autumn Statement, the budget of Prime Minister Rishi Sunak on Thursday. The budget was large as expected by analysts. Hunt presented an increase in taxes of £55 billion and spending cuts to restore the UK’s fiscal reputation after a chaotic September and October. On the data side, economic data from the US showed an unexpected decline in the Philly Fed to -19.4 in November from -8.7. Continuing Jobless Claims rose to the highest level since April. The US dollar initially dropped after the reports, but immediately rebounded sharply and reached a fresh daily high.

From the technical perspective, the four-hour scale RSI indicator retreated further to 53 figures as of writing, suggesting that the short-term upside traction faded. As for the Bollinger Bands, the price was priced in the lower area and close to the 20-period moving average, indicating that the price now has no clear direction. Hence, we think the cables were likely getting into the consolidation phase in the near term.

Resistance: 1.2028, 1.2145

Support: 1.1742, 1.1633, 1.1365

XAUUSD (4-Hour Chart)

The XAUUSD extended its losses and eyeing a test of the weekly lows around $1753 marks, following hawkish Federal Reserve (Fed) commentary and a tranche of United States economic data released that underpinned the US Dollar. The risk sentiment shifted sour as Fed policymakers emphasized the need to tackle inflation, led by the St. Louis Fed President James Bullard. Bullar said that rates might be “sufficiently restrictive” at around 5% to 7% and called his colleagues to raise rates further if they’re to achieve the Fed’s 2% goal. On the data side, a busy economic calendar in the United States would entertain Gold traders, led by unemployment claims and housing data. Initial Jobless Claims for the week dropped to 222K, below estimates of 225K and the previous week’s 226K. Contrarily Continuing Claims rose 13K, to 1.51 million, increasing for the fifth straight week, an uptrend signing that Americans are out of work for longer. Furthermore, a jump in US Treasury bond yields weighed on the yellow metal. The US 10-year Treasury bond yield jumps 9 bps to 3.781%, acting as a headwind for the non-yielding yellow metal.

From the technical perspective, the four-hour scale RSI indicator dropped deeper to 50 figures as of writing, suggesting that the gold was confronting a corrective pullback. As for the Bollinger Bands, XAUUSD was pricing below the 20-period moving average with low volatility. As a result, we think the pullback is to store the strength for the next rally, and the pair was more favoured to move with low volatility in the near term.

Resistance: 1800

Support: 1748, 1704, 1670

Economic Data

CurrencyDataTime (GMT + 8)Forecast
GBPRetail Sales (MoM) (Oct)15:000.3%
EURECB President Lagarde Speaks16:30 
USDExisting Home Sales (Oct)23:004.38M

US Retail Sales increased, indicating the economy can handle Fed rises

US stocks declined lower on Wednesday, failing to preserve their upside momentum and witnessing selling pressure after strong retail sales data and comments from at least two Federal Reserve speakers recast bets that the central bank’s policy tightening regime is nearing an end.

The US Retail Sales rose by 1.3% in October, which came in better than the market expectation for an increase of 1% and indicated the economy can withstand additional Fed hikes. The figure weighed on equity markets amid speculation that inflation may resume its advance and the US Federal Reserve could maintain the aggressive tightening path.

Moreover, former President Donald Trump announced he will seek another term in the office, launching his Presidential run for 2024. The news lifted concerns amid his views on the US relationship with China.

On the Eurozone front, European Central Bank (ECB) Vice President Luis de Guindos said that the ECB would continue with policy normalisation and continue the restrictive monetary policy.

The benchmarks, S&P 500 and Dow Jones Industrial Average both declined lower on Wednesday as the S&P 500 fell after a report showed retail sales posted the biggest increase in eight months in October. The S&P 500 was down 0.8% on a daily basis and the Dow Jones Industrial Average also dropped slightly with a 0.1% loss for the day. Nine out of eleven sectors in the S&P 500 stayed in negative territory as the Energy sector and the Consumer Discretionary sector are the worst performing among all groups, losing 2.15% and 1.46%, respectively. The Nasdaq 100 meanwhile retreated the most with a 1.4% loss on Wednesday and the MSCI World index was up 1.1% for the day.

Main Pairs Movement

The US dollar edged lower on Wednesday, gathering some strength in the late US trading session and ended the day mixed amid a worsening sentiment following Tuesday’s developments in the Ukraine-Russia war. On top of that, tensions arose in China as the country keeps reporting increased coronavirus contagions and Regional lockdowns spread across the country are worsening the situation. The US Retails Sales also smashed forecasts and pressured the Federal Reserve.

GBP/USD advanced higher on Wednesday with a 0.41% gain after the cable rebounded towards the 1.1920 mark and recovered some of its daily gains as UK inflation surged. On the UK front, the significant jump in the UK inflation rate has triggered chances of further policy tightening by the BOE in the upcoming monetary policy announcements. Meanwhile, EUR/USD remains sidelined around a 4.5-month high and paused a two-day uptrend below the 1.0400 mark amid mixed market sentiment. The pair was up almost 0.44% for the day.

Gold retreated lower with a 0.29% loss for the day after testing the weekly high around the $1786 mark during the European session, as the mixed data from the US spurred a risk-off impulse and provided support to the US dollar. Meanwhile, WTI Oil dropped sharply with a 1.53% loss for the day as the Druzhba pipeline, which carries Russian oil into Europe, is said to have been restored.

Technical Analysis

EURUSD (4-Hour Chart)

The EURUSD has erased it’s daily and declined below 1.0400 in the American session on Wednesday, as the negative shift witnessed in the risk sentiment despite the upbeat US Retail Sales data seemed to be helping the US Dollar find demand and weighing on the pair. The US core Retail Sales MoM, which measures the change in the total value of sales at the retail level in the U.S., printed surprisingly 1.3% compared to the forecast of 0.4% and the previous 0.1%. The better-than-expected sale data drew support for the safe-haven greenback in the early US trading session. Apart from this, concerns arose late on Tuesday, when supposed Russian missiles hit a Poland city near Ukraine’s border, killing two civilians. Moscow denied responsibility and initial findings suggest it could be part of Ukraine’s air defences. Nevertheless, NATO and Poland are on alert and further investigating the situation. In the meantime, the political developments in the United States take centre stage. Former US President Donald Trump announced he will run for president in 2024. Additionally, Republicans are close to winning control of the House of Representatives, adding 8 seats to a total of 217, just one short of the total needed to create a majority.

From the technical perspective, the four-hour scale RSI indicator slid to 60 figures as of writing, which suggested that the pair’s upside traction has been softer. As for the Bollinger Bands, the euro was hovering in the higher area. Therefore, we think the euro has no direction and would be put sideway.

Resistance: 1.0606, 1.0349

Support: 1.0280, 1.0167, 0.9953

GBPUSD (4-Hour Chart)

The GBPUSD edged high following the release of mixed US economic data from the United States, while also a slew of Bank of England (BoE) governors crossed the newswires after a red-hot UK CPI report. At the time of writing, the British pound was trading at 1.18886 with a 0.22% gain on a daily basis. The US Department of Commerce (DoC) reported that sales grew the most in eight months, with readings hitting 1.3% MoM vs. 1% estimated by analysts. Digging deep into the report, Retail Sales in the control group, used to calculate Gross Domestic Product (GDP), expanded by 0.7% MoM vs. 0.3% foreseen. Even though inflation data in the United States showed signs that an era of elevated prices could end, consumer resilience proves otherwise. In the domestic, the Consumer Price Index for October jumped 11.1% YoY, smashing estimates of 10.7%, reported the Office for National Statistics (ONS). Notably, the inflation report comes one day before Chancellor Jeremy Hunt unveils the Autumn Budget, which is expected to show a “fiscally responsible” government under new Prime Minister Rishi Sunak. After the release of the UK inflation readings, the BoE Governor Andrew Baily said that inflation is reflecting a series of supply shocks. However, he added that those shocks are starting to fade and noted that the central bank would raise rates further.

From the technical perspective, the four-hour scale RSI indicator remained at 62 figured as of writing, suggesting that the pair’s bullish momentum turned mild. As for the Bollinger Bands, the cables were wandering in the upper area, which is a signal that there is no clear tendency and gets into a consolidation phase.

Resistance: 1.2028, 1.2143

Support: 1.1744, 1.1639, 1.1358, 1.1141

XAUUSD (4-Hour Chart)

The gold price climbed to a daily high of $1785 during the European session but reversed its direction in the second half of the day on Wednesday, as the US Dollar benefited from safe-haven flows. The XAUUSD was trading at $1774 marks at the time of writing. The yellow metal is looking for more clarity on Russian military attacks on Poland as statements from US President Joe Biden and Polish President Andrzej Duda have created confusion. In early Asia, Biden noted that “based on the trajectory, it is unlikely that the missile is fired from Russia.” Also, Duda confirmed that what happened was a one-off incident, adding that there were no indications that there will be a repeat of today’s incident. This year, Russia’s invasion of Ukraine has already brought significant volatility in the global markets. An extension of Russian military attacks on members of NATO would accelerate it further. This might also impact gold prices significantly. Meanwhile, the returns on the United States government bonds have been a major victim of a significant decline in US inflation figures. The 10-year United States Treasury has dropped sharply from a high of 4.34% to a low near 3.76%.

From the technical perspective, the four-hour scale RSI indicator dropped to 59 figures as of writing, suggesting that the gold was confronting a corrective pullback. As for the Bollinger Bands, XAUUSD was pricing around the 20-period moving average with low volatility. As a result, we think the pullback is to store the strength for the next rally, and the bullish path is more favoured in the near future.

Resistance: 1800

Support: 1748, 1704, 1670

Economic Data

CurrencyDataTime (GMT + 8)Forecast
AUDEmployment Change (Oct)08:3015.0K
EURCPI (YoY) (Oct)18:0010.7%
GBPAutumn Forecast Statement20:30 
USDBuilding Permits (Oct)21:301.512M
USDInitial Jobless Claims21:30225M
USDPhiladelphia Fed Manufacturing Index (Nov)21:30-6.2

Market expectations improved as US PPI released softer

US stocks rebounded higher on Tuesday, ending their previous slide and regaining upside momentum as fresh data added to evidence that inflation may have peaked. The Producer Price Index (PPI) for final demand in the US declined to 8% on a yearly basis in October, which decelerated compared to last month’s 8.2% and strengthened the case for the Federal Reserve to moderate its pace of interest-rate hikes.

The market sentiment improved following the release of the US Producer Price Index and acted as a tailwind for the equity markets. Moreover, some Fed speakers in recent days also indicated that officials could slow their tempo and emphasized the central bank has more work to do to tame inflation. On the Eurozone front, geopolitical tensions arose as the latest news reported that two Russian missiles landed in Poland and killed two Polish. After the incident, Polish Prime Minister Mateusz Morawiecki called an urgent meeting and things could escalate fast as Poland is a NATO member.

The benchmarks, S&P 500 and Dow Jones Industrial Average both advanced higher on Tuesday as the S&P 500 soared for most of Tuesday’s session, giving back some of its gains after the latest news showed that Russian missiles landed in NATO-member Poland. The S&P 500 was up 0.9% on a daily basis and the Dow Jones Industrial Average also climbed slightly with a 0.2% gain for the day. Nine out of eleven sectors in the S&P 500 stayed in positive territory as the Communication Services sector and the Consumer Discretionary sector are the best performing among all groups, rising 1.78% and 1.24%, respectively. The Nasdaq 100 meanwhile advanced the most with a 1.5% gain on Tuesday and the MSCI World index was down 0.6% for the day.

Main Pairs Movement

The US dollar retreated lower on Tuesday, failing to preserve upside traction and dropped to fresh monthly lows against most major rivals but then posted a nice comeback ahead of the close amid a mixed market mood. The headlines surrounding Russia and the market’s cautious sentiment ahead of the US Retail Sales for October have provided some support to the safe-haven greenback. Downbeat prints of US Retail Sales could weigh on prices amid talks of the Fed’s pivot.

GBP/USD advanced higher on Tuesday with a 0.93% gain after the cable retreated back towards the 1.1800 mark and surrendered its daily gains following the release of US PPI data. On the UK front, the UK’s Chancellor of the Exchequer, Jeremy Hunt, gave some clues regarding the Autumn Budget. Meanwhile, EUR/USD failed to extend the upside traction and retreated from the highest levels since early July around to 1.0300 area amid mixed market sentiment. The pair was up almost 0.20% for the day.

Gold advanced higher with a 0.43% gain for the day after climbing steadily to the $1,780 mark during the US session, as Federal Reserve’s case for diminishing interest-rate size increases has helped the yellow metal to find demand. Meanwhile, WTI Oil advanced sharply with a 1.22% gain for the day amid geopolitical worries from Europe.

Technical Analysis

EURUSD (4-Hour Chart)

The EURUSD has lost its bullish momentum and slid below the 1.0400 level following a sharp spike in the early US trading session, as the US Dollar Index, which dropped to multi-month lows after soft US PPI data, managed to recover some grounds and climb above 106.00 level at the time of writing, capping the pair’s upside. The US. Producer Price Index (PPI), which measures the change in the price of goods sold by manufacturers, rose by 0.2% in October, compared to market expectations and the previous month of 0.4%. The softer-than-expected data weighed on the greenback, which, in turn, drew support for the European currency. Apart from this, the Euro Area Gross Domestic Product was confirmed at 0.2% QoQ in the third quarter of the year, as previously estimated. The German ZEW survey showed that the Economic Sentiment improved in November but also that it remains within negative levels.

From the technical perspective, the four-hour scale RSI indicator dropped sharply to 61 figures as of writing, which suggested that the pair witnessed huge selling transactions. As for the Bollinger Bands, the euro was pricing in the higher area, close to the 20-period moving average. Therefore, we think the pullback is good news for the pair, it’s a healthy pullback to store the upside strength.

Resistance: 1.0606, 1.0349

Support: 1.0272, 1.0163, 0.9955

GBPUSD (4-Hour Chart)

The GBPUSD has erased a portion of its gains after having jumped above 1.2000 earlier in the day. Nevertheless, the pair is still up more than 1% on the day, supported by the improving market mood following weaker-than-expected US producer inflation data, and the British pound was pricing at 1.1810 level as of writing. The US Bureau of Labor Statistics released the Producer Price Index for October, printing 0.2% compared to the market estimates and the previous 0.4%, ahead of the American trading session. Although the data hurt the safe-haven greenback heavily in the early American trading session, the US Dollar regathered strength in the second half. The DXY index, which tracks the greenback vs. a basket of its main rivals, rebounded from multi-month lows to above 106.5 level at the moment of writing, as the market is amid worsening risk sentiment. In the domestic, the ONS reported that the ILO Unemployment Rate edged higher to 3.6% in three months to September from 3.5%, and the further details of the publication revealed that the annual wage inflation, as measured by the Average Earnings Excluding Bonus, rose to 5.7% from 5.5%.

From the technical perspective, the four-hour scale RSI indicator retreated to 62 figures as of writing, suggesting the upbeat market mood has been calm down. As for the Bollinger Bands, the pair was priced in the upper area and close to the 20-period moving average. Hence, our view of this kind of movement is a great pullback to consume the overbuying orders, and the pair is more favoured to upside movement in the near term.

Resistance: 1.1901, 1.2157

Support: 1.1639, 1.1353, 1.1140

XAUUSD (4-Hour Chart)

The gold was headed higher on the day and trading at $1774 as of writing, with the undermining market mood on Poland news. The XAUUSD surged with a 0.3% gain on the news that at least two are dead after Russian missiles landed in NATO state Poland on the Ukraine border, according to the Express. Poland has convened a national security committee meeting according to a spokesman. The US Dollar had been pressured on Monday following Producer Price Index data that mirrored last week’s Consumer Price Index. However, the DXY index recovered some ground and climbed back above the 106.5 level as of writing. Meanwhile, the US 2-year yield is trading near 4.37%, just above the recent low near 4.29% last Thursday. The 10-year yield is trading near 3.80%, below the recent low near 3.81% last Thursday, which drew support for the non-yielding yellow metal. Equity markets had latched onto the PPI data as confirmation of the CPI data but flaked out on the day and started to melt towards the lowest point of the day, as risk-off outflow caused by sudden geopolitical disruption.

From the technical perspective, the four-hour scale RSI indicator remained above 70 figured three days in a row, suggesting that the gold’s upside momentum is strong enough to confront the short-term corrective pullback. As for the Bollinger Bands, the yellow metal kept moving above the 20-period moving average, targeting the $1800 marks psychological level. Therefore, we think an upside movement in the near future could be expected.

Resistance: 1800

Support: 1748, 1704, 1670

Economic Data

CurrencyDataTime (GMT + 8)Forecast
GBPCPI (YoY) (Oct)15:0010.7%
USDCore Retail Sales (MoM) (Oct)21:300.4%
USDRetail Sales (MoM) (Oct)21:301.0%
CADCore CPI (MoM) (Oct)21:30 
GBPBoE Gov Bailey Speaks22:15 
GBPInflation Report Hearings22:15 
EURECB President Lagarde Speaks23:00 
USDCrude Oil Inventories23:30-0.440M
Back To Top
server

您好 👋

我能帮您什么吗?

立即与我们的团队聊天

在线客服

通过以下方式开始对话...

  • Telegram
    hold 维护中
  • 即将推出...

您好 👋

我能帮您什么吗?

telegram

用手机扫描二维码即可开始与我们聊天,或 点击这里.

没有安装 Telegram 应用或桌面版?请使用 Web Telegram .

QR code