A moving average is one of the simplest ways to analyse the market and predict future price movements. They’re easy to use, which makes them a great first step for new investors. But even if you’re an experienced trader, moving averages can still be valuable tools for your arsenal—especially when combined with other forms of technical analysis.
In this article, we’ll walk you through what a moving average is, how it works, and how it can help you make better investment decisions.
What is a Moving Average?
A moving average is used as a technical analysis tool that helps provide an updated average price, so it’s easier to look into data and determine trends that could dictate the market’s movement and thus influence your trading decisions. It is a simple calculation that involves taking the sum of all the past closing prices or other data points and dividing it by the number of data points used in the calculation.
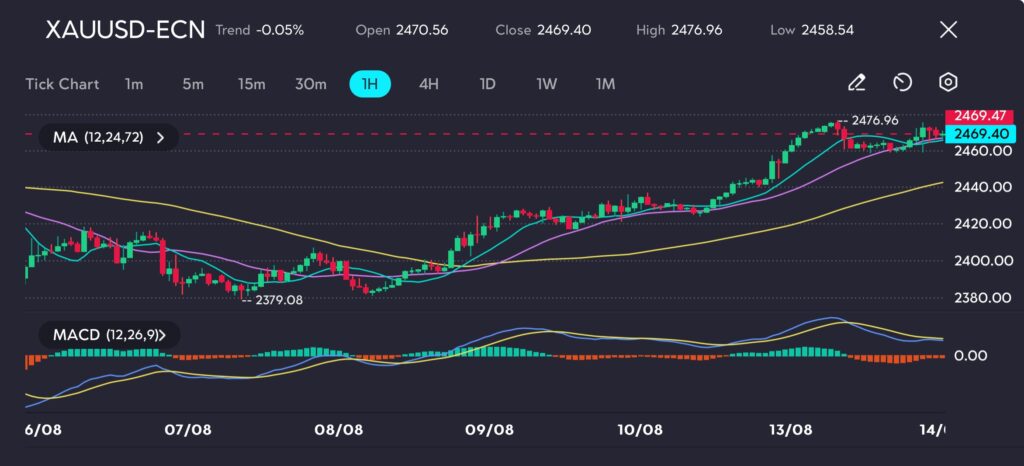
Source: VT Markets MT4
For example, if you have ten days of closing prices and use an average of 200 days for your moving average, then there are 200 data points being used to calculate an average for each day. This means that every day, you will have ten new closing prices added to your calculation and 190 from previous days.
The most important thing you need to know about moving averages is that they are lagging indicators: they only predict future trends after forming a pattern or trend over several periods (usually around 20). This makes them useful when looking at longer-term trends but less helpful when determining short-term movements in price.
Types of Moving Averages
There are three common types of moving averages:
Simple Moving Average (SMA)
A simple moving average is the sum of closing prices over specific periods. For example, a 20-day SMA would be made up of 20 days’ worth of closing prices and plotted on a chart as an average line.
Exponential Moving Average (EMA)
An exponential moving average is calculated by adding a percentage of each period’s closing price to the previous period’s moving average. The most common EMA type is a 5-period EMA, which adds 20% of today’s closing price to 80% of yesterday’s closing price. This means that recent prices are given more weight than older prices (like with a simple moving average).
Weighted Moving Average (WMA)
A weighted moving average gives more importance to recent data points than old ones. With a weighted moving average, the most recent data point will have the most weight in calculating the average. The weights are calculated by multiplying each data point by a number between 0 and 1, with 0 being given to older prices and 1 being given to more recent prices.
How do you read a Moving Average Break Pattern?
Traders use a moving average (MA) to help identify if a trend is up or down. As its name suggests, a moving average takes the average price of an asset over a specific period. The most common type of MA is the simple moving average (SMA), which takes all closing prices for an asset during its given period, adds them together, and then divides that sum by the number of days in that timeframe.
Source: Investopedia
Here’s an example:
Suppose you have three days’ worth of closing prices from Apple stock from Jan 1st through Jan 3rd, each day being US$100 per share.
To calculate your SMA for this period, it would look something like this:
US$100 + US$100 + US$100 = US$300 / 3 = US$100 per share
This would be your SMA line on your chart because every new price point would be plotted against this line until another new value comes in, which takes over as part of your new SMA calculation until another change occurs again, and so on.
What are the benefits of using a Moving Average Break Pattern?
There are many benefits to using the Moving Average Break pattern.
- The moving average break is a technical analysis tool that can help you identify trends, overbought or oversold conditions, and support and resistance levels. It can also be used to confirm turning points in a specific market.
- A moving average break occurs when the price moves through an established trend line on a chart, such as the 50-day Simple Moving Average. This pattern is one of several price patterns you can use to determine if it’s time to buy or sell stocks, futures contracts, or other financial assets.
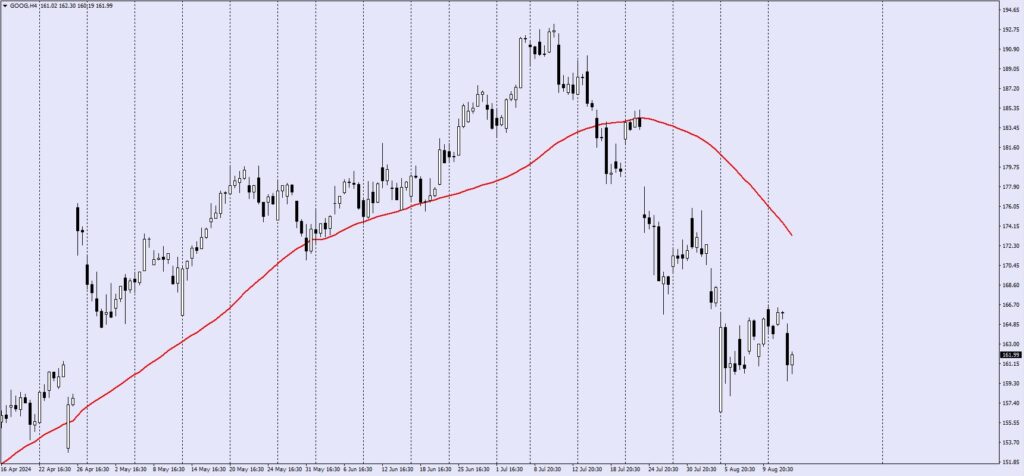
Source: VT Markets MT4
When trading with multiple assets at once, you need to keep an eye on what’s happening with your trades. Get an idea about whether some changes are significant enough to affect your overall portfolio performance, which means keeping tabs on key indicators like moving averages. By comparing slices of data against each other daily, you will know when to expect major highs/lows during any given period.
In conclusion, moving averages are useful tools for investors, along with many others. They allow you to take a big-picture view of the market and make informed decisions about your investment strategy. Moving averages can be used in any timeframe, so whether you are looking at daily, weekly, or monthly charts, there will always be a moving average that works best in the current market environment.