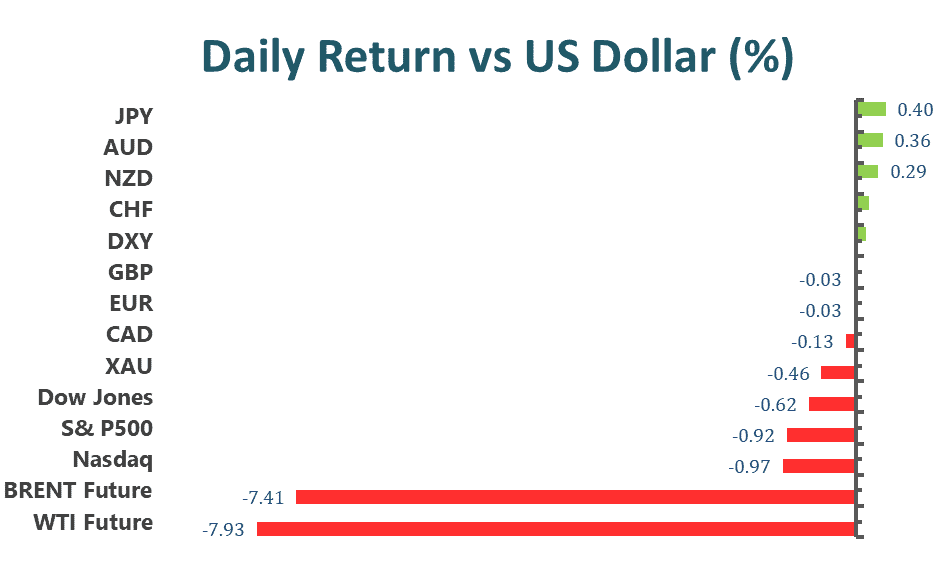
US stock declined on Tuesday amid fears that aggressive rate hikes will drag the economy into a recession ahead of Wednesday’s critical inflation report. Slowing economic growth and soaring inflation continued to weigh on investors’ mood across financial markets, as economists said that inflation kept heating up in June and might force the Federal Reserve to gear for another big rate hike. Meanwhile, the escalating fears about a global recession made market participants fly to the safe-haven greenback for safety and exerted bearish pressure on equity markets. In the Eurozone, macroeconomic data showed that the Economic Sentiment plunged to -53.8 in July, much worse than the previous -28 and missed expectations. The energy crisis in the area, supply chain disruptions, and the ECB’s intentions to hike interest rates both dragged the Euro lower.
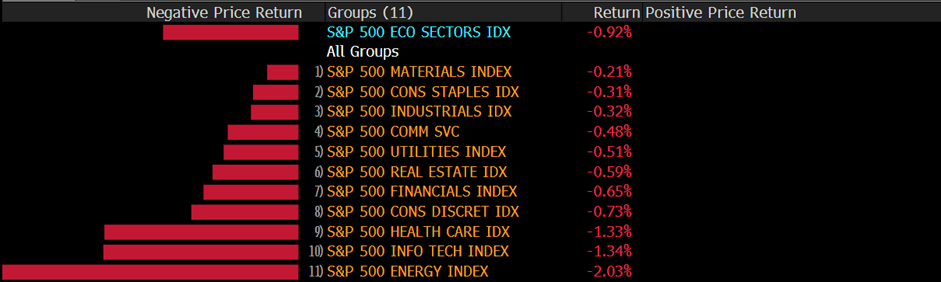
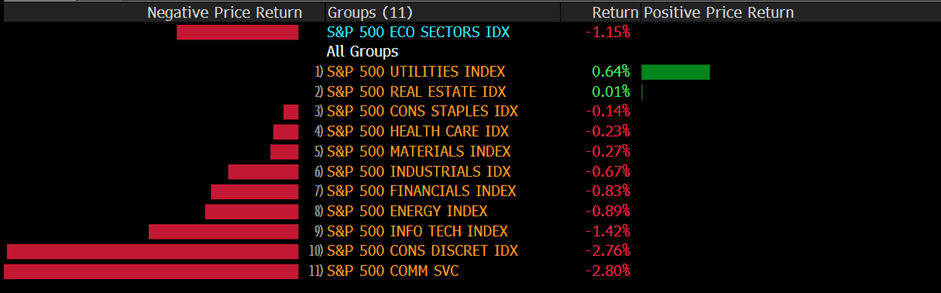
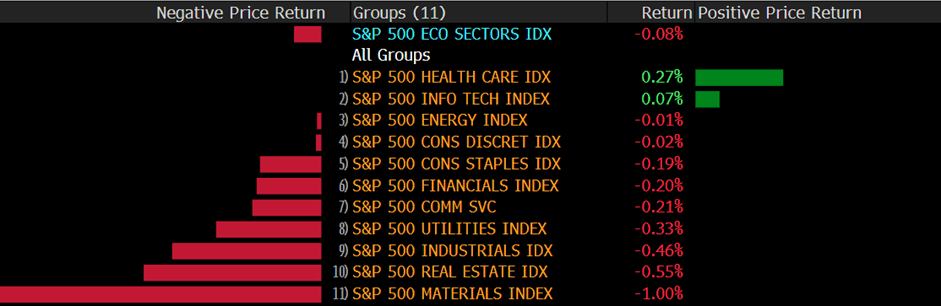
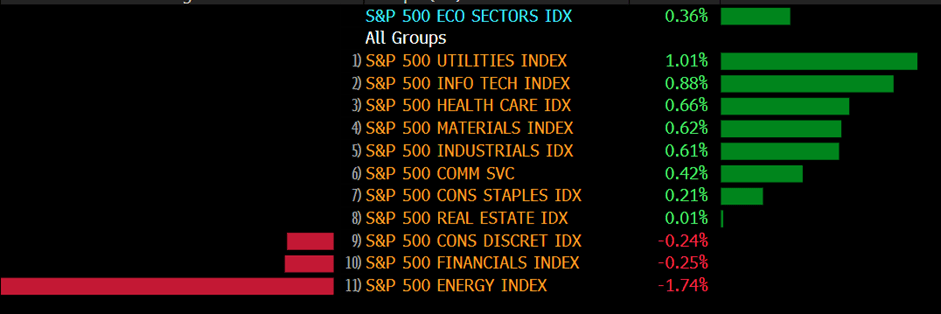
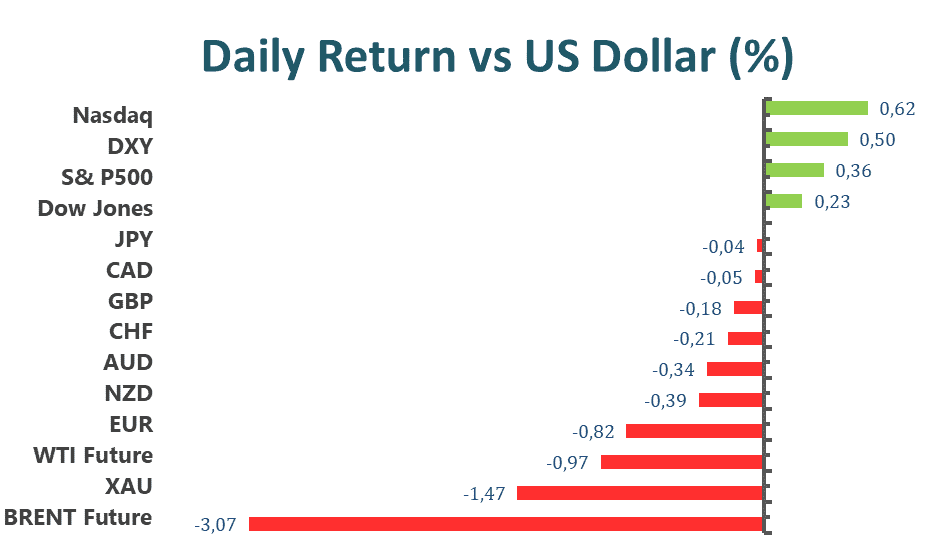
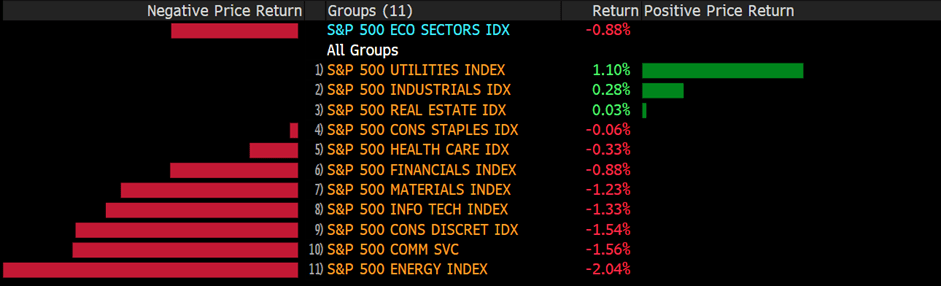
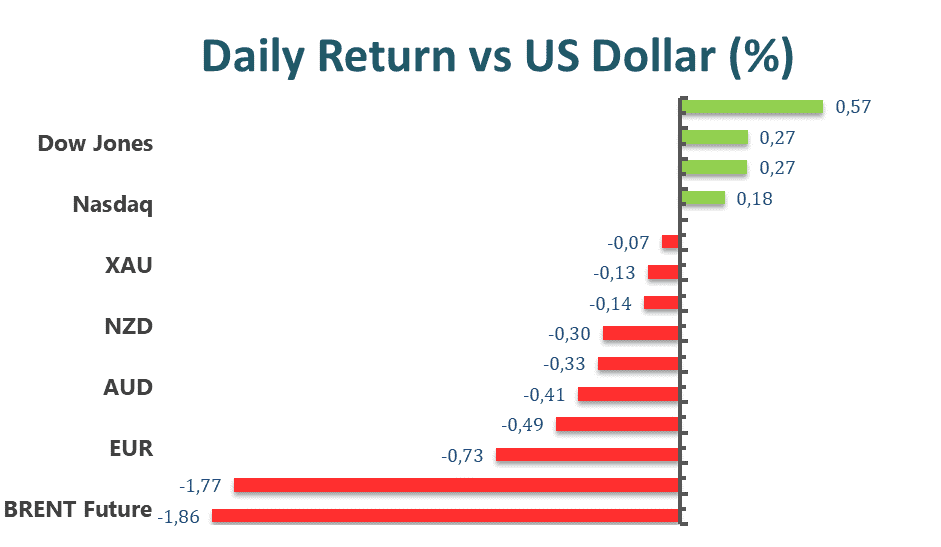
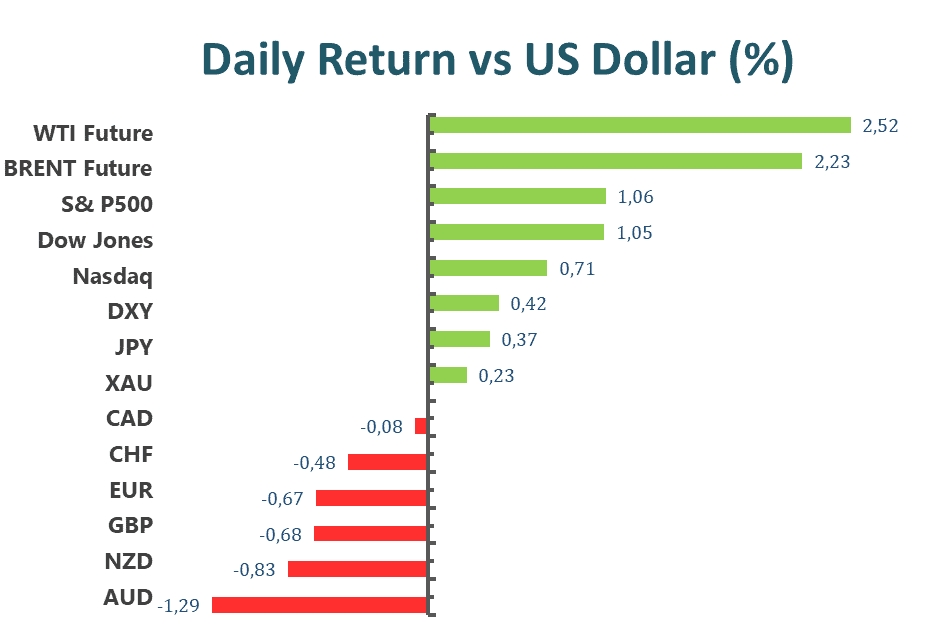
The benchmarks, S&P 500 and Dow Jones Industrial Average, dropped on Tuesday as the market is nervous about a global recession and a possible 75 bps rate hike in July by the Fed. The S&P 500 was down 0.9% daily and the Dow Jones Industrial Average declined with a 0.6% loss for the day. All of the eleven sectors stayed in negative territory as the energy and information technology sectors are the worst-performing among all groups, losing 2.03% and 1.34%, respectively. The Nasdaq 100 meanwhile declined the most with a 1.0% loss on Tuesday and the MSCI World index fell 0.8%.
Main Pairs Movement
The US dollar remained steady on Tuesday, losing its upward momentum after touching a daily high of 108.500 level during the Asia session. The DXY index stopped the bullish atmosphere sustained for several days as investors waited for the oncoming US inflation report scheduled on Wednesday.
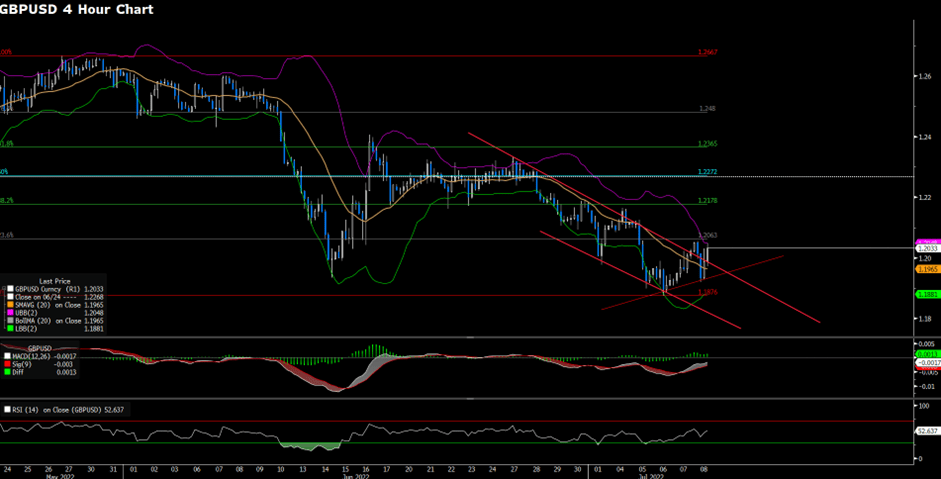
The GBP/USD bounced from a daily low of 1.1810 level to around 1.1900 on Tuesday as the US dollar became mild during the Asia session. The Bank of England governor said there are alternatives to 25bps rate hikes in the table, adding he expects inflation to fall sharply next year. Meanwhile, EUR/USD also rebounded from a 20-year low 1.0000 level during the Asia session to close at around 1.005 at the end of the day, the fears of a slowdown in economic growth and the aggregation of Fed accentuate the importance of the oncoming inflation report.
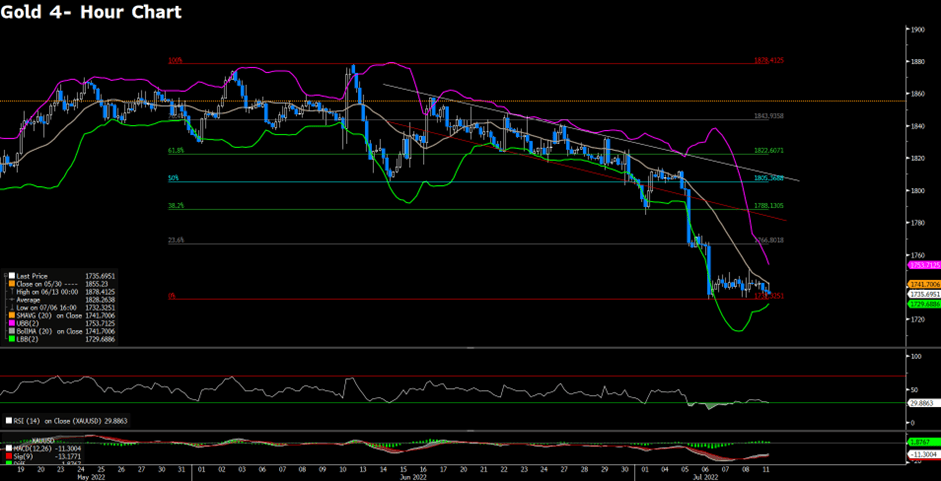
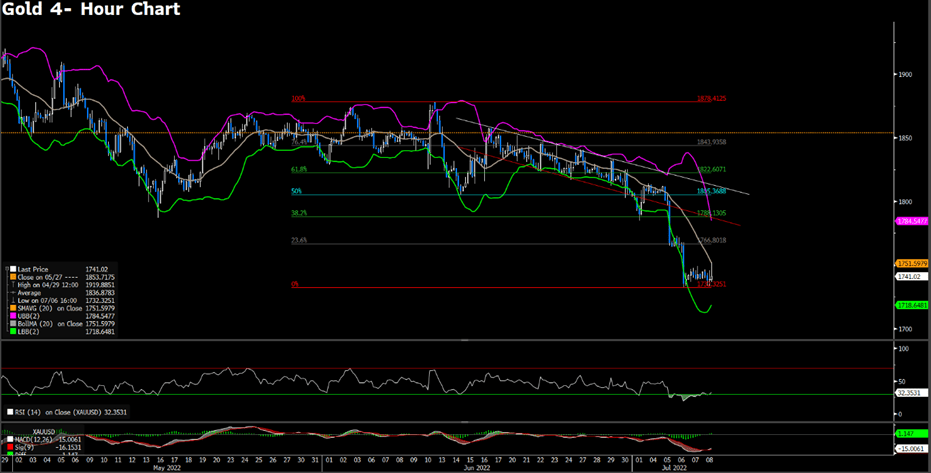
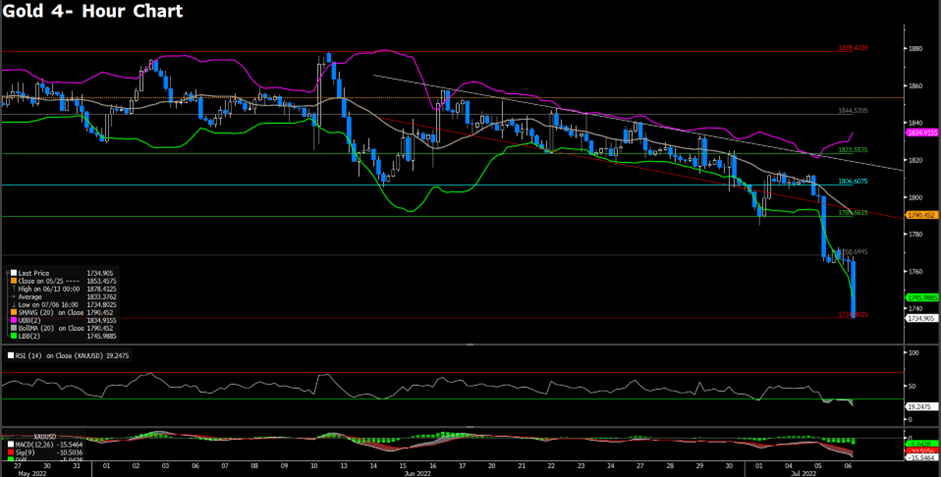
Gold declined with a 0.3% loss on Tuesday, although there is a rebound during the Asia session as the US dollar is mild, the gold is still under bearish pressure ahead of the CPI report announced on Wednesday and closed at $1728 at the end of the day. Meanwhile, WTI dropped nearly 8% on Tuesday, oil is falling sharply during the NY session as the concern that China could enter another round of Covid-19 lockdown.
Technical Analysis
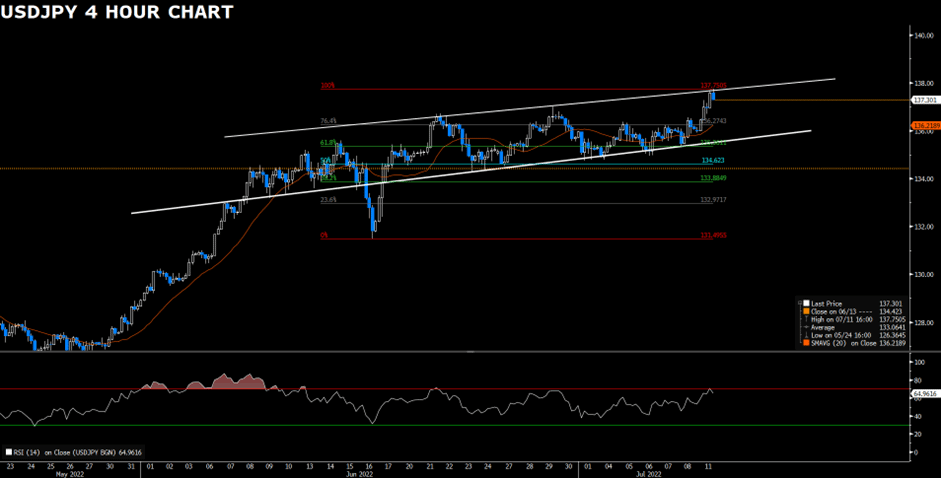
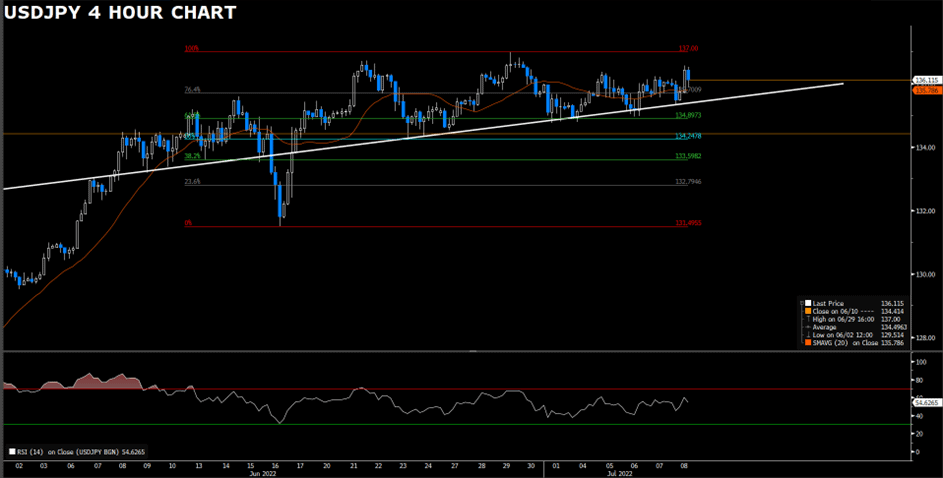
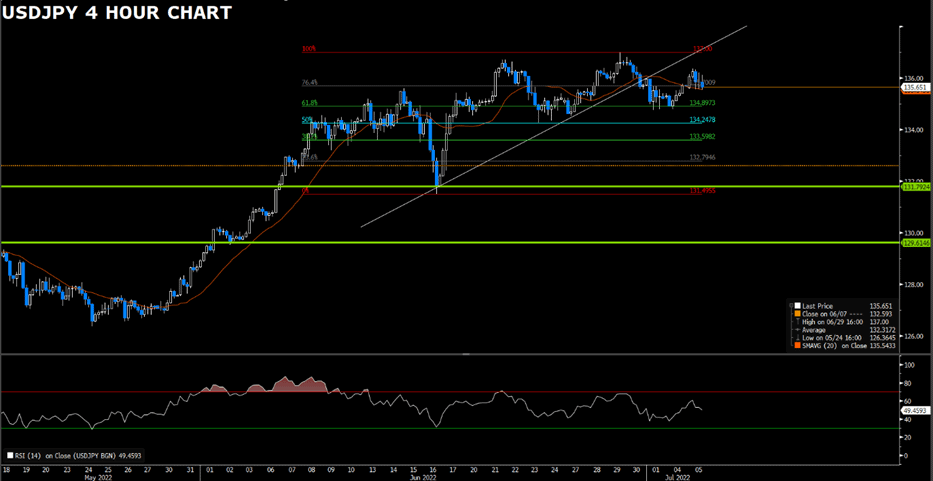
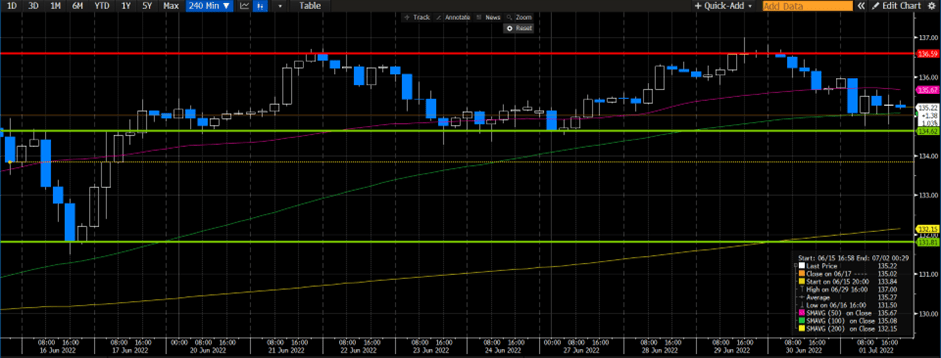
USDJPY (4-Hour Chart)
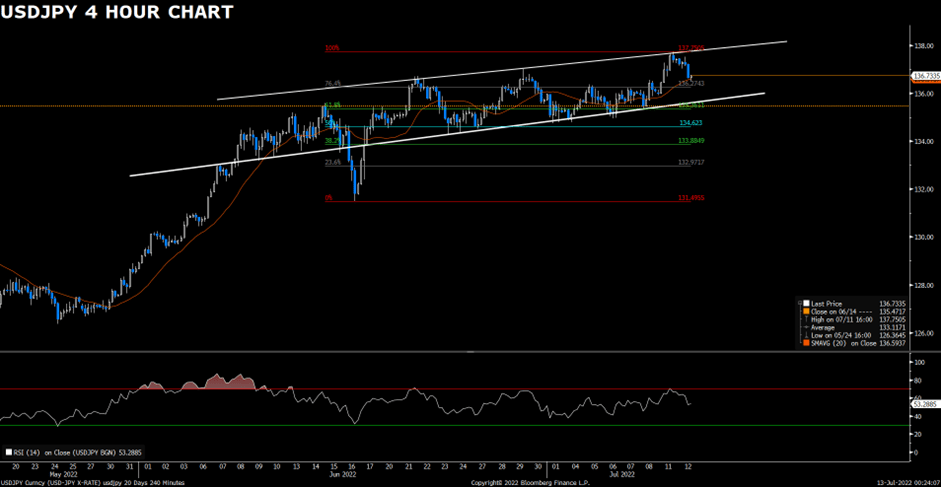
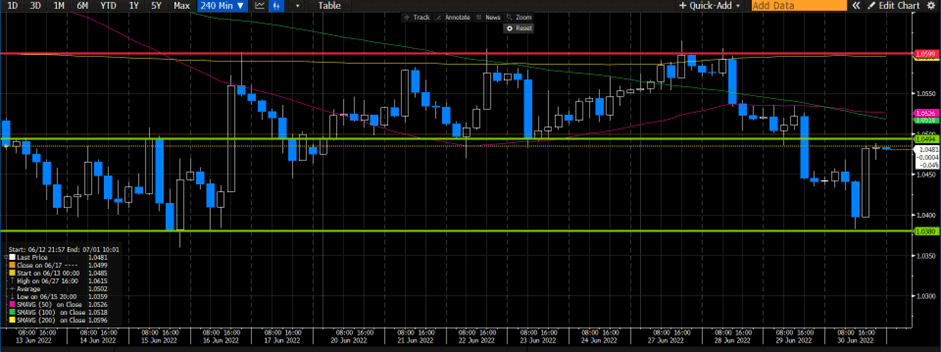
USDJPY heads into the correction phase after reaching a 24-year peak. The corrective pullback seems to be some profiting taking ahead of the US CPI on Wednesday. Technical speaking, USDJPY witnesses some profiting- taking after hitting the upper bound of the bullish channel as well as the immediate resistance of 137.75. However, the outlook of USDJPY remains bullish as it continues to trade within the ascending channel and above the 20 Simple Moving Average. As long as USDJPY stays above the 135.00 mark, the upside momentum is expected to remain unchanged. On the flip side, failure to hold above 135.00 would erode its bullish outlook on the four-hour chart. Further price action eye on the US CPI report.
Resistance: 137.75
Support: 136.27, 135.36, 134.62
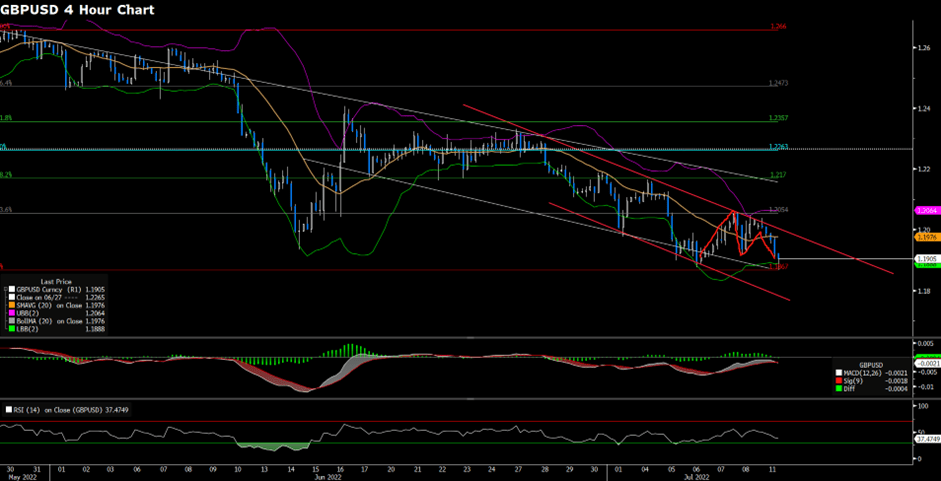
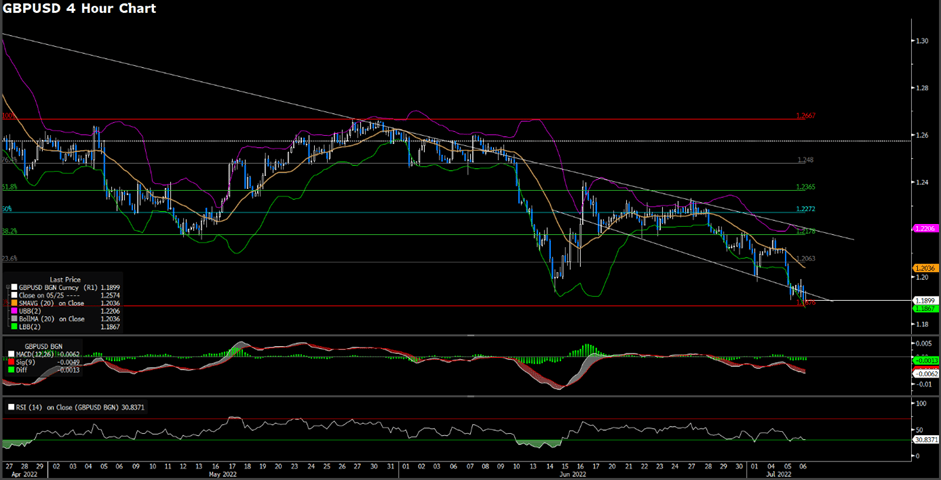
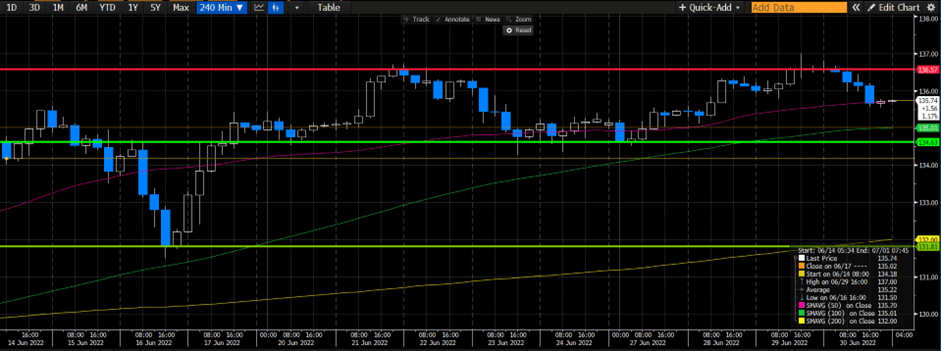
GBPUSD (4-Hour Chart)
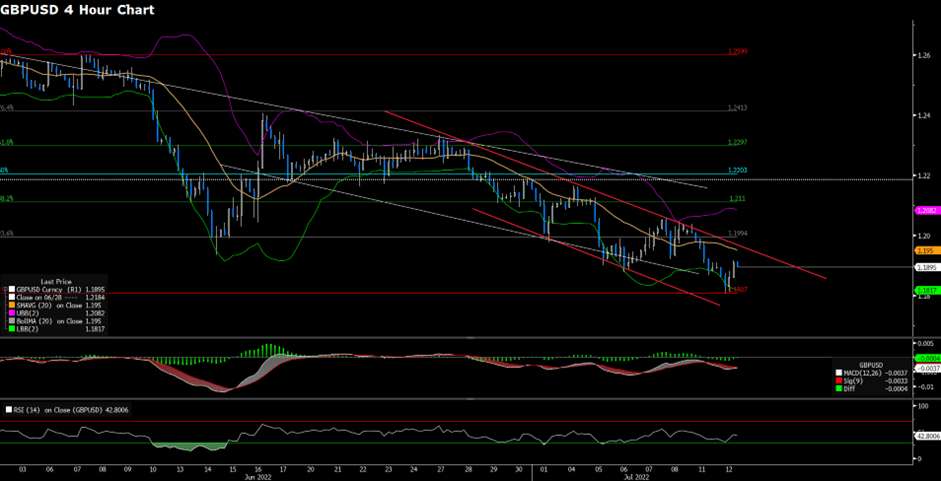
GBPUSD extends its recovery on Tuesday, trading above 1.1900 in the second half of the day. The US dollar faces some difficulties to advance the US CPI report. From the technical perspective, GBPUSD stages a modest recovery after hitting the pivotal support of 1.1807. The intraday outlook remains bearish as the pair still trades within the descending channel. The recent recovery might be a correction due to the RSI indicator on the four-hour chart falling into the oversold territory. To claim GBPUSD’s upside momentum, it has to advance above 1.1994. On the contrary, failure to defend the support level of 1.1807 would bring the pair further south.
Resistance: 1.1994, 1.2110, 12203
Support: 1.1807
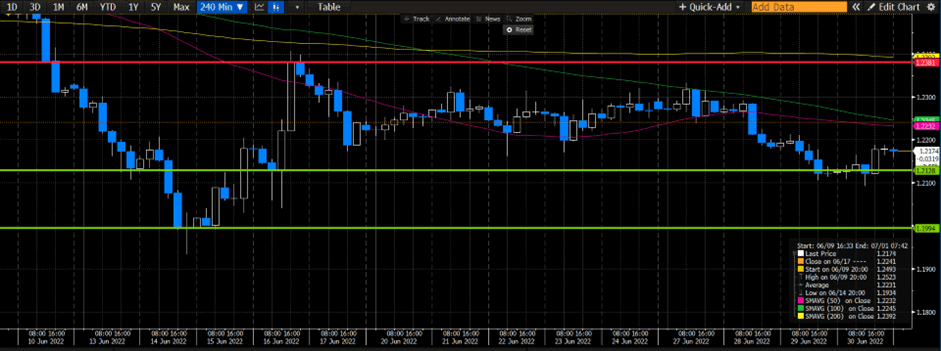
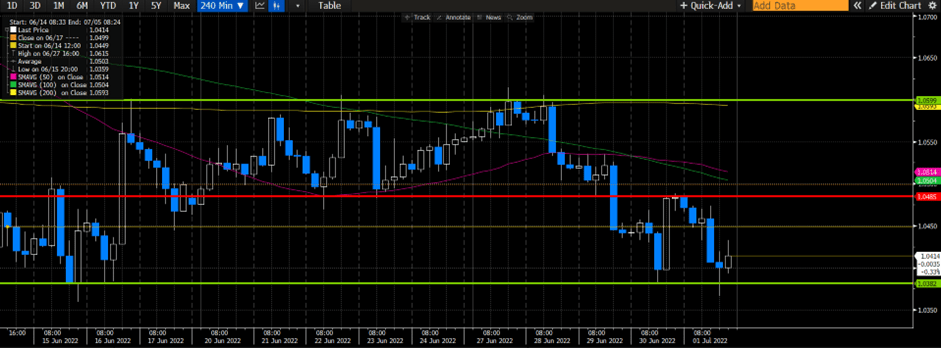
EURUSD (4-Hour Chart)
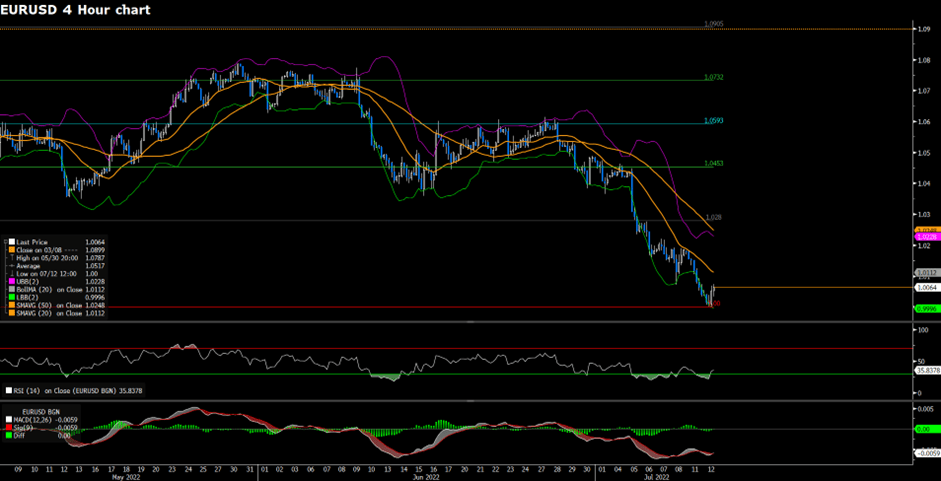
EURUSD was once trading as low as 1.0000 but has managed to climb into a positive move during the American trading session ahead of the US inflation data. From a technical point of view, EURUSD maintains its bearish stance as its lower leg has been built; however, the psychological support of 1.0000 would be hard to compromise. The recent advance could be EURUSD’s correction as the RSI indicator has reached the oversold territory, suggesting a pullback. To the upside, EURUSD would need to climb above the midline of the Bollinger Band to claim its bullish stance in the near-term picture.
Resistance: 1.028, 1.0453, 1.0593
Support: 1.0000
Economic Data
| Currency | Data | Time (GMT + 8) | Forecast |
| GBP | BoE Gov Bailey Speaks | 01:00 | |
| NZD | RBNZ Interest Rate Decision | 10:00 | 2.50% |
| NZD | RBNZ Rate Statement | 10:00 | |
| GBP | GDP (MoM) | 14:00 | 0.1% |
| GBP | GDP (YoY) | 14:00 | 2.7% |
| GBP | GDP (QoQ) | 14:00 | 0.0% |
| GBP | Manufacturing Production (MoM) (May) | 14:00 | 0.1% |
| GBP | Monthly GDP 3M/3M Change | 14:00 | 0.0% |
| USD | Core CPI (MoM) (Jun) | 20:30 | 0.6% |
| USD | CPI (YoY) (Jun) | 20:30 | 8.8% |
| CAD | BoC Monetary Policy Report | 22:00 | |
| CAD | BoC Interest Rate Decision | 22:00 | 2.25% |
| USD | Crude Oil Inventories | 22:30 | -1.933M |
| CAD | BOC Press Conference | 23:00 |