US stock closed flat on Friday after struggling for direction throughout the session as the strong US job report eased recession fears but further supported the case for a 75 bps rate hike by the Fed to fight inflation. Earlier in the North American session, the Nonfarm Payrolls report added 372K jobs to the economy in June, exceeding market estimations of 268K and fueled the Fed to stay aggressive to combat inflation.
Two of the Federal Reserve’s officials also said that they supported raising the interest rate by 75 basis points for the second month in a row. In the Eurozone, the consensus amongst ECB policymakers remained around a 25 bps rate hike. On top of that, the EU’s ongoing energy crisis kept weighing on the shared currency as the economy is likely to face a shortage of energy after prohibiting oil imports from Russia.
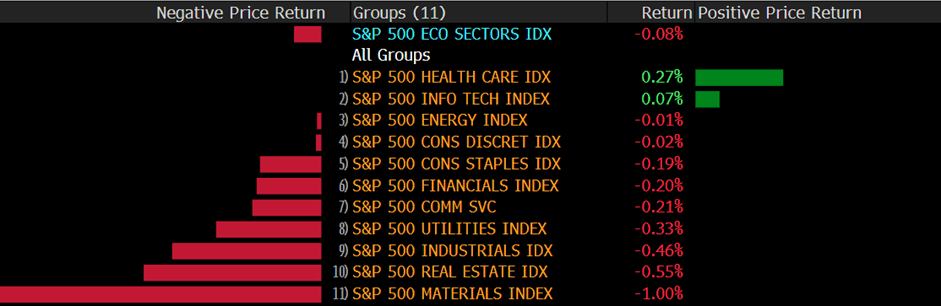
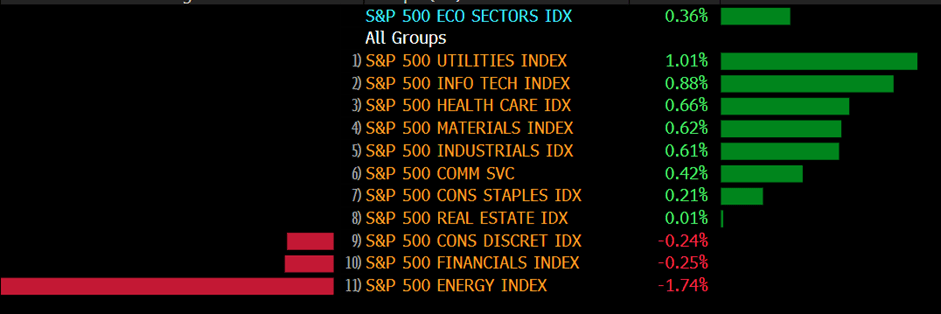
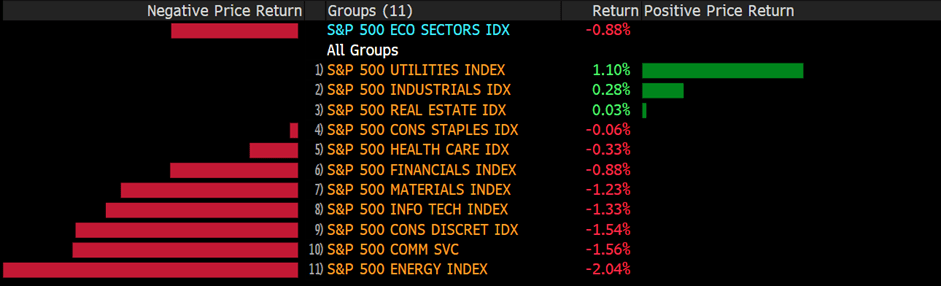
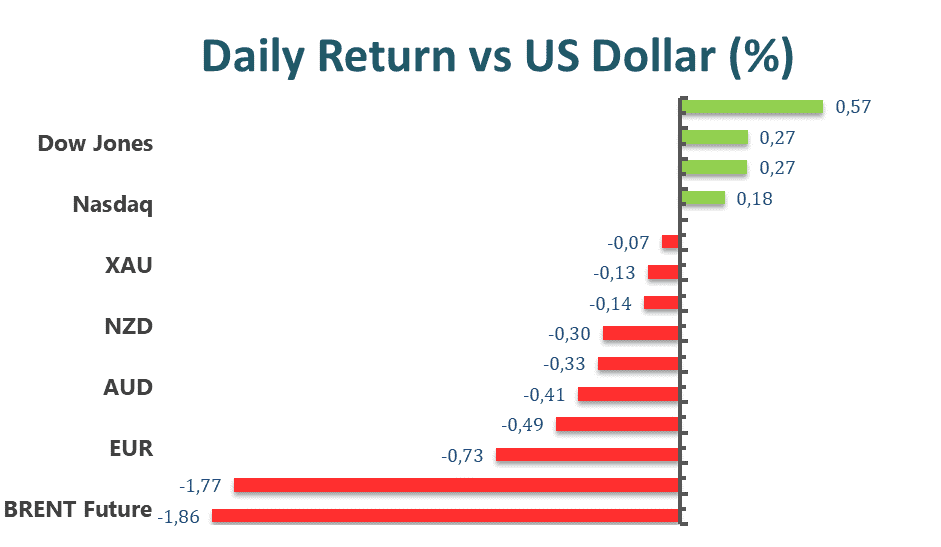
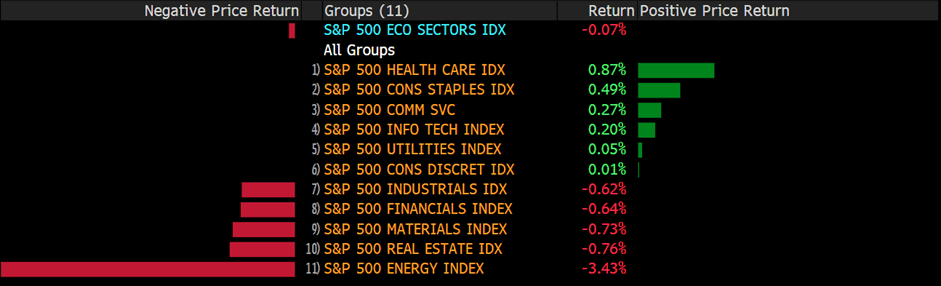
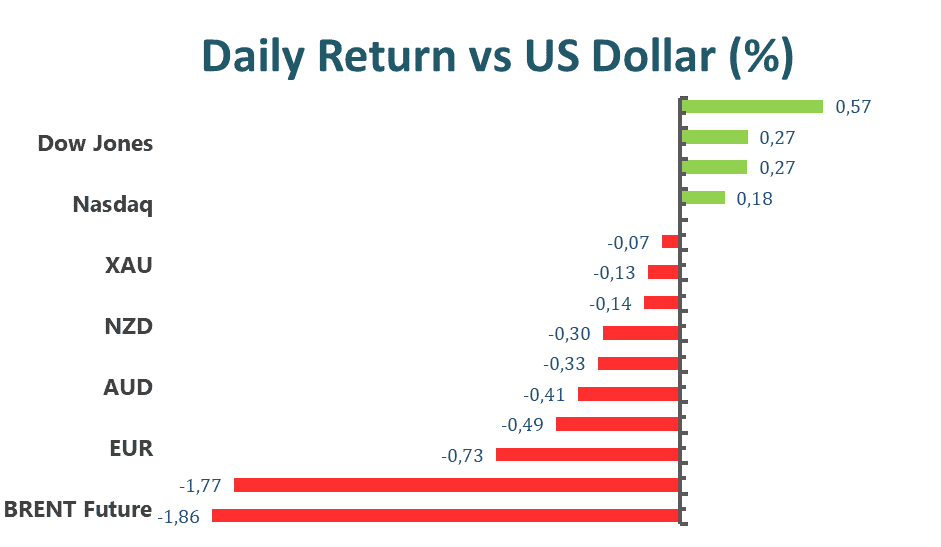
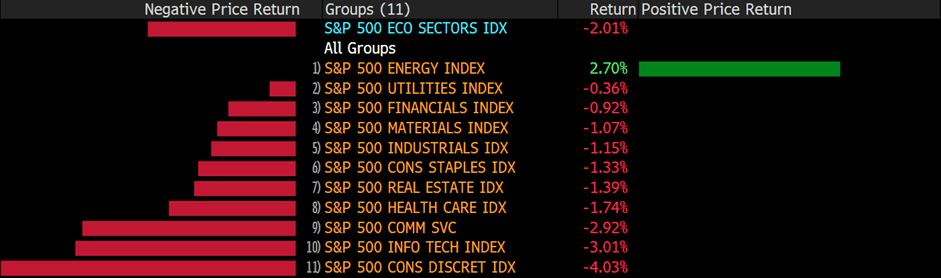
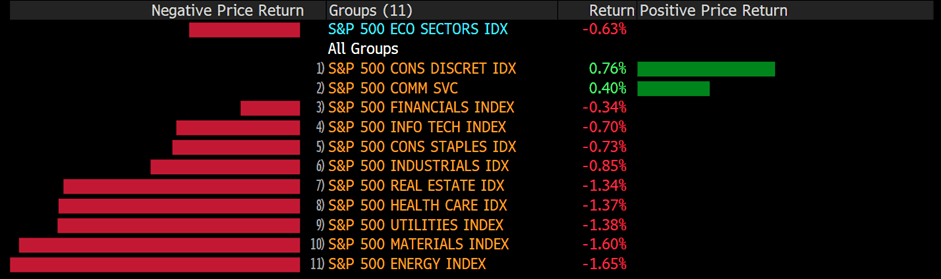
The benchmarks, S&P 500 and Nasdaq 100 both edged higher on Friday as market traders remain mixed on the upbeat job report. The S&P 500 was little changed on a daily basis and the Nasdaq 100 advanced with a 0.1% gain for the day. But nine out of eleven sectors stayed in negative territory as the materials and real estate sectors are the worst-performing among all groups, losing 1.00% and 0.55%, respectively. The Dow Jones Industrial Average meanwhile declined with a 0.1% loss on Friday and the MSCI World index rose 1.6%.

Main Pairs Movement
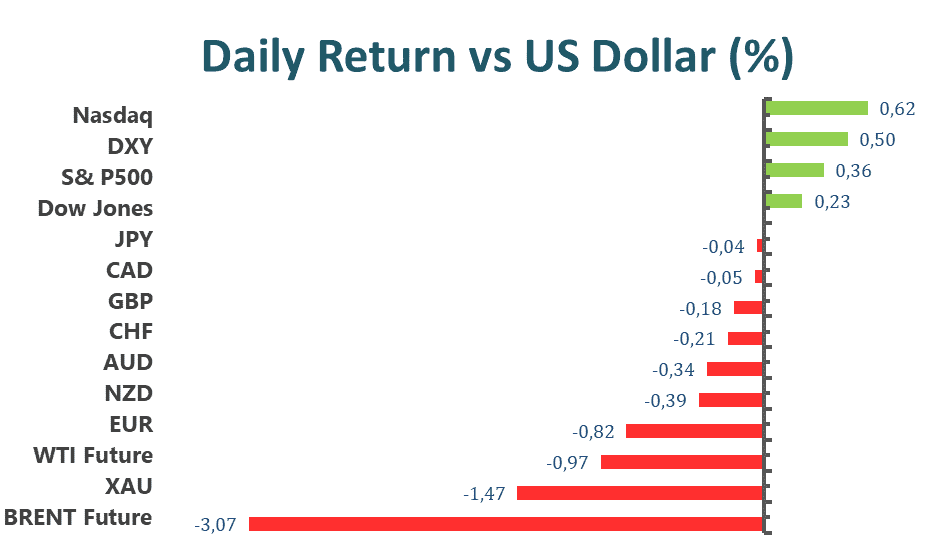
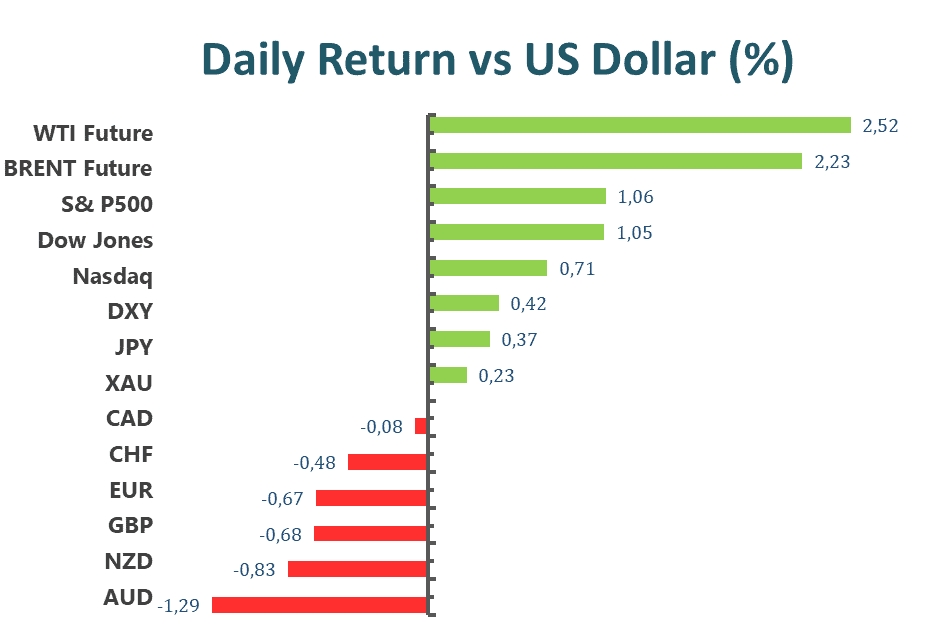
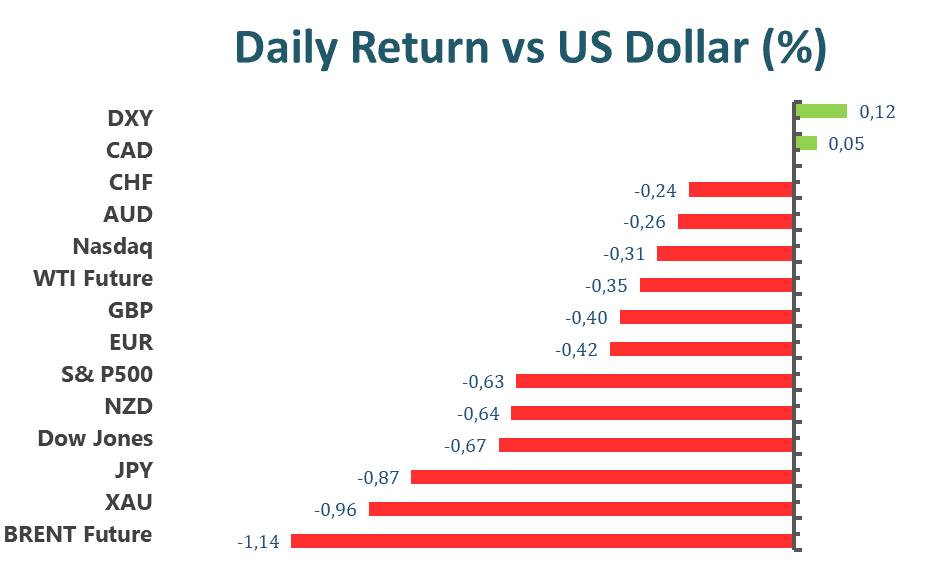
The US dollar edged lower on Friday, losing its upside traction and retreated back to the 106.9 level after the softer risk tone lend support to the safe-haven greenback. The DXY index witnessed heavy bullish momentum and was pushed higher to a daily high above 107.7 level in the early European session, but then started to see fresh selling meanwhile surrendering most of its daily gains. The market focus remained on the Fed’s normalisation process and the next moves regarding interest rates as June’s US Nonfarm Payrolls report exceeded expectations and reaffirmed the economy’s strength.
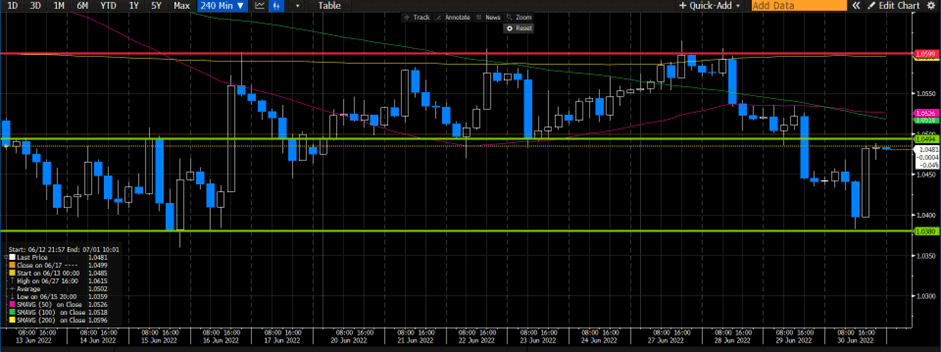
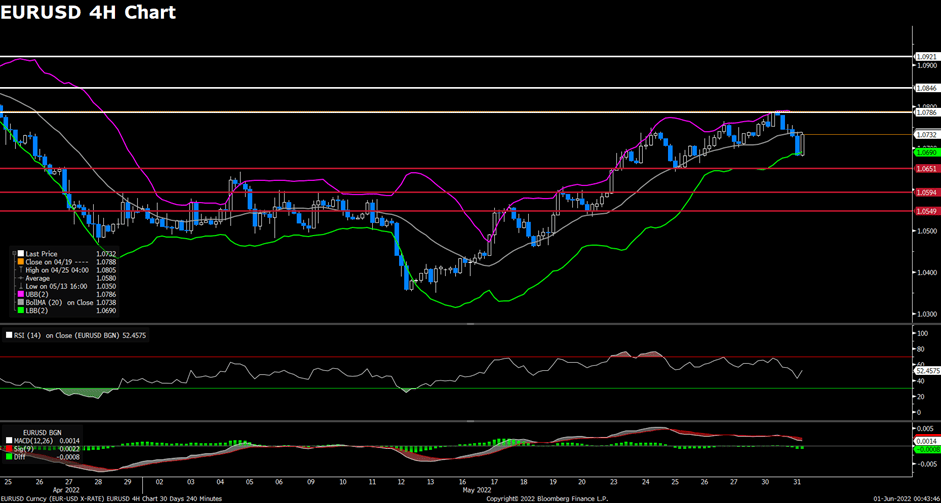
GBP/USD advanced slightly with a 0.08% gain on Friday amid the weaker US dollar across the board. But investors remain concerned that the UK government’s controversial Northern Ireland Protocol Bill could trigger a trade war with the European Union. The cable remained under bearish pressure and dropped to a daily low below the 1.193 mark, but then regained upside strength to recover all of its daily losses. Meanwhile, EUR/USD rebounded back after dropping to a fresh 20-year low at 1.0071 during the European session. The pair was up almost 0.30% for the day.
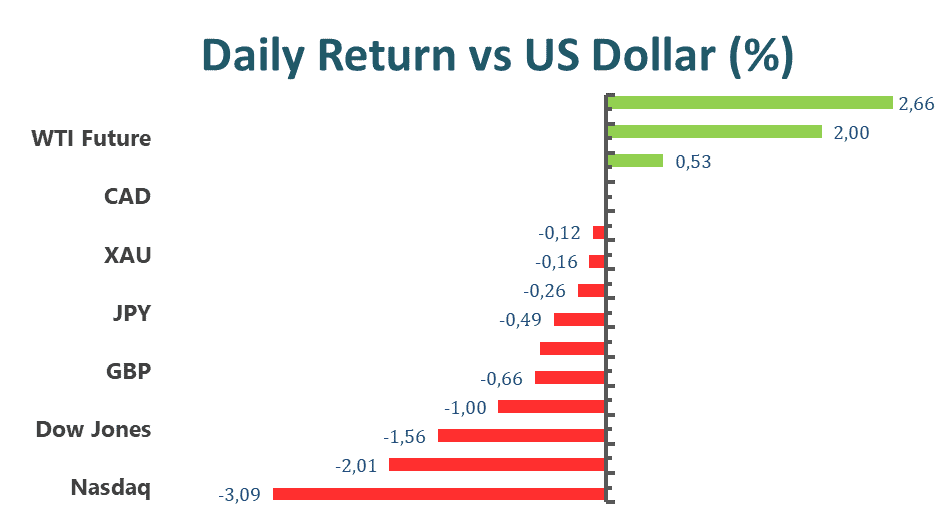
Gold advanced with a 0.12% gain for the day after touching a daily high above $1750 during the US trading session, despite the US dollar rising to fresh 20-year highs as US bond yields surged. Meanwhile, WTI oil climbed back toward the $105 area as supply fears amongst traders have spurred a rise in oil prices.
Technical Analysis
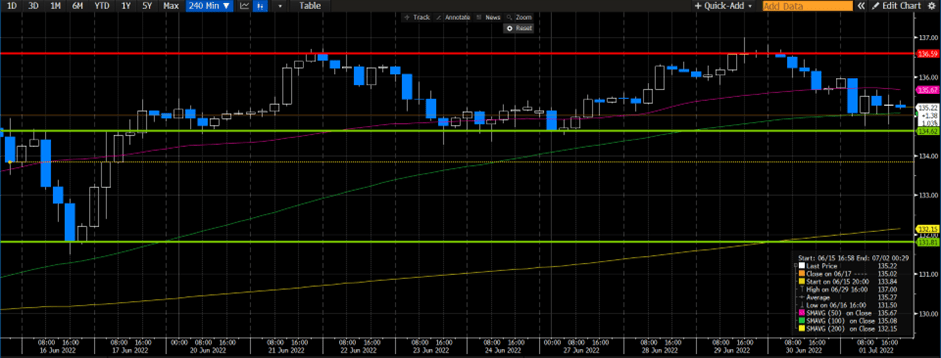
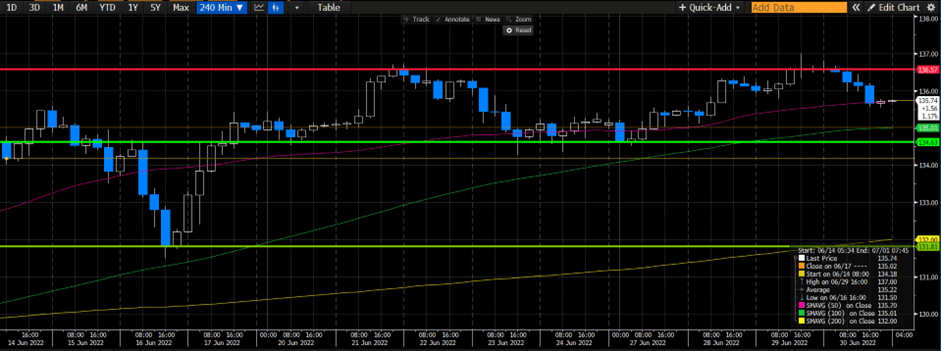
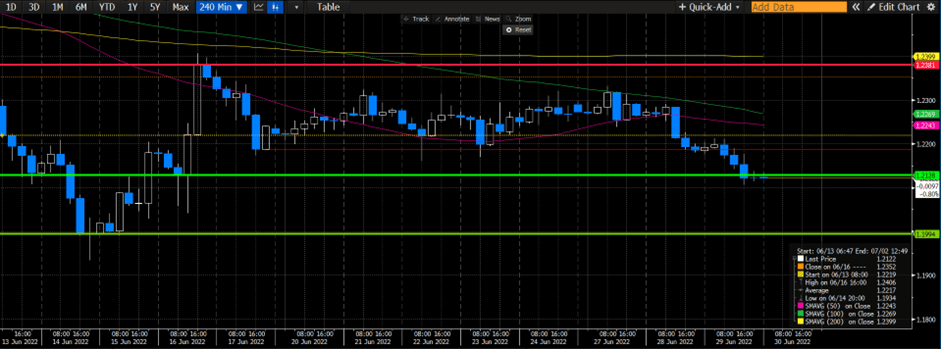
USDJPY (4-Hour Chart)
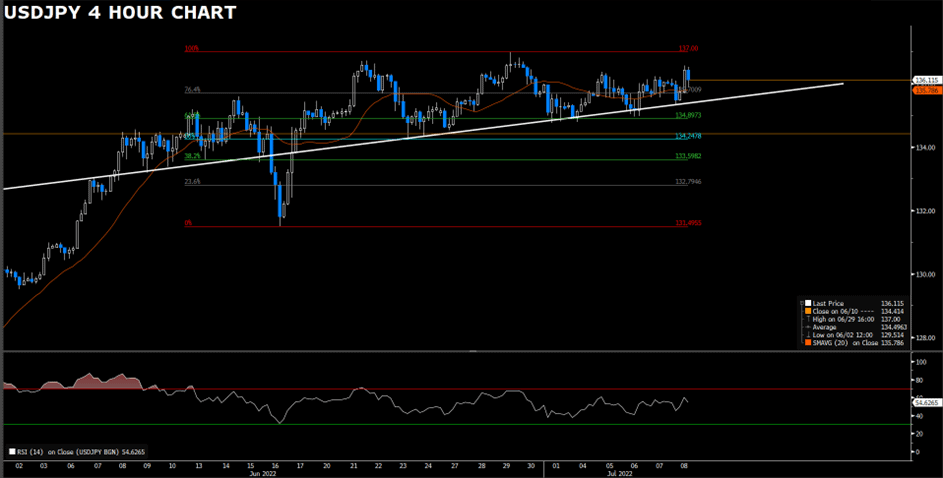
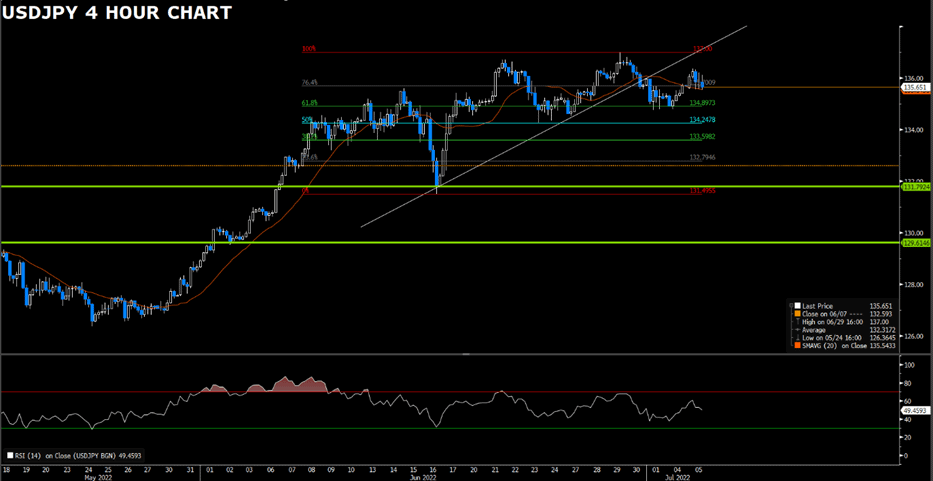
USDJPY oscillates amid the US economic data and the news of Japan ex- leader Shinzo Abe’s assassination. Technical speaking, the outlook remains positive on the four-hour chart. The US dollar remains supported by the fundamental backdrop and the technical perspective.
USDJPY got pushed higher with the formation of a higher high. The breakout of the resistance of 135.70 gives USDJPY an upside momentum toward the next resistance of 137.00. As the RSI indicator is still far from overbought, USDJPY is expected to trade higher. On the flip side, USDJPY needs to fall below the bullish trend line and the support of 134.89 in order to lose traction.
Resistance: 135.7, 137.00
Support: 134.89, 134.24, 133.59
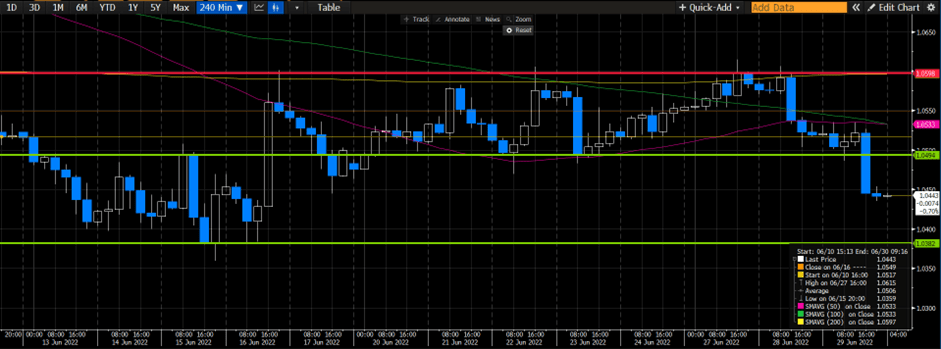
GBPUSD (4-Hour Chart)
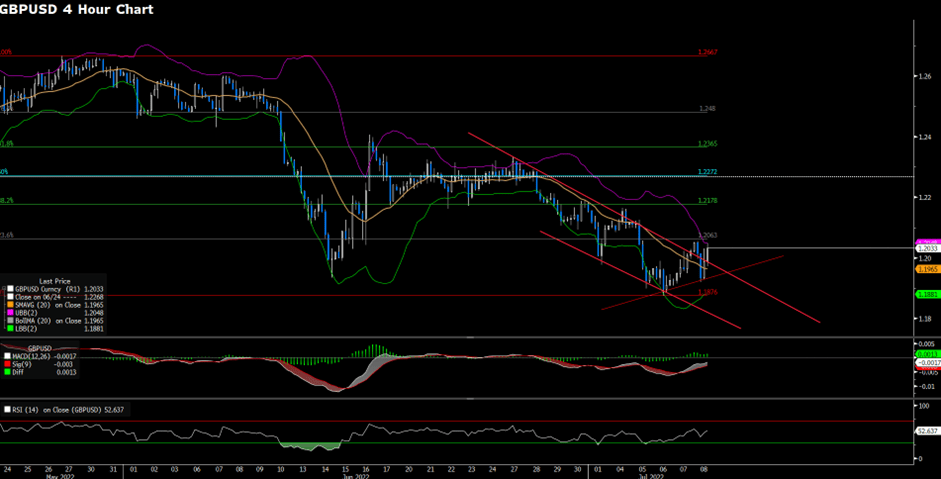
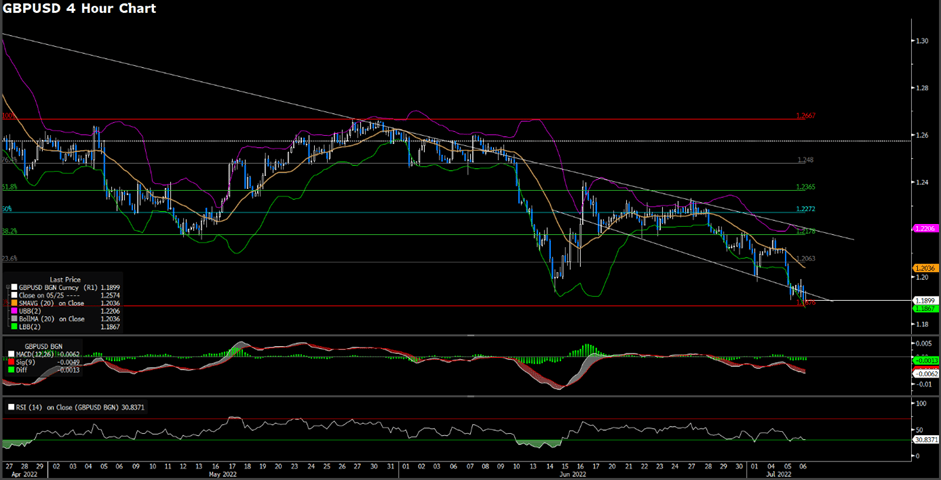
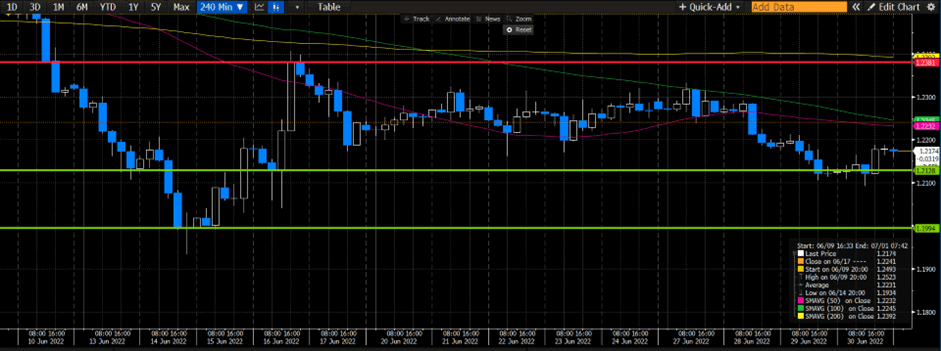
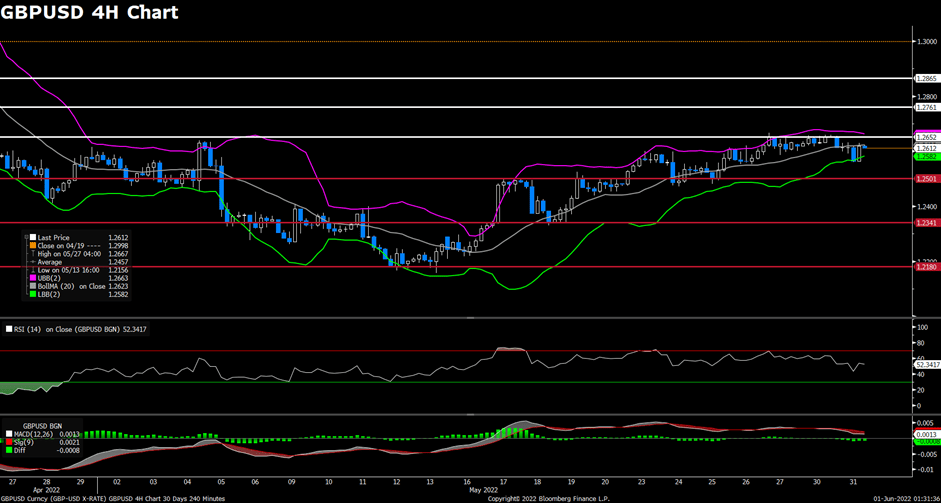
GBPUSD has managed to advance in positive territory above the descending channel. The upside movement of the currency pair witnesses risks sentiment, making it harder for the US dollar to preserve its strength despite better-than-expected Nonfarm Payrolls in June.
From the technical perspective, intraday’s upside momentum boosted GBPUSD above the midline of the Bollinger Band; in the meantime, GBPUSD has advanced above the bearish channel. Both suggest that GBPUSD manages to stage a positive rebound in the near- term. The acceptance above 1.2063 would confirm the positive shift. On the flip side, if GBPUSD fails to hold above the bearish channel and fails to breach the immediate resistance, then it could potentially stage back to negative territory. As both MACD and the RSI indicator are showing signs of bulls, GBPUSD is expected to head further north.
Resistance: 1.2063, 1.2178, 1.2272
Support: 1.1876
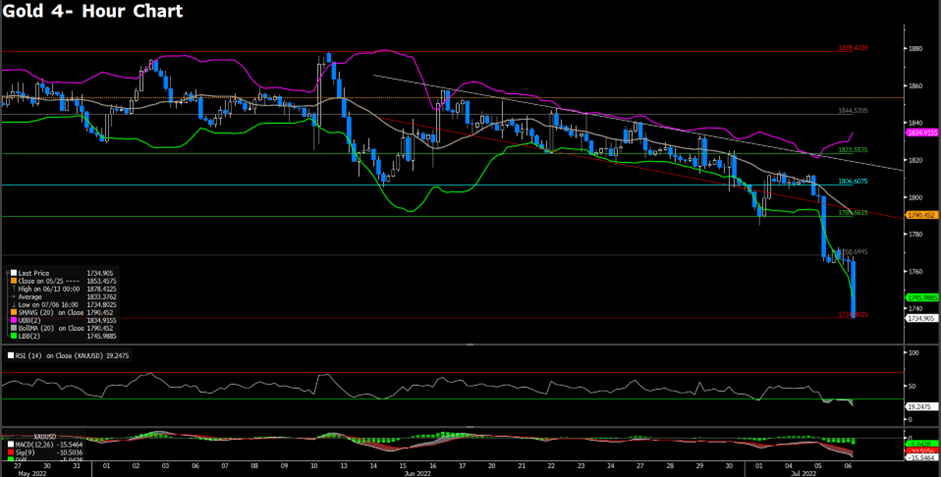
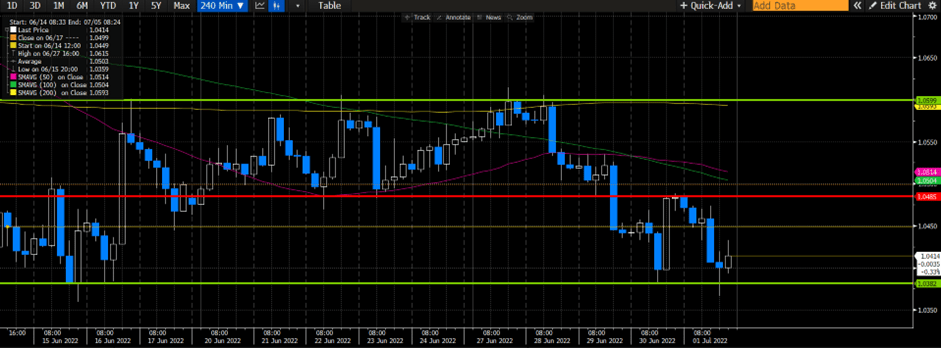
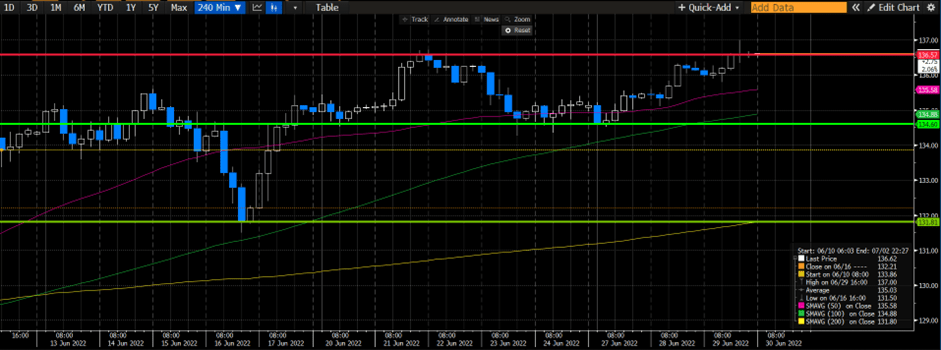
Gold (4-Hour Chart)
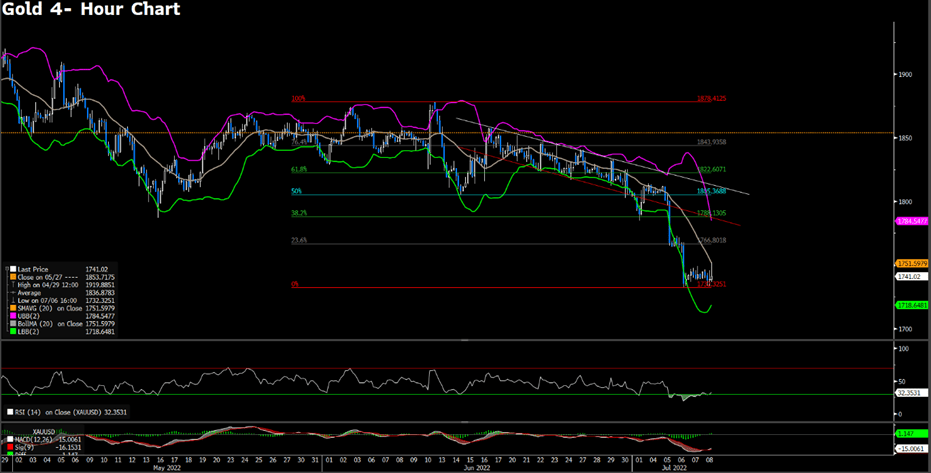
Gold edges slightly higher despite rising US yield and a better- than- expected US economic data.
From the technical aspect, gold clings slightly above the support level of 1732.32, trying to defend the last land before heading further south. The lower-low formation has given gold pressure, attracting some follow-through sellers. Current support would be robust as the RSI has reached the oversold territory and the MACD has slightly turned positive, giving some signs of attracting some dip- buyers. If the support ends up failing to defend, then more selling pressures would come into play.
Resistance: 1766.80, 1788.13, 1805.36
Support: 1732.32
Economic Data
| Currency | Data | Time (GMT + 8) | Forecast | |
| All Day | Singapore Holiday | |||
| NZD | Electronic Card Retail Sales (MoM) (Jun) | 06:45 | ||
| BRL | BCB Focus Market Readout | 19:25 |