Stock Market Reacts to Inflation Data, Dollar Index Fluctuates

On Wednesday, the U.S. stock market saw mixed performances, with the Dow Jones Industrial Average declining by 0.20% to 34,575.53, while the S&P 500 managed a slight uptick of 0.12%, and the Nasdaq Composite rose by 0.29%. These moves were in response to a surprising increase in August’s core inflation, which exceeded expectations, prompting concerns. In the currency market, the U.S. dollar initially gained strength due to the inflation data but later reversed course as core CPI figures aligned with forecasts. This led to a perception of disinflationary pressure and eliminated the possibility of an immediate Fed interest rate hike. Treasury yields attracted buying interest but fell short of this year’s peaks. Notably, EUR/USD declined, and the ECB meeting is closely watched with a 64% probability of an ECB rate hike priced in. USD/JPY showed resilience, and the Australian dollar remained flat, while the offshore yuan gained amid hopes of stabilizing financial and economic conditions in China.

Stock Market Updates

On Wednesday, the Dow Jones Industrial Average experienced a decline of 70.46 points, equivalent to a 0.20% drop, settling at 34,575.53, marking its second consecutive day of losses. In contrast, the S&P 500 managed a slight uptick of 0.12%, reaching 4,467.44, while the Nasdaq Composite saw a more significant gain, rising by 0.29% to conclude the day at 13,813.59. Within the Dow, CNBC and 3M bore the brunt of losses, with a sharp drop of over 5.7%, followed by Caterpillar, which saw its shares dip by 2%. Meanwhile, Apple shares declined for a second consecutive day, falling by more than 1%. Conversely, the tech sector bolstered the S&P 500 and Nasdaq, with Tesla shares gaining 1.4% as billionaire investor Ron Baron expressed optimism about the electric vehicle maker. Amazon shares also surged, reaching their highest level since August 2022, with an increase of over 2.5%.

The market reaction came in response to a surprising increase in August’s core inflation print within the consumer price index. The core inflation, which excludes volatile food and energy prices, rose by 0.3%, surpassing expectations for a 0.2% increase, and stood at 4.3% year-on-year, meeting forecasts. Federal Reserve officials typically focus on the core inflation number as it offers a more reliable indication of long-term inflation trends. In contrast, the headline numbers, including all components, increased by 0.6% in the past month and were up 3.7% compared to the same period last year. Economists surveyed had anticipated smaller increases of 0.6% and 3.6%, respectively. Although the unsettling inflation report raised concerns, experts believe the Federal Reserve is unlikely to take immediate action, with market participants not expecting any moves until November. Currently, Wall Street appears to have factored in a pause in interest rate hikes, with a 97% probability of rates remaining unchanged at the Fed’s upcoming meeting, according to CME FedWatch Tool data.

Data by Bloomberg

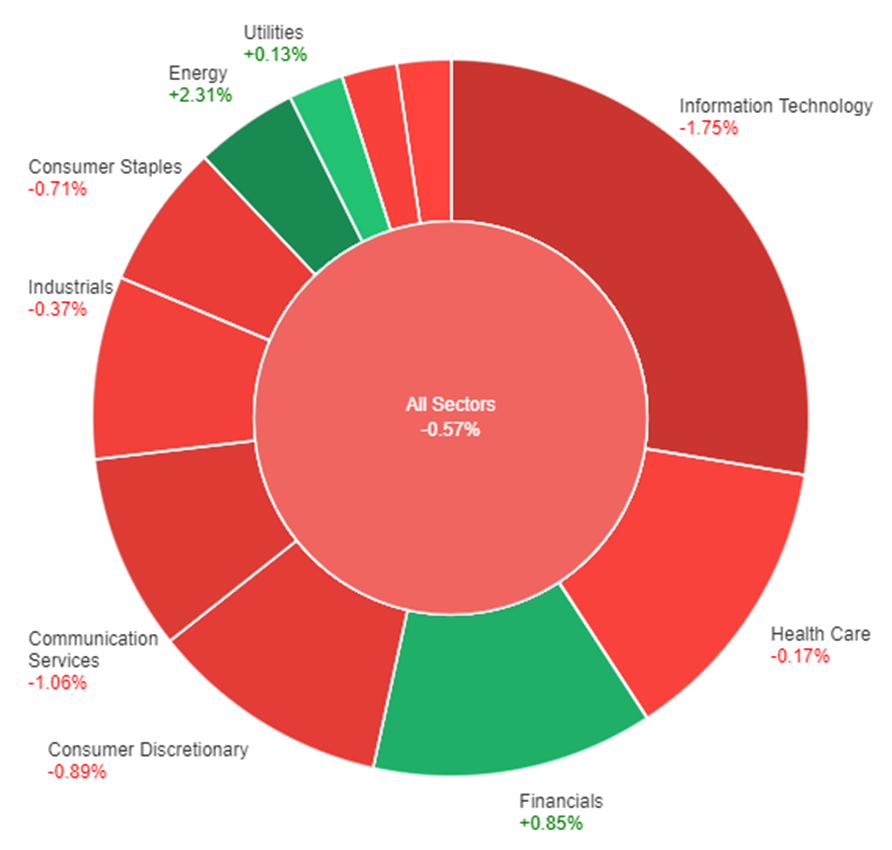
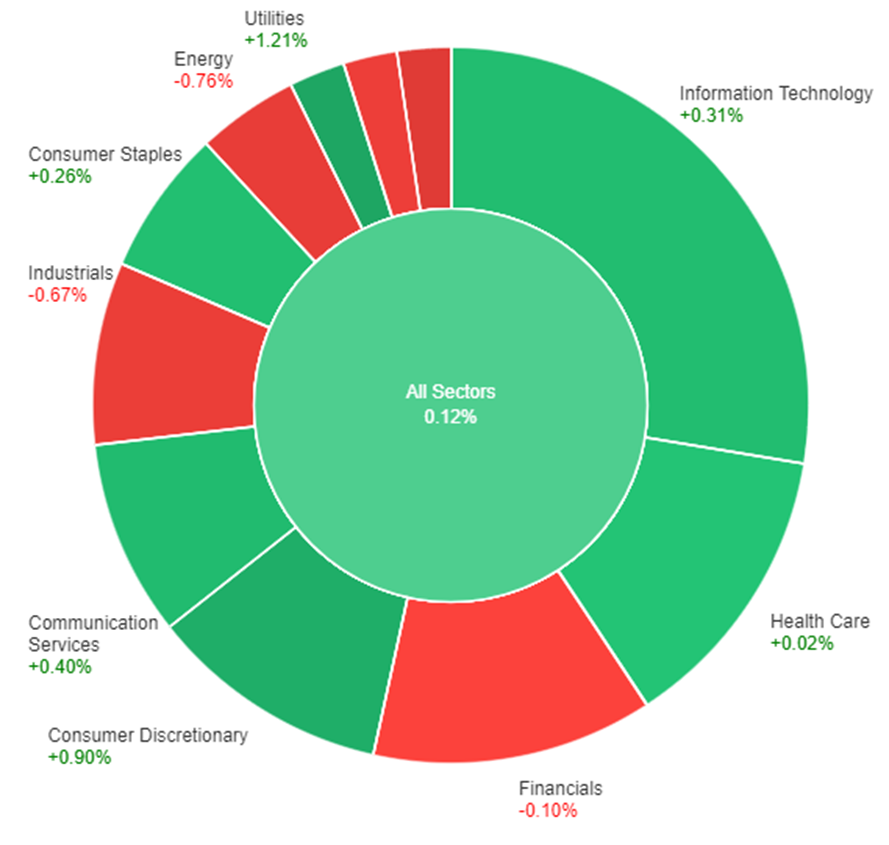
On Wednesday, the overall market saw a modest gain of 0.12%. Among the sectors, Utilities performed the best with a significant increase of 1.21%, followed by Consumer Discretionary, which rose by 0.90%. Communication Services and Information Technology also showed positive momentum, with gains of 0.40% and 0.31%, respectively. Consumer Staples and Health Care had smaller increases of 0.26% and 0.02%. However, Financials experienced a slight decline of -0.10%. The Materials sector saw a more notable decrease of -0.59%, while Industrials and Energy had more substantial losses of -0.67% and -0.76%, respectively. Real Estate was the weakest performing sector, declining by -1.03% on Wednesday.

Currency Market Updates

The currency market reacted to the U.S. CPI data with a cautious stance, as traders had entered the session with an excessively short position in Treasuries and a strong long position in the U.S. dollar. The dollar index initially saw gains following a higher-than-expected increase in core CPI and an above-forecast overall rise compared to the previous year. However, the core CPI figure fell to 4.3% from the August reading, aligning with forecasts, which led to a perception of disinflationary pressure, eliminating the possibility of a Fed interest rate hike in the near term. Two- and 10-year Treasury yields, which had approached their highest levels of the year, attracted significant buying interest but failed to surpass those peaks.

Meanwhile, in the currency pairs, EUR/USD experienced a 0.14% decline but remained above its Wednesday low. This was partly supported by higher bund-Treasury yield spreads. The market is closely watching the ECB meeting, with a 64% probability of an ECB rate hike priced in after being below 50% just a day earlier. Sterling remained relatively stable, recovering from an initial dip due to disappointing data and a subsequent drop following the U.S. CPI release. USD/JPY saw a 0.18% rise, showing resilience to the drop in Treasury yields, as concerns about a potential BoJ rate hike or FX intervention by the Ministry of Finance (MoF) receded. However, the path to higher prices in this pair depends on a resumption of the uptrend in Treasury yields. The Australian dollar remained flat, while the offshore yuan gained 0.4% on hopes of China’s FX actions and housing stimulus efforts stabilizing the financial and economic landscape amid growth concerns.

Picks of the Day Analysis
EUR/USD (4 Hours)

EUR/USD Holds Steady Ahead of ECB Meeting Amid Uncertainty

The EUR/USD maintained its position unaffected by the release of US consumer inflation data, trading within a familiar range with support around 1.0700. All eyes are now on the upcoming European Central Bank (ECB) meeting, which holds the potential to spark significant market movements due to the lack of consensus on policy actions. Reports suggest the ECB may raise its inflation forecast, fueling speculation about a rate hike. The ECB faces a dilemma between a rate hike and a pause, given economic conditions and persistent inflation. The outcome will be crucial, with potential implications for the Euro’s performance, while important US data releases could add to volatility in the days ahead.

Chart EURUSD by TradingView

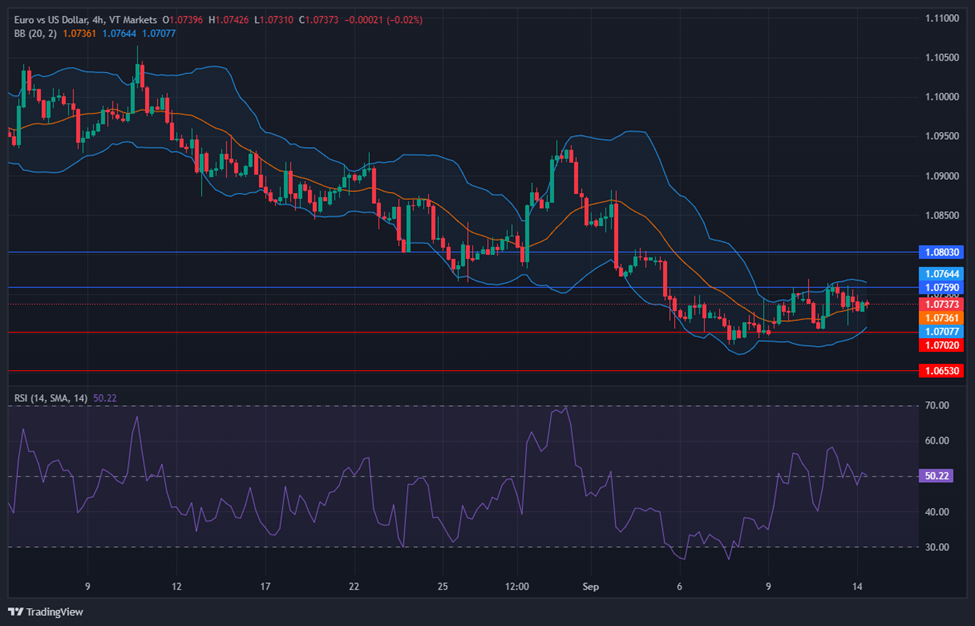
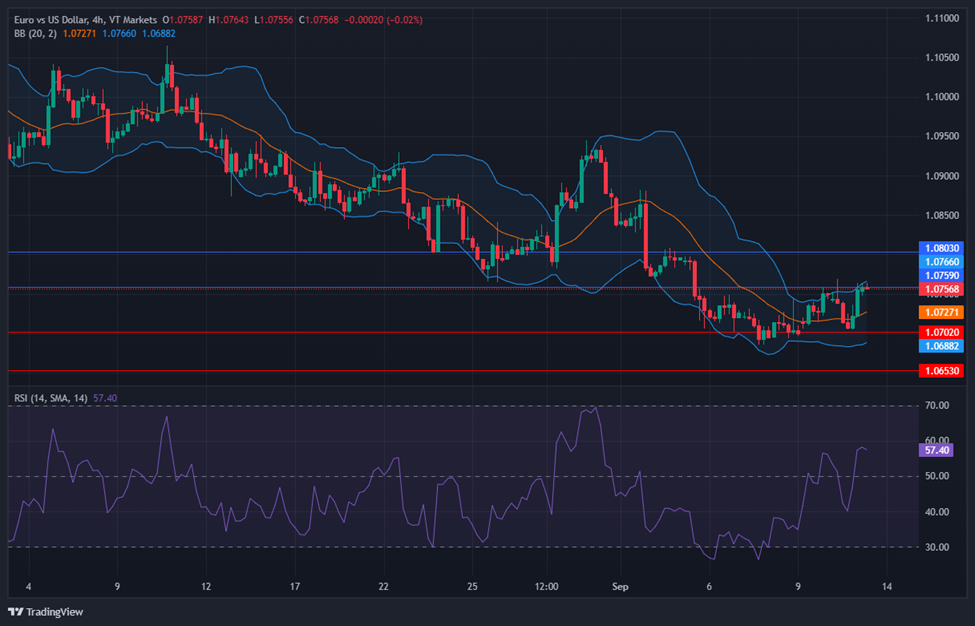
According to technical analysis, EUR/USD moved flat on Wednesday and is currently trading just around the middle band of the Bollinger Bands. This movement suggests the possibility of further consolidation. The Relative Strength Index (RSI) is currently at 50, indicating that EUR/USD is in a neutral stance.

Resistance: 1.0759, 1.0803

Support: 1.0702, 1.0653

XAU/USD (4 Hours)

XAU/USD Slips as US Inflation Data Fails to Spark Dollar Rally

Gold traded around $1,910 in the American afternoon, marking its second consecutive day of losses. Earlier in the day, major assets remained within familiar ranges as investors awaited the release of US inflation figures. The Consumer Price Index (CPI) report for August showed a 0.6% MoM increase and a 3.7% YoY rise, surpassing market expectations, leading to an initial rally in the US Dollar. However, the Dollar’s gains were short-lived as the CPI readings were not strong enough to trigger a hawkish response from the Federal Reserve. Meanwhile, US indexes held modest gains, and US Treasury yields saw some uptick. Attention now turns to the European Central Bank (ECB) meeting, where expectations for a rate hike collide with economic challenges in the Euro Zone, leaving financial markets in a cautious state.

Chart XAUUSD by TradingView

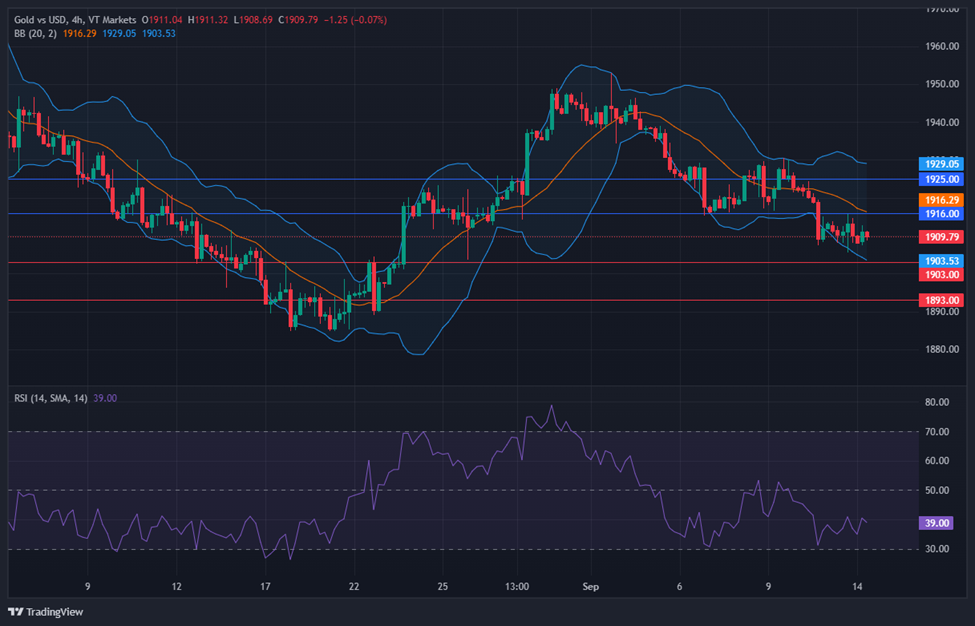
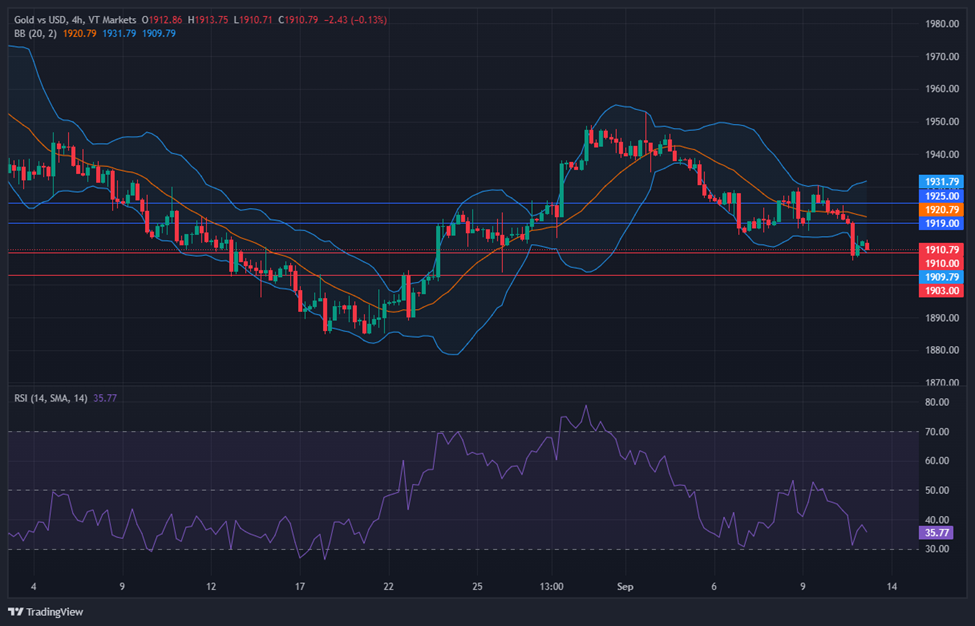
According to technical analysis, XAU/USD moved flat on Wednesday and moving between the lower and middle band of the Bollinger Bands. Currently, the price is trading slightly above the lower band with the potential for further downward movement. The Relative Strength Index (RSI) is currently at 39, indicating that the XAU/USD pair is still biased towards the bearish side.

Resistance: $1,916, $1,925

Support: $1,903, $1,893

Economic Data
CurrencyDataTime (GMT + 8)Forecast
AUDEmployment Change09:3064.9K (Actual)
AUDUnemployment Rate09:303.7% (Actual)
EURMain Refinancing Rate20:154.25%
EURMonetary Policy Statement20:15 
USDCore PPI m/m20:300.2%
USDCore Retail Sales m/m20:300.4%
USDPPI m/m20:300.4%
USDRetail Sales m/m20:300.1%
USDUnemployment Claims20:30226K
EURECB Press Conference20:45 

指数产品交易时间调整通知 – 2023年09月13日

尊敬的用户:

您好!

为提供更好的交易环境与因应市场变化,VT Markets 将于2023年9月18日调整 CHINA50 产品的交易时间。

详请参考如下:

注意:以上数据仅供参考,实际执行数据有可能会有变动,具体请依据MT4/MT5软件为准。

温馨提醒::

本次调整除交易时间之外,产品的其他所有交易细则维持不变

如您有任何疑问,我们的团队将十分乐意为您解答。

请留言或发邮件至 [email protected] 或联系在线客服。

Nasdaq Slips as Oracle’s Plunge Ripples Through Tech Stocks, US Dollar Index Gears Up for Key Inflation Data

In a mixed day for the financial markets, the Nasdaq Composite faced a 1.04% decline on Tuesday, spurred by Oracle’s sharp 13.5% drop following disappointing results. This decline, though not a massive stock, reflects broader business spending trends and impacted both the Nasdaq and the S&P 500. Meanwhile, tech giants like Apple and Adobe also saw their share prices decline. On the energy front, U.S. crude oil prices hit their highest level since last November, boosting energy stocks. In the currency market, the US Dollar Index showed a modest increase as investors awaited the release of the August US Consumer Price Index (CPI), which is expected to influence Federal Reserve monetary policy expectations. The week also holds key inflation data with the Producer Price Index (PPI) scheduled for Thursday. In the UK, mixed labor market data pointed to economic challenges, while in currency trading, the Pound weakened amid uncertainties. The EUR/USD pair faces upcoming Eurozone Industrial Production data and the European Central Bank’s meeting.

Stock Market Updates

On Tuesday, the Nasdaq Composite experienced a 1.04% decline, marking its first day of losses in three days. This drop was primarily driven by the sharp decline in Oracle shares, which tumbled 13.5% following disappointing quarterly results and a lackluster revenue forecast. This setback in Oracle, while not a massive stock, is indicative of larger business spending trends, impacting both the Nasdaq and the S&P 500. Additionally, other tech giants like Amazon, Alphabet (Google’s parent company), and Microsoft also saw their stock prices slide.

Meanwhile, Apple’s shares fell by 1.7% after the announcement of a new iPhone model, and Adobe’s shares dropped approximately 4% ahead of its upcoming earnings report. On a different note, U.S. crude oil prices reached their highest level since November of the previous year, driven by OPEC’s optimistic demand growth forecast. This surge in oil prices provided a boost to energy stocks, with Chevron and Exxon Mobil both seeing gains of about 1.9% and 2.9%, respectively. Investors are now closely watching key inflation data set to be released later this week, along with the European Central Bank’s interest rate decision on Thursday.

Investors eagerly await the release of key inflation data later this week, especially following a series of stronger-than-expected economic indicators from the previous week, which raised concerns about the possibility of the Federal Reserve increasing rates more than previously anticipated.

Data by Bloomberg

On Tuesday, the overall market slipped by 0.57%, with notable sector performance variations. Energy surged by 2.31%, and financials gained 0.85%, while utilities and real estate had slight gains of 0.13% and -0.03%, respectively. In contrast, information technology saw a substantial 1.75% drop, and communication services declined by 1.06%. Consumer discretionary, industrials, materials, and health care sectors faced moderate declines ranging from -0.17% to -0.89%, while consumer staples decreased by 0.71%. These sector-specific movements contributed to the market’s overall decline.

Currency Market Updates

The US Dollar Index saw a modest uptick on Tuesday, nearing 105.00 before retracing, with markets relatively calm as they awaited crucial US data. The highlight of the week, the August US Consumer Price Index (CPI), is scheduled for release on Wednesday. It’s expected to show an annual rate rebound from 3.2% to 3.6%, while the Core rate may slow down from 4.7% to 4.3%. These figures are poised to influence expectations about the Federal Reserve’s monetary policy, likely leading to increased volatility. Thursday will bring more inflation data with the Producer Price Index (PPI).

In the UK, mixed labor market data signaled a deteriorating economic situation, as the unemployment rate rose to 4.3% – the highest since September 2021 – accompanied by a decline in employment by 207K. Despite average hourly weekly earnings exceeding expectations at 8.5%, the Pound weakened. The GBP/USD pair approached its monthly low before rebounding toward 1.2500. Meanwhile, the EUR/USD pair reached a weekly high at 1.0769 and has Eurozone Industrial Production data scheduled for Wednesday, along with the European Central Bank’s Governing Council meeting on Thursday.

Picks of the Day Analysis
EUR/USD (4 Hours)

EUR/USD Sees Modest Pullback Ahead of Key Economic Data and ECB Meeting

The EUR/USD pair experienced a moderate pullback on Tuesday, initially spiking to 1.0769 during the Asian session, its highest level in a week, before retracing while still holding above the 1.0700 mark. Investors are eagerly awaiting the release of US consumer inflation data and the European Central Bank (ECB) meeting.

The market received mixed signals from Germany, with the current condition index dropping to -79.4, its lowest point since August 2020, and the expected index coming in at -11.4, surpassing the forecast of -15.0. These indicators contribute to concerns about a potential recession in Germany and the Eurozone, impacting expectations regarding an ECB rate hike. Market pricing suggests a nearly 50% probability of a rate hike on Thursday, but most analysts anticipate at least one 25 basis points rate hike by year-end. The economic outlook of the Eurozone, in contrast to the more resilient US economy, remains a critical factor influencing the direction of the EUR/USD pair, with the US Consumer Price Index (CPI) report on Wednesday poised to play a pivotal role in shaping market sentiment.

Chart EURUSD by TradingView

According to technical analysis, EUR/USD moved higher on Tuesday and is currently trading just below the upper band of the Bollinger Bands. This movement suggests the possibility of further continuation to the upside, potentially pushing towards the upper band. The Relative Strength Index (RSI) is currently at 57, indicating that EUR/USD is in a neutral stance with a slight bullish bias.

Resistance: 1.0759, 1.0803

Support: 1.0702, 1.0653

XAU/USD (4 Hours)

XAU/USD Dips Amid Dollar Demand but Recovers Slightly as Markets Await US CPI Data

Gold prices saw a decline on Tuesday, influenced by renewed demand for the US Dollar, as XAU/USD dropped to $1,907.53 per troy ounce. The decline in the precious metal was most pronounced during European trading hours, as weak local data raised concerns about economic setbacks in the United Kingdom and the Euro Zone.

However, the mood improved as Wall Street opened, with local indexes outperforming their international counterparts. The Dow Jones Industrial Average was in positive territory, while the S&P500 and the Nasdaq Composite posted minor losses. XAU/USD managed to recover some of its earlier losses, trading at approximately $1,912 per troy ounce.

Speculative traders are exercising caution in anticipation of significant events scheduled for the latter part of the week, refraining from making strong commitments. Nevertheless, Gold has been among the weakest performers against the US Dollar this week. Attention now turns to the United States (US) Consumer Price Index (CPI), which is expected to rise by 0.6% MoM and 3.6% YoY, surpassing July’s figures. Higher-than-expected CPI numbers could fuel speculation about an impending Federal Reserve (Fed) rate hike, benefiting the USD in a risk-averse environment. Conversely, if CPI figures fall short of market expectations, markets may turn notably optimistic.

Chart XAUUSD by TradingView

According to technical analysis, XAU/USD moved lower on Tuesday and reached the lower band of the Bollinger Bands. Currently, the price is trading slightly above the lower band with the potential for further downward movement. The Relative Strength Index (RSI) is currently at 35, indicating that the XAU/USD pair is still biased towards the bearish side.

Resistance: $1,919, $1,925

Support: $1,910, $1,903

Economic Data
CurrencyDataTime (GMT + 8)Forecast
GBPGDP m/m14:00-0.2%
USDCore CPI m/m20:300.2%
USDCPI m/m20:300.6%
USDCPI y/y20:303.6%

Unlocking Forex Chart Secrets: Your Trading Education, Part 2

Read Part 1 of this article to learn about the purpose of charts in Forex trading, different chart types, and how to use line charts.

Bar Charts (OHLC) 

OHLC stands for Open, High, Low, and Close. Bar charts are a widely used type of Forex chart that display these four key price points for each time period. They are represented as vertical bars, and each bar provides a comprehensive view of price movements within that specific timeframe. 

Here’s a breakdown of the components of a bar on a bar chart: 

  • Open Price: The top of the vertical bar represents the opening price of the currency pair at the beginning of the chosen time period. 
  • High Price: The top point or “spike” of the vertical bar indicates the highest price reached during that time period. 
  • Low Price: The lowest point or “dip” of the vertical bar represents the lowest price reached during that time period. 
  • Close Price: The bottom of the vertical bar represents the closing price of the currency pair at the end of the chosen time period. 

Bar charts are valuable for traders who want a more detailed understanding of price movements. They provide a holistic picture of what happened within a given timeframe. 

source: Britannica

How to Read and Interpret Bar Charts 

Reading and interpreting a bar chart involves analysing each bar to understand the dynamics of the market during that specific time period. Here’s how you can read and interpret a bar chart: 

  • Open to Close: The vertical length of the bar represents the price range between the opening and closing prices for that period. A longer bar indicates a larger price range. 
  • High and Low: The “spike” at the top and the “dip” at the bottom of the bar show the highest and lowest prices reached during the period. 
  • Market Sentiment: Analysing the relationship between the opening and closing prices can help you gauge market sentiment. If the closing price is higher than the opening price, it suggests bullish sentiment (buying pressure). Conversely, if the closing price is lower than the opening price, it indicates bearish sentiment (selling pressure). 
  • Patterns and Trends: By observing patterns in multiple bars, traders can identify trends, reversals, and potential trading opportunities. 

In summary, bar charts are a powerful tool for traders seeking detailed insights into price movements. While they may seem complex at first, they are worth exploring as you gain experience in Forex trading. 

Candlestick Charts 

Candlestick charts are a highly visual and popular way to represent price movements in Forex trading. They use “candles” to provide a comprehensive view of the opening, high, low, and closing prices within a specific timeframe. 

Here’s a breakdown of the key elements of a candlestick: 

  • Body: The central and thicker part of the candlestick is known as the “body.” The body represents the price range between the opening and closing prices for the given time period. 
  • Wicks or Shadows: Thin lines extending above and below the body are called “wicks” or “shadows.” These wicks represent the highest and lowest prices reached during the same time period. 
  • Colour: Candlestick charts use colour to convey valuable information about price movement during the timeframe. Typically, candles are coloured green or red, but this can vary depending on your chart settings and platform. 
source: investopedia.com

How to Read and Interpret Candlestick Charts 

Reading and interpreting candlestick charts involve understanding the relationship between the body, wicks, and their colours. Here’s how you can read and interpret a candlestick: 

  • Body and Wick Length: The length of the body and the wicks provides insights into price volatility. A longer body or wick signifies greater price movement during the timeframe. 
  • Green (Bullish) and Red (Bearish): In most cases, a green (or white) candle represents a bullish candlestick, indicating that the closing price is higher than the opening price. Conversely, a red (or black) candle represents a bearish candlestick, signifying that the closing price is lower than the opening price. 
  • Upper and Lower Shadows: The upper shadow extends from the top of the body to the high price, while the lower shadow extends from the bottom of the body to the low price. These shadows illustrate the price range’s extremes during the timeframe. 
  • Patterns: Candlestick charts are renowned for their ability to reveal specific patterns, such as doji, hammer, and engulfing patterns. Traders often use these patterns to predict market reversals or continuations. 

In summary, candlestick charts are a powerful tool for traders seeking a visually engaging way to analyse price movements. Their ability to reveal patterns and market sentiment makes them a favourite among traders, but mastering their interpretation may require some practice and education. 

Timeframes and Charting Periods 

Forex charts can be customised to display price data at various timeframes. The timeframe you choose determines how much data each candlestick or bar represents. Here are some common timeframes: 

  • 1-Minute: Each candlestick or bar represents one minute of trading data. This timeframe is popular among day traders for making quick decisions. 
  • 5-Minute: Each candlestick or bar represents five minutes of trading data. It provides a slightly broader view than the 1-minute timeframe while still catering to short-term traders. 
  • 1-Hour: Each candlestick or bar represents one hour of trading data. This timeframe is suitable for traders who want to capture short- to medium-term price movements. 
  • 4-Hour: Each candlestick or bar represents four hours of trading data. It’s commonly used by swing traders and provides a more extended perspective of the market. 
  • Daily: Each candlestick or bar represents one full trading day. Daily charts are favoured by long-term traders and investors who want to identify significant trends and potential entry points over several days or weeks. 
  • Weekly: Each candlestick or bar represents one trading week, making it ideal for traders with long-term investment horizons who aim to capture trends over months or even years. 
Multi time frame analysis
source: tradingview.com

Choosing the Right Timeframe 

Selecting the appropriate timeframe is a crucial decision that depends on your trading style, goals, and preferences. It impacts the type of price movements you observe and the duration of your trades. By aligning your timeframe with your trading style and objectives, you can make more informed decisions and enhance your overall trading success. 

Here are some considerations: 

  • Short-Term Traders: If you’re a day trader or scalper looking for quick profits from short-term price fluctuations, lower timeframes like 1-minute or 5-minute charts may be more suitable. 
  • Medium-Term Traders: Traders with a medium-term horizon, such as swing traders, often use 1-hour or 4-hour charts to capture price movements that span a few days to a few weeks. 
  • Long-Term Investors: If you’re an investor or trader focused on long-term trends, daily or weekly charts provide a broader view of the market and are better suited for identifying significant trends and potential entry points over a more extended period. 
  • Combination: Some traders use a combination of timeframes to gain different perspectives on the same currency pair. For example, they might use a daily chart for trend analysis and a 1-hour chart for precise entry and exit points. 

In conclusion, Forex charts are indispensable tools in the currency trading world, offering clarity amid market complexity. Whether you choose line, bar, or candlestick charts, your chart type significantly impacts your trading strategy. Understanding various timeframes is key for aligning your trading style with your goals. As you dive into trading, remember that chart analysis is a skill to refine, guiding you to profitable decisions and financial growth. Happy trading! 

Summary: 

  • Forex charts are vital for traders, providing visual insights into currency pair price movements. 
  • They are essential for price analysis, timing trades, risk management, decision-making, strategy development, and psychological support. 
  • Three main types of Forex charts are available: line charts, bar charts (OHLC), and candlestick charts, each offering a unique perspective on the market. The choice of chart type depends on your trading style and goals. 
  • Timeframes, such as 1-minute, 1-hour, and daily, determine the data granularity, aligning with your trading style. 

Tech Stocks Rally, Dollar Declines, and Market Awaits Inflation Data

The stock market opened the week on a positive note, with renewed investor interest in tech stocks following a recent slump. The Nasdaq Composite led the charge with a robust 1.14% gain, reaching 13,917.89, while the S&P 500 climbed by 0.67% to 4,487.46, and the Dow Jones Industrial Average closed at 34,663.72, up 0.25%, with Walt Disney contributing to its rise. Tesla surged by 10% due to an upgrade by Morgan Stanley, driven by optimism about its autonomous software. Qualcomm also saw a 4% increase after announcing a deal to supply Apple with 5G modems. The Technology Select Sector SPDR Fund rebounded by 0.5% after recent declines, and Disney shares rose by 1.2% following the resolution of a cable blackout dispute with Charter Communications. The market was buoyed by a report indicating that the Federal Reserve was unlikely to raise rates at its upcoming meeting, given improving inflation data. Investors are now eagerly awaiting key inflation figures in the coming week. In parallel, the US dollar declined broadly, while EUR/USD rose by 0.46%, despite the European Commission lowering its growth forecast, reflecting a weakening dollar amidst upcoming data releases and central bank meetings.

Stock Market Updates

On Monday, the stock market saw a positive start to a significant week filled with inflation data releases. Investors displayed a renewed interest in tech stocks following a recent period of weakness. The Nasdaq Composite led the way with a robust 1.14% gain, reaching a value of 13,917.89. Similarly, the S&P 500 also climbed, rising by 0.67% to 4,487.46, while the Dow Jones Industrial Average advanced by 87.13 points, or 0.25%, closing at 34,663.72. Notably, Walt Disney shares contributed to the Dow’s increase. Tesla experienced a remarkable surge of 10% due to an upgrade by Morgan Stanley, which anticipated a significant rally owing to advancements in its autonomous software. In addition, Qualcomm shares rose by nearly 4% following their announcement that they would supply Apple with 5G modems for smartphones until 2026.

Meanwhile, the Technology Select Sector SPDR Fund (XLK), composed of tech shares within the S&P 500, had faced a 1.5% decline in August and more than a 1% decrease this month. However, on Monday, the ETF managed to rebound, recording a gain of approximately 0.5%. Remarkably, it had gained nearly 40% over the course of the year. Additionally, Disney shares increased by around 1.2% as the media conglomerate and Charter Communications resolved their cable blackout dispute. The positive sentiment in the market was further bolstered by a report from The Wall Street Journal on Sunday, which suggested that there was a consensus within the Federal Reserve not to raise rates at the upcoming meeting. The report also indicated a policy shift, with members perceiving less urgency for an additional rate hike later in the year, given the improving inflation data.

Investors eagerly await the release of key inflation data in the coming week, especially following a series of stronger-than-expected economic indicators from the previous week, which had raised concerns about the possibility of the Federal Reserve increasing rates more than previously anticipated.

Data by Bloomberg

On Monday, the stock market displayed a generally positive trend, with all sectors collectively rising by 0.67%. Notably, Consumer Discretionary led the way with a significant gain of 2.77%, while Communication Services also performed well, posting a 1.17% increase. Consumer Staples, Health Care, and Information Technology sectors saw moderate gains, while Materials and Financials showed modest upticks. However, Real Estate and Industrials had marginal increases, and Energy experienced a notable decline of -1.32%, reflecting the varying performances of different sectors during the trading day.

Currency Market Updates

On Monday, the US dollar experienced a broad decline, with USD/JPY dropping due to comments by BoJ Governor Kazuo suggesting the potential for a year-end rate hike. Concurrently, USD/CNH fell by 0.8% in response to stronger Chinese data and robust efforts to bolster the yuan. Despite Germany’s recession and a cut in forecasts by the EU Commission, EUR/USD rose by 0.46% amid the dollar’s overall retreat.

In the US, the New York Fed’s August Survey indicated little change in inflation expectations but heightened concerns about job prospects and financial conditions. After eight consecutive weeks of losses, consolidation was anticipated ahead of key data releases, including US CPI, PPI, and retail sales midweek, as well as the ECB meeting on Thursday. The drop in USD/JPY to its lowest level since September 1st contrasted with the rise in JGB yields but was influenced by more attractive 2- and 10-year Treasury yields at 4.99% and 4.29%.

GBP/USD, despite Bank of England policymaker Catherine Mann’s comments, gained 0.37% but remained above the 200-day moving average. The focus shifted to Tuesday’s UK employment report, which anticipated a significant drop in employment and an increased jobless rate. AUD/USD declined by 0.8%, reflecting strong gains in commodity prices and positive sentiment regarding China’s economy. The week ahead held key events, including German and euro zone updates, US CPI, and PPI releases, with inflation forecasts and retail sales data contributing to market dynamics.

Picks of the Day Analysis
EUR/USD (4 Hours)

EUR/USD Rebounds as ECB Meeting Looms Amidst Dollar Weakness

The EUR/USD pair staged a recovery, bouncing back from three-month lows to reach the 1.0760 level, marking its highest point in six days. This upward movement was primarily driven by a broad weakening of the US Dollar, attributed to improved risk sentiment. The US Dollar Index registered its first decline in nearly two weeks. The upcoming European Central Bank (ECB) monetary policy meeting on Thursday holds the possibility of a modest interest rate hike, although the market wouldn’t be shocked by a pause. Last week, uncertainty surrounding the ECB’s future actions had put pressure on the Euro. Additionally, the German ZEW Survey is scheduled for release on Tuesday.

However, it’s important to note that the European Commission’s reduction of its 2023 growth forecast, particularly for Germany, which is expected to contract by 0.4%, has had an impact. The US economy’s relative strength continues to bolster the Greenback. Looking ahead, the key report in the US is the Consumer Price Index (CPI) on Wednesday, ahead of the next week’s Federal Open Market Committee (FOMC) meeting, where no rate hike is anticipated.

Chart EURUSD by TradingView

According to technical analysis, the EUR/USD moved slightly higher on Monday and is currently trading just below the upper band of the Bollinger Bands. This movement suggests the possibility of a slight downward movement reaching the middle band. The Relative Strength Index (RSI) is currently at 53, indicating that the EUR/USD is in neutral stance.

Resistance: 1.0759, 1.0803

Support: 1.0702, 1.0653

XAU/USD (4 Hours)

XAU/USD Rise as Dollar Weakens in Risk-On Environment Amid Asia’s Economic Rebound

Gold prices saw an uptick on Monday, as the demand for the US Dollar waned in a risk-on environment. XAU/USD reached as high as $1,930.70 per troy ounce before settling at $1,924 as the initial optimism gradually subsided throughout the day.

This shift in gold prices was influenced by stock market rebounds, driven by news of improving economic conditions in Asia. China reported an increase in the August Consumer Price Index (CPI), reversing earlier negative trends, and the Bank of Japan (BoJ) Governor Kazuo Ueda’s comments about a potential exit from negative rates contributed to a decline in the safe-haven US Dollar across the foreign exchange market.

While the positive sentiment extended to Wall Street with major indexes trading in the green, caution prevailed ahead of significant upcoming events. Speculators are keenly awaiting the US August Consumer Price Index (CPI), with an annual inflation rate expected to be slightly higher at 3.6%. Additionally, the European Central Bank (ECB) will announce its monetary policy decision later in the week, with expectations leaning toward the ECB maintaining its current stance, although the possibility of a surprise 25 basis point rate hike lingers due to persistent price pressures. US indexes held onto modest gains, with the Nasdaq Composite leading the way, while firmer US Treasury yields contributed to the Dollar’s recovery, with the 10-year note offering 4.29%.

Chart XAUUSD by TradingView

According to technical analysis, XAU/USD remained flat on Monday, oscillating around the middle band of the Bollinger Bands. Currently, the price is showing a consolidating movement around the middle band. The Relative Strength Index (RSI) is currently at 45, indicating that the XAU/USD pair is still in a bearish mode but making an effort to shift back into a neutral zone.

Resistance: $1,925, $1,935

Support: $1,912, $1,903

Economic Data
CurrencyDataTime (GMT + 8)Forecast
GBPClaimant Count Change14:0017.1K

Week Ahead: Markets to Focus on US CPI, US PPI, and ECB Rate Decision

Of particular interest to traders this week will be the US Consumer Price Index (CPI), the US Producer Price Index (PPI), and the European Central Bank’s (ECB) Rate Decision. These items have the potential to significantly impact the markets. Exercise caution and stay up to date with the latest developments to ensure a successful week of trading. 

Here are some notable market highlights for the upcoming week:

UK Claimant Count Change (12 September 2023)

The number of people claiming unemployment benefits in the UK increased by 29,000 in July 2023.

The data for August 2023 will be released on 12 September, with analysts expecting a further increase of 17,000.

UK Gross Domestic Product (13 September 2023) 

The British economy expanded by 0.5% in June 2023, rebounding from a 0.1% decline in May. 

Analysts anticipate a 0.3% decrease in the data for July 2023, scheduled for release on 13 September.

US Consumer Price Index (13 September 2023)

The monthly inflation rate in the US held steady at 0.2% in July 2023. 

Analysts expect an increase of 0.5% in the upcoming CPI figures, set to be released on 13 September.

Australia Employment Change (14 September 2023) 

Employment in Australia decreased by 14,600 in July 2023. 

Figures for August 2023 will be released on 14 September, with analysts anticipating an increase of 40,000.

European Central Bank Rate Decision (14 September 2023)  

The ECB raised its key interest rates by 25 bps to 4.25% during its July meeting.

For the upcoming meeting on 14 September, analysts expect the central bank to keep the interest rates at 4.25%.

US Producer Price Index (14 September 2023) 

Producer prices in the US rose 0.3% in July 2023, the biggest increase since January 2023.

Analysts expect a 0.4% increase in the figures for August 2023, set to be released on 14 September.

US Retail Sales (14 September 2023)

US retail sales were up 0.7% in July 2023. This follows a 0.3% increase in June 2023 and marks a fourth consecutive rise.

Analysts expect a further increase of 0.2% in the figures for August 2023, set to be released on 14 September. 

University of Michigan Consumer Sentiment (15 September 2023)

The University of Michigan Consumer Sentiment Index for the US was revised from preliminary estimates of 71.2 to 69.5 in August 2023.

Analysts expect the index to remain at 69.5 in the upcoming figures, set to be released on 15 September.

九月期货合约展期通知 (更新版) – 2023年09月08日

尊敬的用户:

您好!

VT Markets 平台的期货产品:FGBX (超长期德国债券) , FGBS (短期德国债券) , FGBM (中期德国债券) , FGBL (长期德国债券) , JPN225ft (日经 225期貨) , UK100ft (英国富时 100期货) , NAS100ft (那斯达克 100期货) , FRA40ft (巴黎 CAC 40期貨) , FEI (3月欧元利率债券) , SP500ft (标准普尔 500期货) , DJ30ft (道琼斯 30期货) , GER40ft (德指期货) , CL-OIL (西德州原油期货) , USDX (美元指数) , VIX (恐慌指数) , UKOUSDft (布兰特原油期货) , CHINA50ft (新华富时 A50期货) , HK50ft (港指期货) 即将于以下时间展开新合约,如持仓过夜将会收取展期费用。

由于并非市场因素所造成的价格波动,若投资者的仓位于合约切换期间包含期货原油的未平仓头寸,将依据展期方向产生相应的费用扣补,以此反映新旧合约之间的价差。

请留意:

• 展期时,合约将自动切换,所有持仓中的订单将可继续持有。

• 展期日未平仓的订单将通过展期费进行调整,以反映到期合约和新合约之间的价格差异。

• 为避免差价合约展期,客户可以选择在展期日之前关闭任何未平仓的订单。

• 投资者应在展期前妥善控制仓位或调整相应的止盈止损设置。

• 同时,由于展期需做调整,在展期当天开盘前后半小时,我们会禁止所有同名账户内部转账。

如您有任何疑问,我们的团队将十分乐意为您解答。
请留言或发邮件至 [email protected] 或联系在线客服。

Market Declines Amid Fed Rate Hike Concerns and Tech Sector Woes

The Nasdaq Composite extended its four-day decline on concerns of future Federal Reserve interest rate hikes, leading to a 0.89% drop, while the S&P 500 slipped 0.32%, and the Dow Jones Industrial Average added 0.17%. Apple’s shares fell 2.9% due to reports of potential iPhone bans in Chinese state-owned entities, contributing to the tech sector’s woes. Strong economic data, such as lower-than-expected jobless claims and rising labor costs, raised concerns of a sustained tight monetary policy by the Federal Reserve, potentially leading to further rate hikes despite expectations of a pause in September. In currency markets, the US dollar gained, driven partly by unexpected declines in jobless claims, while concerns about data distortions, global trade tensions, and potential interventions weighed on sentiment.

Stock Market Updates

The Nasdaq Composite experienced its fourth consecutive decline due to concerns regarding the Federal Reserve’s potential interest rate hikes later this year. The tech-heavy Nasdaq fell by 0.89%, while the S&P 500 slipped 0.32%, and the Dow Jones Industrial Average added 0.17%. Investors were anticipating a pause in the Fed’s rate hikes for the rest of the year but are now worried about the possibility of one or two more increases. Additionally, Apple shares dropped by 2.9% amid reports that China might expand its ban on iPhones in state-owned entities. This decline in technology and semiconductor stocks contributed to the market’s negative sentiment.

Furthermore, strong economic data, including lower-than-expected jobless claims and higher labor costs, raised concerns that the Federal Reserve might maintain its tight monetary policy stance. The robust job market, combined with rising energy prices, could lead to further rate hikes by the Fed, despite expectations of a rate pause in September. Traders are closely monitoring corporate earnings reports, with C3.ai experiencing a 12.2% decline due to weak guidance. Overall, uncertainties about the Fed’s interest rate policy and global trade tensions have weighed on the market’s performance.

Data by Bloomberg

On Thursday, the overall market saw a slight decline of 0.32%. Among the sectors, Utilities and Real Estate experienced gains of 1.26% and 0.71%, respectively, indicating relative strength. Consumer Discretionary and Health Care also showed modest increases of 0.50% and 0.47%, while Consumer Staples and Communication Services posted smaller gains of 0.34% and 0.11%. On the other hand, Information Technology recorded a notable decline of 1.57%, leading the negative performance, followed by Materials (-0.44%), Energy (-0.22%), Financials (-0.20%), Industrials (-0.32%), and All Sectors (-0.32%). These sector-specific movements reflect the varied performance across different segments of the market on that particular day.

Currency Market Updates

The US dollar saw some gains on Thursday, partly due to an unexpected drop in US jobless claims. However, these gains were tempered by concerns about data distortions resulting from the Labor Day holiday. Furthermore, the effects of a significant influx of corporate bond market supply this month seemed to have moderated. The EUR/USD pair fell by 0.29%, although it had recovered slightly from its low earlier in the week.

The Japanese yen weakened against the US dollar amid falling Treasury yields, while the threat of Japanese intervention to support the yen added to the pressure. Sterling also experienced a decline of 0.27% but managed to bounce back from its low. Concerns about China’s economy and trade tensions with Western nations were heightened, especially following reports of restrictions on iPhone use by government staff. Looking ahead, market participants are closely watching upcoming events such as Japanese economic data, Canada’s jobs report, US CPI data, and the ECB meeting, which are expected to be significant drivers of market sentiment in the near term.

Picks of the Day Analysis
EUR/USD (4 Hours)

EUR/USD Hits Three-Month Low Amid Gloomy Eurozone Data and Strong US Dollar

The EUR/USD pair continued its decline, marking its lowest daily close in three months, hovering near the 1.0700 level. The prevailing bias remains bearish as the Euro remains vulnerable in the face of a resilient US Dollar. Strong economic data from the United States provided support to the Greenback, which was further buoyed by cautious market sentiment.

In contrast to the US, economic indicators from the Eurozone painted a less optimistic picture. The second-quarter employment change in the Eurozone remained unchanged at 0.2%, while GDP growth was revised down from 0.3% to 0.1%. Germany’s Industrial Production data for July showed a larger-than-expected decline of 0.8%. These economic disparities between the Eurozone and the US have heightened concerns about the EUR/USD pair, with worries about economic stagnation in the Eurozone contrasting with the relatively stronger US economy. Notably, US Initial Jobless Claims dropped to 216K, below market expectations of 234K for the week ending September 1, and Unit Labor Costs for the second quarter were revised higher from 1.6% to 2.2%. This data initially boosted US Treasury yields, supporting the US Dollar, although later in the session, the dollar’s gains were limited as Treasury yields reversed sharply.

Chart EURUSD by TradingView

According to technical analysis, the EUR/USD moved slightly lower on Thursday and is currently trading just below the middle band of the Bollinger Bands. This movement suggests the possibility of a slight upward movement to reach the middle band. The Relative Strength Index (RSI) is currently at 38, indicating that the EUR/USD is trending lower and attempting to maintain a bearish trend.

Resistance: 1.0759, 1.0803

Support: 1.0702, 1.0653

XAU/USD (4 Hours)

XAU/USD Consolidates as Strong US Dollar Gains Momentum Amid Upbeat Economic Data

XAU/USD is in consolidation mode after experiencing weekly losses and is currently trading around the $1,920 mark during the American trading session. The US Dollar continues to assert its dominance against most major currencies, driven by positive United States (US) economic data and the possibility of another Federal Reserve (Fed) interest rate hike.

Gold prices initially rebounded from an early low near $1,916 as US Treasury yields retreated from their earlier highs. However, the Greenback’s decline was limited due to robust US employment-related data. Meanwhile, global stock markets have been reflecting a cautious sentiment, with many major indexes trading in negative territory.

In the latest economic releases, the US reported Initial Jobless Claims for the week ending September 1, which came in at 216K, significantly better than the expected 234K. Additionally, the country published Q2 Nonfarm Productivity, showing a growth of 3.5%, slightly below the anticipated 3.8%, and Unit Labor Costs for the same period, which increased by 2.2%, surpassing expectations. These data points indicate stronger-than-expected economic growth in the US, setting it apart from the economic challenges faced by other major economies. Consequently, the US Dollar is strengthening further in a risk-averse market environment.

Chart XAUUSD by TradingView

According to technical analysis, XAU/USD remained flat on Thursday, oscillating between the lower and middle bands of the Bollinger Bands. At present, the price is showing a slight upward movement and is approaching the middle band, suggesting the potential for a modest increase in Gold’s value. However, it is important to note that the market still maintains a bearish bias. The Relative Strength Index (RSI) is currently at 45, indicating that the XAU/USD pair is still in a bearish mode but making an effort to shift back into a neutral zone.

Resistance: $1,925, $1,935

Support: $1,912, $1,903

Economic Data
CurrencyDataTime (GMT + 8)Forecast
CADEmployment Change20:3018.9K
CADUnemployment Rate20:305.6%

Exploring Forex Chart Types: A Trader’s Perspective, Part 1

Picture this: you’re standing on the bustling floor of a stock exchange, surrounded by traders frantically waving their arms, shouting buy and sell orders. The numbers on the screens are changing rapidly, and the stakes are high. 

source: Financial Times

In the world of Forex trading, you may not be physically present on a trading floor, but you are part of a global financial arena where billions of dollars change hands every day, all from the comfort of your own computer. To thrive in this dynamic world, you need a powerful tool – Forex charts

Just as a skilled trader uses charts to decipher market movements amidst the chaos of a trading floor, Forex traders rely on various types of charts to navigate the ever-shifting currency markets. These charts are your compass, helping you make sense of price fluctuations and guiding you toward profitable decisions. 

In this guide, we’ll demystify the world of Forex charts, ensuring you’re well-prepared to embark on your trading journey. 

What Are Forex Charts? 

Forex charts are visual representations of the price movements of currency pairs in the foreign exchange market. They are a trader’s primary tool for analysing and understanding market dynamics. These charts display historical price data, and by examining this data, traders can make informed decisions about when to buy or sell currencies. 

source: tradingview.com

Forex charts act as a historical record of a currency pair’s performance, showing how its value has changed over time. Think of them as the equivalent of a weather map for traders, helping you anticipate market conditions and plan your trading strategies. 

Why Are Charts Essential? 

The importance of Forex charts cannot be overstated, especially for beginners. Here’s why they are absolutely essential in your trading journey: 

  • Price Analysis: Charts allow you to analyse the past price movements of currency pairs. By examining these historical patterns, you can identify trends and potential opportunities. 
  • Timing: Forex charts help you determine the right time to enter or exit a trade. They provide insights into when a currency pair might be overbought (good for selling) or oversold (good for buying). 
  • Risk Management: Charts enable you to set stop-loss and take-profit levels to manage your risk. This helps protect your trading capital and ensures you don’t incur significant losses. 
  • Decision-Making: Without charts, you’d be trading blindfolded. Charts give you the data and insights needed to make informed decisions, reducing the element of guesswork. 
  • Strategy Development: Traders use charts to develop and refine trading strategies. Whether you’re a day trader or a long-term investor, charts provide the foundation for your trading plan. 
  • Psychological Support: Seeing the data represented graphically can help you stay calm and stick to your trading plan, reducing emotional decision-making. 

Different Types of Forex Charts 

Forex charts come in various formats, and each type offers a unique perspective on the market. Here’s a closer look at the three main types

  • Line Charts: These charts connect the closing prices of currency pairs over time with a continuous line. Line charts are simple and offer a broad overview of trends. 
  • Bar Charts (OHLC): Bar charts represent the Open, High, Low, and Close prices of a currency pair for a specific time period. They provide more detailed information than line charts. 
  • Candlestick Charts: Candlestick charts use “candles” to show the same OHLC data as bar charts but in a visually appealing way. The colour of the candle and its shape convey valuable information about price movements. 

Each type of chart has its strengths and is suitable for different trading styles and purposes. As you continue your Forex journey, you’ll explore these chart types in more depth and discover which one resonates best with your trading style and goals. 

Line Charts 

Line charts are the simplest and most fundamental type of Forex charts. They present price data as a continuous line that connects the closing prices of a currency pair over a specific time period. These charts offer a straightforward way to visualise the general direction of a currency’s price movement. 

Line charts are often favoured by beginners due to their simplicity and ease of use. They are a great starting point for those new to Forex trading, providing a clear overview of price trends without overwhelming details. 

source: investopedia.com

How to Read and Interpret Line Charts 

Reading a line chart is akin to connecting the dots on a graph. Here’s how you can read and interpret a line chart: 

  • Time on the X-Axis: The horizontal axis (X-axis) represents time, usually displayed as hours, days, weeks, or months, depending on the chosen timeframe. 
  • Price on the Y-Axis: The vertical axis (Y-axis) represents the price of the currency pair. The values on this axis vary according to the price scale. 
  • Connecting the Dots: To understand a currency pair’s price movement, observe how the line connects the closing prices over time. A rising line suggests a bullish trend (prices are increasing), while a falling line indicates a bearish trend (prices are decreasing). 
  • General Trend: Line charts are excellent for identifying the general trend of a currency pair. If the line is consistently moving upward, it indicates a bullish trend, and if it’s consistently moving downward, it signifies a bearish trend. 

In summary, line charts are a beginner-friendly tool that helps traders grasp the overall trend of a currency pair quickly. While they lack some of the detail offered by other chart types, they serve as an excellent starting point for those new to Forex trading. 

Explore bar charts, candlestick charts, timeframes, and charting periods in Part 2 of this article.

Market Volatility: Stocks Decline, US Dollar Strengthens, and Cryptocurrencies Hold Steady

On Wednesday, the stock market saw declines, driven by concerns about potential Federal Reserve interest rate hikes, leading to a 0.57% drop in the Dow Jones Industrial Average, a 0.7% dip in the S&P 500, and a 1.06% fall in the Nasdaq Composite. Rising Treasury yields played a role in these losses, particularly affecting technology stocks like Nvidia and Apple. Meanwhile, the US dollar strengthened due to positive ISM data, while the euro (EUR/USD) had a modest gain. GBP/USD declined below 1.25 as Bank of England officials questioned the need for further rate hikes. Precious metals like gold and silver slid due to rising US yields, while cryptocurrencies remained resilient amid discussions about a global cryptocurrency framework within the G20.

Stock Market Updates

On Wednesday, the stock market experienced a notable decline, extending its lackluster performance into September. Investors grew increasingly apprehensive that the Federal Reserve might not have completed its interest rate hikes. The Dow Jones Industrial Average, for instance, dropped by 198.78 points, equivalent to 0.57%, settling at 34,443.19. Similarly, the S&P 500 saw a 0.7% dip, concluding the day at 4,465.48, while the Nasdaq Composite fared even worse, falling by 1.06% and closing at 13,872.47. These declines were largely attributed to rising Treasury yields, particularly the 2-year Treasury note, which surged by approximately 6 basis points and exceeded the 5% threshold.

The upward trajectory in Treasury yields was unsettling for risk assets, with technology stocks, in particular, underperforming. Notably, the Nasdaq experienced its third consecutive day of losses, with leading tech companies like Nvidia and Apple both witnessing declines of over 3%. This negative sentiment also weighed on the Dow, with stocks like Amgen and Boeing declining by around 2% each. The surge in Treasury yields coincided with stronger-than-expected economic data, causing concerns about the possibility of further interest rate hikes. Recent readings on the U.S. economy’s services and manufacturing sectors indicated that prices were moving unfavorably, triggering market uncertainty. Additionally, the probability of a rate hike in November rose, with traders assigning a greater than 40% chance, while a 93% likelihood of the central bank maintaining rates this month was noted, according to the CME Group. In light of this, Boston Fed President Susan Collins suggested cautious progress on rate hikes, although she acknowledged that further tightening might be warranted based on data trends.

Data by Bloomberg

On Wednesday, the overall market saw a decline of 0.70%. Among the sectors, Utilities and Energy showed slight gains, with increases of 0.20% and 0.14%, respectively. On the other hand, several sectors experienced losses, with Information Technology being the hardest hit with a substantial drop of 1.37%. Consumer Discretionary also faced a significant decline of 0.97%. Other sectors like Health Care, Communication Services, Industrials, and Materials saw moderate declines ranging from 0.48% to 0.61%. Financials, Consumer Staples, Real Estate, and All Sectors recorded smaller losses, ranging from -0.17% to -0.70%.

Currency Market Updates

On Wednesday, the dollar index strengthened as the ISM non-manufacturing PMI outperformed expectations, leading to a reversal in Treasury yields. Initially, these lower yields had put pressure on the U.S. currency, but the upbeat ISM data boosted expectations of a Federal Reserve interest rate hike in November, pushing the odds above 50%. Meanwhile, EUR/USD saw a modest increase of 0.12%. The European Central Bank (ECB) was mirroring the Fed’s rate hike expectations, with a potential hike in September and roughly a 50% chance of a rate increase on October 26. Traders were looking ahead to euro zone employment data and Q2 GDP figures for insights into the ECB’s near-term policy decisions.

USD/JPY managed to recover from earlier losses, thanks in part to rising Treasury yields and positive ISM data, bringing it closer to its early Asia 2023 high at 147.82. However, earlier remarks from Japan’s top currency diplomat, Masato Kanda, expressing concern about speculative yen selling, had initially weighed on the pair. On the other hand, GBP/USD dipped below 1.25, hitting lows not seen since early June 2023. The downward pressure was exacerbated by comments from BoE Governor Andrew Bailey, Deputy Governor Jon Cunliffe, and Swati Dhingra, who raised questions about the necessity for further rate hikes, adopting a less hawkish stance. Key support at the 200-DMA around 1.2425 was in focus, with a close below potentially signaling a move toward 1.1805, the March 8, 2023 low.

In the commodities market, rising U.S. yields had a negative impact on precious metals, with gold sliding by 0.4% to $1,917 and silver dipping 1.5% to $23.17. Meanwhile, cryptocurrencies defied the weight of high-interest rates, as Bitcoin rose by 0.5% to $25.8k, and Ether gained 0.55% to reach $1,641.30. This resilience was attributed to discussions within the G20 about establishing a global framework for cryptocurrencies.

Picks of the Day Analysis
EUR/USD (4 Hours)

EUR/USD Trends Lower Amid Economic Dynamics

The EUR/USD pair reached a new three-month low, hovering just above 1.0700, primarily due to robust US economic data and a prevailing sense of risk aversion bolstering the US Dollar. In contrast, Eurozone indicators painted a concerning picture, with a substantial 11.7% drop in German Factory Orders and a 0.2% decline in Eurozone Retail Sales for July, casting uncertainty over the European Central Bank’s (ECB) upcoming decisions. Despite these setbacks, the Euro managed to outperform the Pound and Swiss Franc. Upcoming Eurostat releases on Q2 employment and GDP data are not expected to have a significant impact since they involve revisions.

Conversely, in the US, the ISM Manufacturing PMI surpassed expectations, bolstering the Greenback. After briefly touching a low of 1.0702, the EUR/USD pair rebounded to 1.0730. The US Dollar’s strength continues to be driven by robust economic performance and risk aversion. Looking ahead, Jobless Claims and Unit Labor Cost data are anticipated on Thursday, likely to further influence the currency market.

Chart EURUSD by TradingView

According to technical analysis, the EUR/USD moves flat on Wednesday and is currently trading just above the lower bands of the Bollinger Bands. This movement suggests the possibility of another downward move to create a lower push to the lower band. The Relative Strength Index (RSI) is currently at 34, indicating that the EUR/USD is trending lower and attempting to stay in a bearish trend.

Resistance: 1.0759, 1.0803

Support: 1.0702, 1.0653

XAU/USD (4 Hours)

XAU/USD Extends Decline Amid Dollar’s Ongoing Strength and Mixed Economic Data

On Wednesday, the US Dollar continued its ascent, causing XAU/USD (Gold) to decline for the fourth consecutive day. Gold traded near an intraday low of $1,915.27 per troy ounce, reacting to mixed US macroeconomic data.

S&P Global revised down the August Services PMI, indicating a slowdown in growth, while the ISM Services PMI reported expansion in the services sector. The IBD/TIPP Economic Optimism Index also rose, signaling resilience in the economy. However, inflation-related concerns persisted, leading to increased odds of a 25-basis points rate hike by the Federal Reserve in November, which in turn drove demand for the safe-haven US Dollar. As a result, stock markets turned negative amid these developments.

Chart XAUUSD by TradingView

According to technical analysis, XAU/USD moves lower on Wednesday and created a push to the lower band of the Bollinger Bands. Currently, the price is moving slightly above the lower band, indicating a possibility of a slight increase in Gold’s value, but it’s still in a bearish mode. The Relative Strength Index (RSI) currently stands at 34, suggesting that the XAU/USD pair is now in a bearish mode.

Resistance: $1,925, $1,935

Support: $1,912, $1,903

Economic Data
CurrencyDataTime (GMT + 8)Forecast
USDUnemployment Claims20:30232K

Back To Top
server

您好 👋

我能帮您什么吗?

立即与我们的团队聊天

在线客服

通过以下方式开始对话...

  • Telegram
    hold 维护中
  • 即将推出...

您好 👋

我能帮您什么吗?

telegram

用手机扫描二维码即可开始与我们聊天,或 点击这里.

没有安装 Telegram 应用或桌面版?请使用 Web Telegram .

QR code