Emas susut semula dalam dagangan Asia pada Selasa selepas melantun daripada paras terendah empat bulan, dengan harga tersekat berhampiran $4,100 pada Purata Pergerakan Mudah (SMA) 200 hari. Perang Iran telah meningkatkan kebimbangan inflasi, mengurangkan jangkaan pemotongan kadar, dan menyokong permintaan Dolar AS, sekali gus menekan logam tanpa pulangan ini.
Iran berkata ia tidak mengadakan rundingan dengan AS untuk menamatkan perang, dan Mohsen Rezaei berkata pertempuran akan diteruskan sehingga Iran menerima pampasan bagi kerosakan. Laporan mengenai tekanan baharu terhadap infrastruktur tenaga Iran serta penutupan berkesan Selat Hormuz menyokong harga minyak mentah, menambah kebimbangan terhadap inflasi yang kembali meningkat dan kadar faedah yang lebih tinggi.
Pasaran Menilai Semula Tinjauan Fed
Pasaran kini hampir sepenuhnya menyingkirkan harga bagi pemotongan selanjutnya oleh Rizab Persekutuan AS dan telah meningkatkan pertaruhan terhadap kenaikan kadar menjelang akhir tahun, sekali gus mengangkat hasil Perbendaharaan AS dan Dolar. Pedagang juga memerhati PMI kilat global untuk hala tuju jangka terdekat, manakala ketegangan berterusan di Timur Tengah mengehadkan selera risiko.
Dari sudut teknikal, penembusan minggu lalu di bawah SMA 100 hari mengekalkan tekanan menurun, dengan sokongan pada $4,355, kemudian $4,300 dan $4,100. MACD (12, 26, 9) kekal negatif, RSI pada 25.82, dan paras rintangan ialah $4,650, $4,820, dan $5,000.
Strategi Opsyen Untuk Volatiliti
Memandangkan momentum menurun ini, pedagang wajar mempertimbangkan membeli opsyen put untuk lindung nilai atau membuat spekulasi terhadap penurunan lanjut. Penembusan tegas di bawah paras $4,300 boleh mempercepatkan pergerakan ke arah purata pergerakan 200 hari yang kritikal sekitar $4,100. Strategi ini membolehkan risiko ditetapkan sambil memanfaatkan aliran menurun semasa yang didorong oleh faktor makroekonomi.
Namun, bacaan RSI terlebih jual sekitar 25 menunjukkan gelombang jualan semasa mungkin terlebih melampau dalam jangka masa pendek. Peningkatan mendadak konflik di Timur Tengah boleh mencetuskan pembalikan ketara, menjadikan pertimbangan terhadap opsyen call murah di luar wang sebagai lindung nilai sesuatu yang wajar. Pergerakan kembali melepasi zon rintangan $4,650 akan menjadi isyarat bahawa tekanan menurun sedang reda buat sementara waktu.
Buka akaun langsung VT Markets anda dan mula berdagang sekarang.
Mula berdagang sekarang – Klik di sini untuk membuat akaun sebenar VT Markets
AUD/USD jatuh ke sekitar 0.6980 pada Isnin selepas berpatah balik daripada paras tertinggi Mac berhampiran 0.7120. Pasangan ini telah merosot lebih 200 pip dalam tempoh kurang seminggu dan bergerak di bawah 0.7000 buat kali pertama sejak awal Februari.
PMI kilat Australia bagi Mac melemah, dengan bacaan komposit pada 47.0 berbanding 52.4 pada Februari. Sektor perkhidmatan merosot kepada 46.6 daripada 52.8, manakala pembuatan susut kepada 50.1 daripada 51.0.
Prospek Bank Rizab Dan Ujian Inflasi Utama
Bank Rizab Australia (RBA) menaikkan kadar faedah sebanyak 25 mata asas kepada 4.10% minggu lalu menerusi undian 5-4. Titik data seterusnya ialah CPI Februari pada Rabu, dengan inflasi utama diunjurkan pada 3.8% tahun ke tahun dan trimmed mean pada 3.4%.
Di AS, Rizab Persekutuan (Fed) mengekalkan kadar pada 3.50% hingga 3.75% pada 18 Mac menerusi undian 11-1. Data PMI kilat AS bagi Mac dijadualkan pada Selasa, bersama angka produktiviti suku keempat dan kos buruh seunit.
Pada carta 1 jam, AUD/USD berada pada 0.7013 selepas melantun semula daripada bawah 0.6950. Rintangan dilihat pada 0.7030, 0.7050 dan 0.7070, dengan sokongan pada 0.7000, 0.6980 dan 0.6950.
Idea Dagangan Dengan Bias Menurun
Gambaran asas hari ini menunjukkan cabaran yang serupa, meskipun kurang dramatik, buat dolar Australia. Walaupun tiada kejutan geopolitik setara dari segi magnitud, indikator CPI bulanan terbaru Australia bagi Januari 2026 mencatat 3.4% yang kekal degil, sekali gus mengekalkan tekanan ke atas RBA. Dengan kadar tunai kini pada 4.35%, pedagang perlu berwaspada terhadap sebarang kelembapan dalam data aktiviti yang bakal diterbitkan, kerana ia boleh menandakan dilema dasar untuk RBA yang mengingatkan situasi 2025.
Di sisi satu lagi pasangan ini, kedudukan dolar AS menjadi jauh lebih kukuh berbanding tahun lalu. Pada Mac 2025, Fed mengekalkan kadar sekitar 3.75% dan mengunjurkan pemotongan, namun hari ini kadar dana Fed jauh lebih tinggi dalam julat 5.25% hingga 5.50%. Dengan data CPI AS terbaru bagi Februari 2026 menunjukkan inflasi masih degil pada 3.2%, perbezaan kadar faedah yang luas jelas memihak kepada pegangan dolar AS berbanding dolar Australia.
Berdasarkan latar ini, pedagang derivatif wajar mempertimbangkan strategi yang mendapat manfaat sama ada daripada penurunan beransur-ansur atau kejatuhan mendadak AUD/USD. Membeli opsyen put dengan tempoh luput dalam satu hingga dua bulan akan datang memberikan cara langsung untuk mengambil posisi menurun, khususnya jika pasangan ini sukar mengekalkan paras psikologi utama seperti 0.6500. Bagi yang mahu mengurangkan kos, strategi bear put spread sesuai untuk mensasarkan pergerakan turun yang lebih spesifik.
Kita juga perlu memantau lantunan jangka pendek, seperti yang berlaku apabila pasangan ini kembali melepasi paras 0.7000 pada penghujung Mac 2025 selepas kejatuhan awal. Sebarang kenaikan menghampiri rintangan, yang kini dilihat sekitar paras 0.6600, boleh memberikan titik kemasukan yang lebih baik untuk membuka posisi jualan baharu. Menjual opsyen call out-of-the-money atau memulakan call spread ketika rali berasaskan kekuatan ini boleh menjadi cara berkesan untuk mengutip premium sambil mengekalkan bias menurun.
Mula berdagang sekarang – Klik di sini untuk membuat akaun sebenar VT Markets
Australia’s PMI Pembuatan awal S&P Global jatuh kepada 50.1 pada Mac daripada 51.0 sebelum ini.
PMI Perkhidmatan S&P Global Australia merosot kepada 46.6 pada Mac daripada 52.8, manakala PMI Komposit turun kepada 47.0 daripada 52.4.
Reaksi Dolar Australia Dan Gambaran Pasaran
Pada masa laporan, AUD/USD turun 0.04% pada hari tersebut, diniagakan pada 0.7019.
Melihat kembali data ekonomi dari perspektif Mac 2025, kami menyaksikan perlambatan ketara di Australia. Sektor perkhidmatan menguncup dengan mendadak dengan bacaan 46.6, menarik indeks komposit keseluruhan turun kepada 47.0. Kejatuhan di bawah ambang 50 mata itu menandakan fasa kelemahan ekonomi yang membimbangkan pada ketika itu.
Jika dibandingkan dengan hari ini, situasinya lebih kompleks, apabila PMI komposit awal Mac 2026 yang terkini telah pulih kepada paras lebih stabil 51.8. Walaupun ini menunjukkan kembali kepada pertumbuhan sederhana, kadar pengangguran telah meningkat beransur-ansur sepanjang setahun lalu, terbaru dilaporkan pada 4.2% bagi Februari 2026. Persekitaran bercampur ini menunjukkan ekonomi masih belum benar-benar kukuh, sekali gus mewujudkan ketidaktentuan mengenai hala tuju seterusnya.
Reserve Bank of Australia (RBA) bertindak balas terhadap kelemahan yang dilihat pada 2025 dengan beberapa siri pemotongan kadar, namun sejak itu berhenti seketika dengan kadar tunai kekal pada 3.10% bagi empat bulan terakhir. Inflasi didapati lebih “degil” daripada jangkaan, dengan data suku tahunan terkini menunjukkan kadar tahunan 3.4%, yang membuatkan RBA kekal berhati-hati. Ketidaktentuan dasar ini menjadi pemacu utama pasaran ketika ini.
Bagi pedagang dolar Australia, ini mewujudkan justifikasi untuk menggunakan opsyen sebagai lindung nilai terhadap pergerakan mengejut. Membeli opsyen put AUD/USD dengan tempoh matang tiga bulan menawarkan kaedah kos efektif untuk melindungi daripada sebarang kejutan ekonomi negatif atau perubahan pendirian dovish daripada RBA. Strategi ini membolehkan penyertaan dalam potensi kenaikan sambil mentakrifkan risiko penurunan dengan jelas.
Strategi Kadar Dan Kedudukan Derivatif
Dalam pasaran kadar faedah, tumpuan seharusnya diberikan kepada derivatif yang mencerminkan perubahan jangkaan terhadap RBA. Kontrak niaga hadapan bon Australia 3 tahun menyaksikan hasilnya meningkat 30 mata asas pada suku ini apabila pasaran mengurangkan harga bagi pemotongan kadar selanjutnya. Pedagang boleh mempertimbangkan untuk menjual opsyen call ke atas niaga hadapan ini, iaitu strategi yang mendapat keuntungan jika jangkaan pasaran terhadap kadar lebih tinggi adalah berlebihan dan hasil stabil atau menurun.
Mula berdagang sekarang – Klik di sini untuk membuat akaun sebenar VT Markets
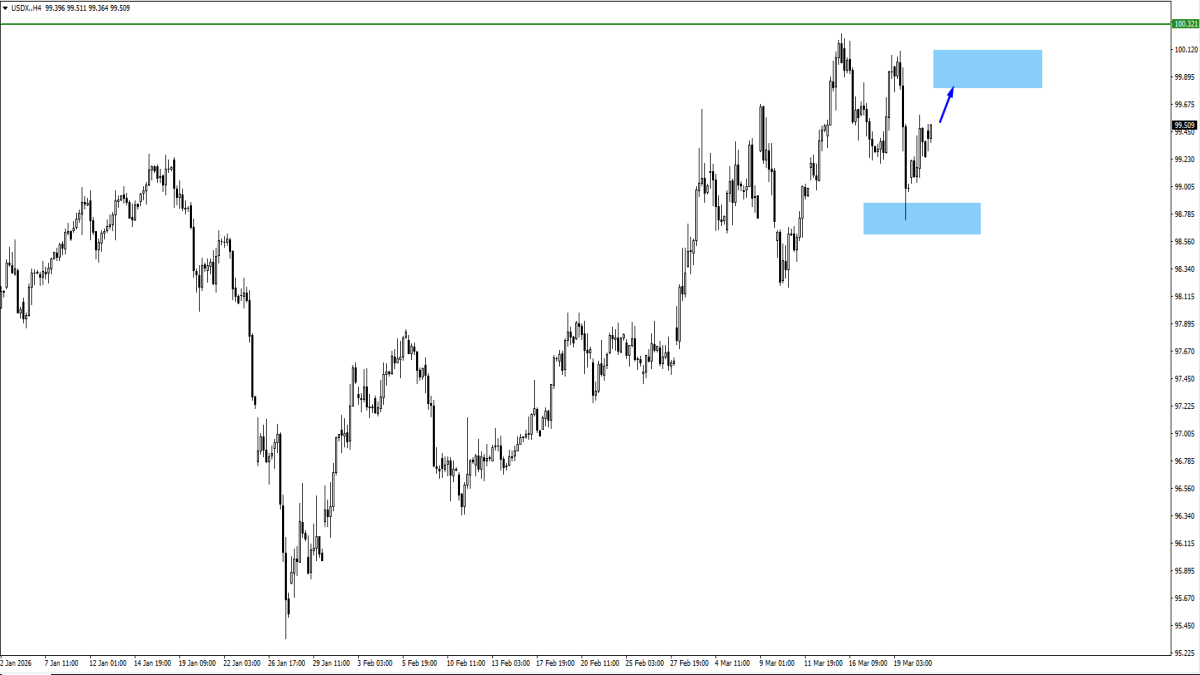
Indeks Dolar AS (DXY) meningkat melepasi 100.00 kepada kira-kira 100.15, sebelum merosot ke sekitar 99.12, turun lebih kurang 0.5% pada hari tersebut. Ia bergerak lebih 125 mata dari paras puncak ke paras terendah dan memadamkan sepenuhnya kenaikan itu dalam tempoh beberapa jam.
Pergerakan itu menyusul kenyataan Presiden AS Donald Trump bahawa serangan yang dirancang ke atas loji jana kuasa dan tapak tenaga Iran akan ditangguhkan selama lima hari. Harga minyak jatuh, dengan WTI merosot lebih 9% ke bawah paras $90 setong dan Brent susut lebih 13% pada paras terendah.
Kejutan Geopolitik Dan Reaksi Pasaran
Iran menafikan bahawa rundingan sedang berlangsung, dan Selat Hormuz kekal ditutup kepada kebanyakan trafik kapal tangki. Konflik ini sudah memasuki minggu keempat.
Rizab Persekutuan mengekalkan kadar pada 3.50% hingga 3.75% pada 18 Mac. Unjuran meletakkan indeks harga PCE pada 2.7% bagi tahun ini, dengan satu pemotongan kadar masih diunjurkan untuk 2026.
Pada carta 5 minit, DXY spot berada pada 99.12 dan berada di bawah EMA 200 tempoh berhampiran 99.33. Rintangan terletak pada 99.20, kemudian 99.33 dan 99.45, manakala sokongan pada 99.10 dan seterusnya 98.90.
Ayunan besar dalam Indeks Dolar menonjolkan kepekaan melampau terhadap tajuk berita geopolitik, mewujudkan persekitaran yang sukar untuk pertaruhan berarah. Julat intrahari 125 mata membayangkan volatiliti tersirat dalam opsyen mata wang, khususnya bagi pasangan USD, berkemungkinan meningkat mendadak dalam beberapa hari akan datang. Pedagang perlu bersedia untuk lebih banyak pergerakan “whiplash” apabila laporan bercanggah dari AS dan Iran menambah ketidaktentuan.
Situasi ini terasa sangat biasa, mengingatkan kita kepada reaksi pasaran terhadap konflik awal di Ukraine pada awal 2022. Dalam tempoh itu, kita melihat harga minyak mentah Brent melonjak seketika menghampiri $140 setong, manakala DXY meningkat didorong permintaan aset selamat. Volatiliti susulan dalam pasaran tenaga memberi kesan langsung kepada jangkaan inflasi dan dasar bank pusat untuk dua tahun berikutnya.
Implikasi Dagangan Dan Susunan Strategi
Memandangkan sifat konflik yang bersifat binari, dengan potensi sama ada penyaheskalasi pantas atau kembali kepada permusuhan secara tiba-tiba, strategi long volatility kelihatan wajar. Kita boleh mempertimbangkan pembelian straddle atau strangle at-the-money pada niaga hadapan indeks USD atau pasangan mata wang utama seperti EUR/USD untuk memanfaatkan pergerakan harga besar ke mana-mana arah. Data Cboe menunjukkan Indeks Volatiliti FX (FXV) secara sejarahnya melonjak ketika tempoh ketegangan geopolitik tinggi, menandakan premium opsyen kini sudah mengambil kira potensi pergerakan yang ketara.
Nada hawkish Rizab Persekutuan, diperkukuh oleh angka inflasi yang kekal tinggi seperti bacaan CPI 3.1% yang kita lihat pada Januari 2025, menyediakan lantai asas untuk dolar. Perjanjian damai yang benar-benar kukuh akan menekan harga minyak, mengurangkan kebimbangan inflasi, dan berpotensi membolehkan Fed mempertimbangkan lebih daripada satu pemotongan kadar, yang akan bersifat bearish untuk dolar. Sebaliknya, jika rundingan gagal, minyak boleh dengan mudah melonjak semula melepasi $100, mengukuhkan keperluan Fed untuk kekal ketat dan mendorong DXY kembali ke arah paras tertinggi terbaharu.
Pedagang boleh menggunakan paras teknikal yang diberikan untuk menyusun posisi berdasarkan hasil berpotensi ini. Sebagai contoh, membeli opsyen put dengan strike berhampiran paras sokongan 98.90 boleh menjadi cara yang kos efektif untuk memposisikan diri bagi penembusan diplomatik. Sebaliknya, penembusan yang disahkan kembali di atas rintangan utama 99.33 boleh menjadi pencetus untuk memulakan strategi opsyen call bullish yang menyasarkan ujian semula paras 100.00.
Selain dolar itu sendiri, kejatuhan mendadak minyak mentah mewujudkan peluang dalam kelas aset lain. Opsyen ke atas ETF sektor tenaga berkemungkinan menyaksikan aktiviti meningkat apabila pedagang memposisikan diri sama ada untuk penurunan harga yang berterusan atau lantunan semula yang agresif. Kita juga perlu memantau mata wang negara pengeksport minyak, kerana dolar Kanada dan krone Norway kini berada di bawah tekanan ketara dan boleh melihat penurunan lanjut jika harga minyak kekal tertekan.
Mula berdagang sekarang – Klik di sini untuk membuat akaun sebenar VT Markets
PMI Komposit S&P Global Australia merosot kepada 47.0 pada Mac, turun daripada 52.4 sebelum ini.
Bacaan di bawah 50 menunjukkan penguncupan, manakala bacaan melebihi 50 menunjukkan pengembangan.
Aktiviti Sektor Swasta Beralih Ke Negatif
Data PMI terkini menunjukkan peralihan mendadak daripada pengembangan kepada penguncupan dalam sektor swasta Australia. Angka 47.0 ini merupakan kejutan negatif yang ketara berbanding bacaan 52.4 bulan lalu. Ini wajar dilihat sebagai isyarat utama bahawa tekanan ekonomi (headwinds) semakin mengukuh dengan ketara.
Kemerosotan yang tidak dijangka ini berkemungkinan menyuntik ketidakpastian yang besar ke dalam pasaran. Kami menjangkakan lonjakan volatiliti tersirat pada indeks ASX 200. Pedagang wajar mempertimbangkan untuk membeli volatiliti melalui instrumen seperti straddle, sebagai persediaan menghadapi pergerakan harga yang lebih besar dalam beberapa minggu akan datang.
Reserve Bank of Australia (RBA) kini berada di bawah tekanan besar untuk mengambil pendirian yang lebih dovish, meskipun inflasi masih melebihi sasaran setakat penghujung 2025. Bacaan PMI ini menjadikan kenaikan kadar faedah pada masa hadapan sangat tidak mungkin dan mengalihkan tumpuan kepada potensi pemotongan kadar. Niaga hadapan kadar faedah perlu dilaraskan bagi mengambil kira kebarangkalian yang lebih tinggi untuk pelonggaran dasar RBA sebelum akhir tahun.
Ekonomi yang menguncup secara langsung mengancam pendapatan korporat, menjadikan prospek ekuiti cenderung bearish. Kami wajar mempertimbangkan pembentukan posisi jual (short) pada niaga hadapan indeks ASX 200. Pembelian opsyen put pada XJO menyediakan kaedah yang jelas serta berisiko terhad untuk memposisikan bagi kemungkinan penurunan pasaran.
Tekanan Meningkat Terhadap AUD Dan Sektor Kitaran
Data ini bersifat bearish untuk dolar Australia, khususnya apabila harga komoditi utama seperti bijih besi sudah pun merosot lebih 15% tahun ini. Prospek kadar faedah yang lebih rendah akan terus membebankan mata wang tersebut. Kami wajar mempertimbangkan untuk menjual (short) niaga hadapan AUD/USD atau membeli opsyen put pada mata wang itu.
Mula berdagang sekarang – Klik di sini untuk membuat akaun sebenar VT Markets
PMI Perkhidmatan S&P Global Australia merosot kepada 46.6 pada Mac, turun daripada 52.8 pada bulan sebelumnya.
Bacaan di bawah 50 menunjukkan penguncupan, manakala bacaan melebihi 50 menunjukkan pengembangan.
Kejutan PMI Perkhidmatan Dan Implikasi Pasaran
Kejatuhan mendadak PMI perkhidmatan daripada 52.8 kepada 46.6 merupakan satu amaran besar kepada ekonomi Australia. Ini menandakan sektor perkhidmatan, pemacu utama pertumbuhan, kini menguncup secara tidak dijangka. Oleh itu, kita wajar menjangkakan sentimen menurun yang lebih ketara terhadap ekuiti Australia dan dolar tempatan dalam beberapa minggu akan datang.
Kemerosotan mengejut ini berkemungkinan mencetuskan lonjakan volatiliti tersirat pada indeks seperti ASX 200. Ini menjadikan pembelian opsyen put perlindungan lebih mahal, namun berpotensi lebih diperlukan sebagai lindung nilai terhadap penurunan lanjut. Kita boleh mempertimbangkan put spread untuk merendahkan kos kemasukan sambil bersedia menghadapi kemungkinan susut nilai ke arah paras 7,500, iaitu zon sokongan yang pernah diuji pada akhir 2025.
Pasaran kini akan segera mengambil kira kebarangkalian pemotongan kadar faedah yang lebih tinggi oleh Reserve Bank of Australia (RBA) lewat tahun ini. Baru minggu lalu, niaga hadapan antara bank hanya menilai sekitar 20% peluang pemotongan menjelang Ogos; kami menjangkakan angka itu melonjak melebihi 50% susulan berita ini. Tinjauan ini memberi tekanan menurun kepada dolar Australia, menjadikan posisi jual AUD/USD melalui niaga hadapan atau opsyen kelihatan menarik.
Situasi ini mengingatkan kepada kebimbangan perlambatan yang dilihat pada 2024, apabila inflasi yang degil menghalang RBA daripada melonggarkan dasar walaupun isyarat pertumbuhan semakin lemah. Kita wajar lebih berhati-hati terhadap saham pengguna budi bicara (consumer discretionary) dan perbankan, kerana kedua-duanya sangat sensitif kepada kesihatan sektor perkhidmatan serta jangkaan kadar faedah. Setakat suku tahun lalu, perbelanjaan pengguna sudah pun susut 0.5%, dan data ini mencadangkan trend tersebut semakin merosot.
Kelemahan ini juga mungkin mencerminkan laporan terbaru mengenai penggunaan perkhidmatan China yang mula semput, yang jatuh 1.5% bulan lalu. Kebergantungan Australia kepada permintaan China bagi perkhidmatan pelancongan dan pendidikan bermakna perlambatan di sana memberi kesan langsung kepada angka domestik kita. Oleh itu, kita perlu memantau data ekonomi China dengan lebih rapi sebagai petunjuk awal kepada hala tuju pasaran kita sendiri.
Pautan China Dan Risiko Ke Hadapan
Mula berdagang sekarang – Klik di sini untuk membuat akaun sebenar VT Markets
Indeks Pengurus Pembelian (PMI) Pembuatan S&P Global Australia susut kepada 50.1 pada Mac, daripada 51 pada bulan sebelumnya.
Bacaan 50 menandakan garis pemisah antara pengembangan dan penguncupan dalam sektor pembuatan. Pada 50.1, indeks ini menunjukkan output hampir tidak berubah pada Mac.
Pertumbuhan Pembuatan Hampir Terhenti
Data baharu ini menunjukkan sektor pembuatan Australia hampir terhenti, dengan pertumbuhan perlahan ke tahap yang sangat minimum. Kejatuhan kepada 50.1 hanya sedikit di atas paras pengembangan, menandakan momentum ekonomi semakin pudar dengan pantas. Ini wajar dilihat sebagai petunjuk awal potensi kelemahan bagi ekonomi Australia secara lebih luas dalam minggu-minggu akan datang.
Berikutan kelembapan ini, Bank Rizab Australia (RBA) kini kurang berkemungkinan mempertimbangkan kenaikan kadar faedah lanjut. Ini memberi tekanan menurun kepada dolar Australia, justeru kami memantau peluang untuk mengambil posisi jual (short) pasangan mata wang AUD/USD. Pedagang derivatif boleh mempertimbangkan pembelian opsyen put ke atas dolar Australia, dengan jangkaan pergerakan menurun.
Bagi pasaran saham Australia, bacaan ini merupakan isyarat menurun (bearish) terhadap pendapatan korporat, khususnya dalam sektor perindustrian dan bahan. Kita boleh melihat pedagang mula mengambil kira risiko kemelesetan dengan membeli opsyen put ke atas indeks ASX 200. Menjual spread call merupakan satu lagi strategi untuk memanfaatkan pasaran yang dijangka sukar mencatat rali besar dari sini.
Angka PMI ini menyokong keputusan terkini bank pusat untuk mengekalkan kadar tunai pada 4.35%, paras yang dikekalkan sejak beberapa bulan lalu. Data inflasi juga semakin reda daripada paras tinggi yang dilihat pada 2024, namun ia masih berterusan. RBA kini terperangkap antara kelemahan ekonomi ini dan usaha mengekang inflasi.
Kami melihat corak serupa iaitu PMI yang melemah pada awal 2025, yang mendahului tempoh volatiliti ketara dalam pasaran ekuiti. Konteks sejarah itu mencadangkan persediaan untuk peningkatan turun naik harga. Situasi semasa mencerminkan tempoh tersebut, apabila keyakinan ekonomi mula merosot dengan ketara.
Permintaan China Menambah Cabaran
Kelembapan domestik ini diperkuat oleh data pembuatan China yang terkini, yang turut menunjukkan ketiadaan pemulihan kukuh. Sebagai rakan dagang terbesar Australia, permintaan yang lembap dari China memberi kesan langsung kepada eksport komoditi utama seperti bijih besi. Ini mengukuhkan prospek berhati-hati atau menurun terhadap saham perlombongan utama negara.
Mula berdagang sekarang – Klik di sini untuk membuat akaun sebenar VT Markets
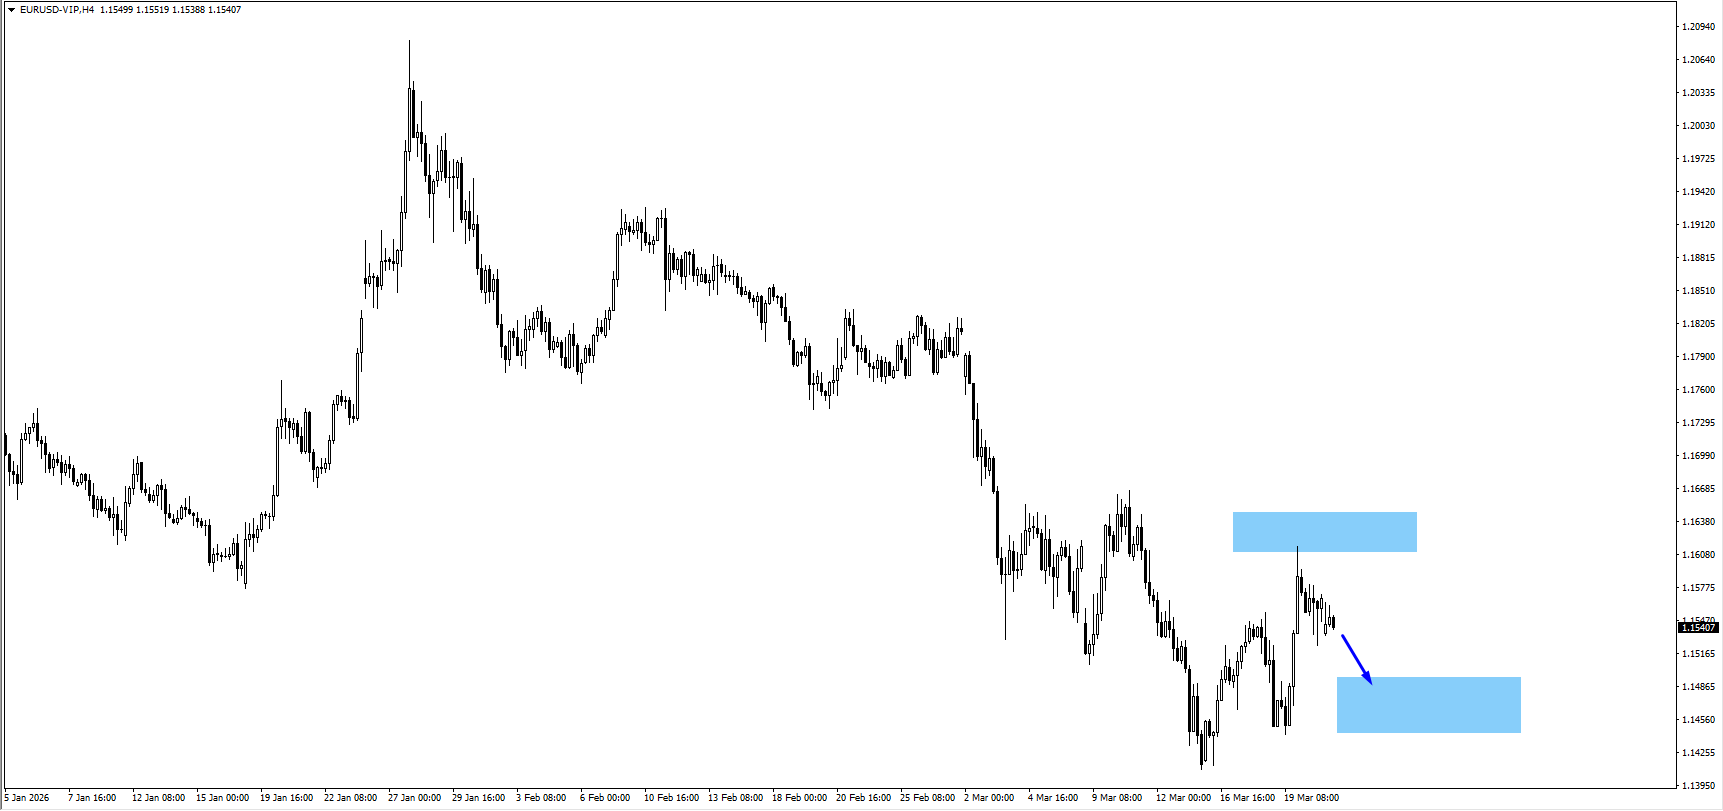
EUR/USD meningkat 0.37% kepada 1.1613 pada Isnin selepas melantun dari paras hampir 1.1484. Pergerakan itu susulan hantaran Donald Trump mengenai gencatan senjata lima hari selepas rundingan antara Tehran dan Washington, yang melemahkan Dolar AS.
Berita geopolitik mendominasi dagangan apabila selera risiko bertambah baik, manakala harga minyak, hasil Perbendaharaan AS, dan Dolar AS merosot. Indeks Dolar AS turun 0.37% kepada 99.13 selepas mencecah 100.14, dan pergerakan dolar selari dengan West Texas Intermediate.
Ketegangan Geopolitik Dan Reaksi Pasaran
Ketegangan kekal apabila Iran dilaporkan melepaskan dua peluru berpandu balistik jarak sederhana ke Diego Garcia, manakala amaran AS tertumpu pada Selat Hormuz. CBS melaporkan pegawai AS berkata selat itu mengandungi kira-kira sedozen periuk api Iran.
Dengan data ekonomi yang terhad, pasaran memerhati ulasan bank pusat dan penetapan harga dasar. Pasaran tidak menjangkakan pemotongan kadar faedah AS tahun ini, manakala kebarangkalian kenaikan kadar ECB hampir 64% untuk 30 April dan 74% untuk Jun, dengan hampir 35 mata asas telah diambil kira.
Dari sudut teknikal, EUR/USD berada berhampiran 1.1614, dengan rintangan pada 1.1640, 1.1690, dan sekitar 1.1730. Sokongan disebut pada 1.1570, 1.1510, dan 1.1420, dengan RSI sekitar 48.
Gencatan sementara itu telah menambah ketidaktentuan yang ketara, menjadikan hala tuju jangka pendek sukar diramal. Kita wajar mempertimbangkan pembelian volatiliti melalui opsyen, seperti straddle atau strangle, untuk meraih manfaat daripada ayunan harga besar ke mana-mana arah jika gencatan bertahan atau runtuh. Mengimbas kejutan geopolitik pada awal 2022, volatiliti tersirat 3 bulan bagi EUR/USD melonjak lebih 35% dalam beberapa minggu, corak yang boleh berulang.
Namun, tinjauan asas dilihat memihak kepada euro berikutan perbezaan dasar bank pusat yang jelas. Dengan ECB memberi isyarat potensi kenaikan kadar sementara Fed kelihatan lebih berhati-hati, strategi jangka sederhana boleh melibatkan pembelian opsyen panggilan (call) EUR/USD untuk menangkap potensi kenaikan melepasi “hingar” geopolitik semasa. Ini bertentangan dengan trend yang dilihat pada 2022, apabila jadual kenaikan kadar agresif Fed menekan EUR/USD di bawah pariti sementara ECB ketinggalan.
Strategi Opsyen Dan Paras Teknikal Utama
Kita juga perlu melindung nilai daripada pembalikan mengejut sekiranya gencatan gagal dan penghindaran risiko kembali, sekali gus mengukuhkan Dolar AS. Kegagalan rundingan boleh menyebabkan harga minyak melonjak semula, seiring dengan bagaimana minyak mentah WTI pernah melonjak lebih 60% pada separuh pertama 2022, yang akan menambah tekanan inflasi kepada Fed dan menyokong dolar. Pembelian opsyen put EUR/USD di luar wang (out-of-the-money) boleh menjadi cara yang kos-efektif untuk melindungi daripada kejatuhan mendadak kembali ke paras rendah 1.1484.
Secara teknikal, paras 1.1730 mewakili zon rintangan utama, menjadikannya harga mogok (strike) yang menarik untuk menjual covered call bagi menjana pendapatan jika kita menjangka rali terhenti di situ. Sebaliknya, penembusan di bawah sokongan 1.1570 boleh mencetuskan jualan lanjut, yang mencadangkan paras mogok itu boleh menjadi tahap utama untuk put perlindungan. Pasaran menilai kebarangkalian 64% untuk kenaikan kadar ECB menjelang April, jadi kita wajar menjangka tekanan menaik berterusan ke atas euro selagi konflik reda.
Mula berdagang sekarang – Klik di sini untuk membuat akaun sebenar VT Markets
NZD/USD didagangkan berhampiran 0.5860 pada awal sesi Asia, selepas mengembalikan hampir separuh daripada kenaikan intrahari lewat sesi AS. Pasangan itu kali terakhir dicatat sekitar 0.5856 pada carta 4 jam.
Selera risiko bertambah baik selepas Donald Trump memberi petunjuk kemungkinan penyaheskalasian dengan Iran, dengan menyebut “titik persetujuan utama” dan berharap pertemuan dapat diadakan tidak lama lagi. Ini mengurangkan permintaan terhadap aset selamat dan menyokong mata wang berkait risiko.
Pemacu Pasaran Dan Nada Dolar
Indeks Dolar AS didagangkan di bawah 100.00 pada 99.10 apabila pasaran menilai semula prospek dasar Rizab Persekutuan. Dolar yang lebih stabil mengehadkan potensi kenaikan NZD/USD.
Di Asia, sentimen yang stabil dan keadaan komoditi yang lebih kukuh memberikan sokongan tambahan kepada dolar New Zealand. Namun, kenaikan terhad oleh ketidaktentuan mengenai pertumbuhan global dan perdagangan.
Dari segi teknikal, harga kekal di atas sokongan dan berada sedikit di atas purata bergerak 20 tempoh pada 0.5837, manakala purata bergerak 100 tempoh berhampiran 0.5884 mengehadkan kemajuan. RSI berada pada 53, menunjukkan momentum yang seimbang.
Paras sokongan ialah 0.5842, kemudian 0.5804 dan 0.5763. Rintangan berada pada 0.5881, dan penembusan di atasnya boleh membuka ruang untuk kenaikan selanjutnya.
Konteks Sejarah Dan Rejim Semasa
Kami mengingati suasana pasaran yang serupa pada 2025 apabila sentimen risiko yang bertambah baik mendorong NZD/USD menghampiri paras 0.5860. Ketika itu, penyaheskalasian geopolitik dan dolar AS yang mengukuh secara mendatar mewujudkan lantai yang rapuh untuk kiwi. Tempoh tersebut mengajar bahawa dinamik “risk-on” boleh menyokong mata wang dengan pantas, walaupun kenaikan mungkin terhad.
Hari ini, keadaan telah berubah, dengan pasangan ini didagangkan jauh lebih tinggi sekitar 0.6155. Pemacu utama kini ialah perbezaan dasar bank pusat, dengan data inflasi suku tahunan terkini New Zealand pada akhir 2025 kekal pada 3.1%, mengekalkan RBNZ pada pendirian hawkish. Sebaliknya, AS menyaksikan inflasi teras menyejuk kepada 2.5%, mencetuskan spekulasi bahawa Rizab Persekutuan mungkin menjadi yang pertama menurunkan kadar faedah tahun ini.
Berdasarkan jangkaan ini, pedagang wajar mempertimbangkan pembelian opsyen panggilan (call) NZD/USD untuk memanfaatkan potensi kenaikan. Opsyen dengan harga mogok 0.6200 dan tamat tempoh Jun 2026 akan memberikan pendedahan kepada aliran menaik yang dijangkakan. Strategi ini membolehkan keuntungan ketara sekiranya perbezaan dasar terus mendorong pasangan ini lebih tinggi.
Bagi mereka yang lebih berhati-hati terhadap “kenaikan perlahan” seperti yang pernah dilihat sebelum ini, bull call spread ialah alternatif yang berdaya maju. Dengan membeli call 0.6200 dan pada masa sama menjual call 0.6275, pedagang boleh mengurangkan kos awal. Ini mengehadkan keuntungan maksimum tetapi menawarkan cara yang lebih kos efektif untuk bertaruh pada kenaikan sederhana dan terkawal.
Volatiliti tersirat bagi kiwi kini sederhana, menjadikan harga opsyen berpatutan berbanding lonjakan yang dilihat semasa kebimbangan pertumbuhan global pada 2025. Persekitaran ini sesuai untuk membina kedudukan baharu tanpa membayar premium masa yang terlalu mahal. Kita wajar menggunakan tempoh ketenangan relatif ini untuk membuat posisi bagi pergerakan arah seterusnya.
Mula berdagang sekarang – Klik di sini untuk membuat akaun sebenar VT Markets
Pembuat dasar dilihat membuat andaian bahawa kejutan minyak yang terkait dengan konflik Iran akhirnya akan mereda, membolehkan pertumbuhan kekal kukuh dan inflasi kembali normal.
Andaian itu kini menjadi risiko terbesar pasaran. Jika harga tenaga kekal tinggi, Fed mungkin dipaksa mengambil pendirian lebih lama dengan kadar “tinggi untuk lebih lama”.
Risiko pasaran terbesar ialah ketidakpadanan dasar: unjuran pertumbuhan lebih kukuh, unjuran inflasi lebih tinggi dan panduan pemotongan kadar yang berterusan sukar untuk diselaraskan.
Ketidaktentuan kepimpinan sekitar Jerome Powell dan jangkaan kemasukan Kevin Warsh menambah satu lagi lapisan ketegangan dasar dan pasaran.
Tumpuan minggu ini ialah sama ada pergerakan harga merentas dolar, minyak, emas, ekuiti dan kripto mengesahkan penetapan semula makro yang lebih mendalam.
Rizab Persekutuan (Fed) sedang cuba mempertahankan naratif yang semakin sukar diterima pasaran.
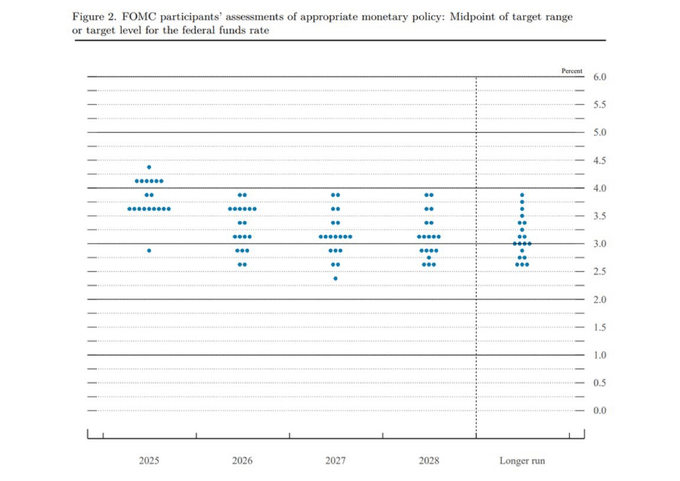
Pada mesyuarat FOMC Mac 2026, pegawai mengundi 11–1 untuk mengekalkan kadar penanda aras tidak berubah pada 3.50% hingga 3.75%. Pada zahirnya, keputusan itu kelihatan stabil dan berhemah. Titik median (dot plot) masih menunjukkan satu pemotongan kadar pada 2026.
Namun, perinciannya menceritakan kisah yang lebih berhati-hati.
Pengerusi Jerome Powell mengakui dua masalah segera. Data inflasi sudah pun lebih kukuh daripada jangkaan sebelum konflik Iran memuncak, dan latar geopolitik kini menjadikan haluan ke hadapan
lebih sukar dijangka. Fed menaikkan unjuran inflasi PCE 2026 kepada 2.7%, daripada 2.4% pada Disember, sambil memberi isyarat bahawa masih terlalu awal untuk mengukur sepenuhnya kerosakan ekonomi akibat perang serta risiko bekalan yang berkaitan di Selat Hormuz.
Ini meninggalkan satu persoalan yang tidak selesa kepada pasaran: jika inflasi semakin meningkat dan risiko geopolitik bertambah, mengapa Fed masih cuba mengekalkan prospek pemotongan kadar?
Dot Plot Nampak Stabil, Tetapi Terasa Kurang Dovish
‘Dot plot’ Rizab Persekutuan (Ihsan: Rizab Persekutuan)
Unjuran median masih mencadangkan satu pemotongan, tetapi peralihan dalaman lebih penting daripada tajuk utama.
Powell berkata empat atau lima ahli mengubah unjuran mereka daripada dua pemotongan kepada satu, menunjukkan pusat graviti jawatankuasa kini beralih ke arah lebih berhati-hati. Dengan kata lain, dot plot tidak runtuh, namun ia menjadi kurang dovish.
Ini penting kerana pasaran lazimnya bertindak balas terlebih dahulu terhadap tajuk utama, kemudian perlahan-lahan mengejar taburan di sebaliknya.
Fed pada asasnya memberitahu pasaran bahawa inflasi kekal degil, risiko minyak adalah nyata, dan ketidakpastian meningkat, namun sebahagian pelonggaran dasar masih berkemungkinan pada separuh kedua tahun ini. Ini hanya berfungsi jika kejutan tenaga pudar dan tekanan harga yang lebih luas kembali reda.
Buat masa ini, ia lebih kelihatan sebagai satu andaian berbanding satu kesimpulan.
Percanggahan Dalam Unjuran Pertumbuhan
Mesej terkini Fed bukan sahaja membayangkan peningkatan pada unjuran inflasi, malah pegawai juga dilihat menaikkan unjuran pertumbuhan KDNK 2026 kepada 2.4%. Ini mewujudkan ketegangan di teras prospek makro.
Jika konflik Iran cukup serius untuk menaikkan jangkaan inflasi dan mengancam pasaran tenaga, maka mengunjurkan pertumbuhan yang lebih kuat pada masa yang sama mencerminkan pandangan yang sangat jinak tentang betapa sementara kejutan itu.
Fed kelihatan mempertaruhkan bahawa permintaan AS mampu menyerap kos tenaga yang lebih tinggi tanpa menjejaskan momentum secara bermakna. Ini mungkin tepat, tetapi jalannya sempit.
Jika minyak kekal tinggi, ekonomi boleh meluncur ke arah konfigurasi lebih stagflasi, di mana inflasi kekal kukuh sementara pertumbuhan merosot. Dalam persekitaran itu, pemotongan kadar yang diunjurkan menjadi lebih sukar untuk dibenarkan.
“Tinggi Untuk Lebih Lama” Senyap-senyap Menjadi Kes Asas
Pasaran mungkin masih fokus pada tajuk “satu pemotongan,” tetapi isyarat lebih mendalam daripada mesyuarat itu ialah tinggi untuk lebih lama kekal sebagai kecenderungan dasar yang dominan.
Fed tidak mahu kedengaran terlalu hawkish ketika pasaran sudah berdepan risiko perang dan sentimen rapuh. Namun unjuran mereka sendiri bergerak ke arah itu. Jika inflasi kekal degil dan minyak tidak susut, satu pemotongan yang diunjurkan itu mungkin hilang sepenuhnya.
Itulah sebabnya pergerakan harga merentas aset minggu ini amat penting. Pasaran kini menguji sama ada keseimbangan optimistik Fed antara pertumbuhan, inflasi dan pelonggaran masih boleh bertahan.
Peralihan Kepimpinan Menambah Satu Lagi Lapisan Risiko
Gambaran makro turut menjadi lebih rumit akibat ketidaktentuan kepimpinan dalam Fed.
Kemasukan Kevin Warsh yang dijangka pada Jun memperkenalkan dimensi politik dan dasar yang tidak boleh diabaikan pasaran. Warsh dilihat meluas sebagai lebih menyokong kadar yang lebih rendah, namun beliau mungkin melangkah masuk ke dalam persekitaran di mana latar inflasi memberikan ruang yang sangat terhad untuk pelonggaran awal.
Geseran politik berkaitan sepina DOJ dan dinamik pengesahan Senat boleh mengekalkan Powell lebih lama daripada jangkaan, sekali gus melengahkan peralihan kepimpinan yang jelas. Ketidakpastian itu boleh penting kepada psikologi pasaran, khususnya jika pedagang mula menilai bukan sahaja langkah kadar seterusnya, tetapi juga rejim pembuat dasar yang seterusnya.
Dalam praktiknya, Warsh mungkin mewarisi Fed yang kekal terperangkap dalam kerangka “tinggi untuk lebih lama”, tanpa mengira keutamaan dasar peribadinya.
Adakah Fed Kehilangan Haluan?
Di bawah logik makro standard, apabila unjuran pertumbuhan meningkat dan unjuran inflasi meningkat, hujah untuk memotong kadar menjadi lebih lemah, bukannya lebih kuat. Kekal tidak berubah memang masuk akal. Memberi isyarat walaupun satu pemotongan menjadi jauh lebih boleh dipertikaikan.
Fed telah mengakui ketidakpastian daripada konflik Iran, mengakui tekanan inflasi sudah pun meningkat, namun masih mengekalkan idea pelonggaran pada masa hadapan. Gabungan inilah yang membuatkan prospek terkini terasa tidak stabil dan malah remeh.
Tafsiran yang lebih berhemah ialah pembuat dasar cuba mengelak daripada bertindak balas berlebihan terhadap apa yang masih dilihat sebagai kejutan geopolitik sementara. Tafsiran yang lebih keras ialah Fed cuba mengekalkan ketenangan pasaran sedangkan logik dalaman unjurannya semakin sukar dipertahankan.
Apa pun, pedagang sepatutnya kurang memberi perhatian kepada titik median semata-mata dan lebih kepada hala tuju jawatankuasa. Mesej yang lebih luas ialah pegawai sedang hanyut ke arah lebih sedikit pemotongan, lebih berhati-hati dan kurang keyakinan terhadap naratif disinflasi.
Peristiwa Akan Datang
Tarikh
Mata wang
Peristiwa
Ramalan
Sebelumnya
Ulasan Penganalisis
24 Mac
USD / EUR / GBP
PMI Awal
—
—
Bacaan bermakna pertama sama ada risiko perang dan kos tenaga lebih tinggi mula menjejaskan aktiviti seperti yang dilihat pada simbol di bawah.
25 Mac
JPY
CPI Jepun (Februari)
—
1.50%
Bacaan inflasi yang lebih panas boleh menghidupkan semula jangkaan pengetatan BOJ serta menjadikan sebarang kenaikan baharu USDJPY lebih sensitif.
25 Mac
USD
Harga Import dan Eksport AS (Feb)
—
—
Semakan inflasi peringkat kedua yang berguna. Jika harga import kekal kukuh, ia mengukuhkan pandangan bahawa Fed mungkin perlu kekal berhati-hati walaupun masih mengunjurkan pemotongan.
26 Mac
USD
Tuntutan Awal Pengangguran
211K
205K
Ketahanan pasaran buruh akan mengukuhkan pendirian berhati-hati Fed dan mengekalkan sokongan kepada dolar. Aliran tuntutan yang lebih lembut boleh meredakan sebahagian tekanan ke atas aset berisiko.
Untuk gambaran penuh peristiwa ekonomi akan datang, lihat Kalendar Ekonomi VT Markets.
Pergerakan Utama Minggu Ini
Minggu ini kurang tentang apa yang Fed katakan dan lebih tentang sama ada pasaran mempercayainya. Bagi pasaran, mesej terkini Fed mengukuhkan susun atur merentas aset yang rapuh.
Dolar AS mungkin kekal kukuh jika peralihan hawkish yang tersirat oleh Fed menjadi lebih jelas melalui penetapan harga kadar.
Minyak kekal menjadi teras. Selagi risiko geopolitik mengekalkan pasaran tenaga ketat, jangkaan inflasi kekal terdedah kepada satu lagi lonjakan.
Emas mungkin terus disokong oleh ketidakpastian dasar, tekanan geopolitik dan keraguan terhadap ketahanan disinflasi sebenar.
Ekuiti boleh bergelut jika pelabur mula menerima bahawa pemotongan kadar mungkin tidak hadir semudah yang dijangkakan sebelum ini, khususnya jika optimisme pertumbuhan mula pudar.
Aset berisiko secara lebih luas, termasuk kripto, mungkin berdepan latar yang lebih mencabar jika pasaran mula mengambil kira tempoh dasar yang lebih ketat dalam persekitaran makro yang sudah pun tidak menentu.
Penolakan di kawasan itu boleh mencetuskan konsolidasi.
Penerimaan di atasnya akan mengukuhkan naratif “tinggi untuk lebih lama”.
EURUSD
Perhatikan minggu ini
Fokus penurunan jangka dekat pada 1.1475.
Tindakan harga yang lemah di kawasan itu mengekalkan tekanan ke atas pasangan ini.
Pertahanan yang kukuh boleh memperlahankan pengukuhan dolar.
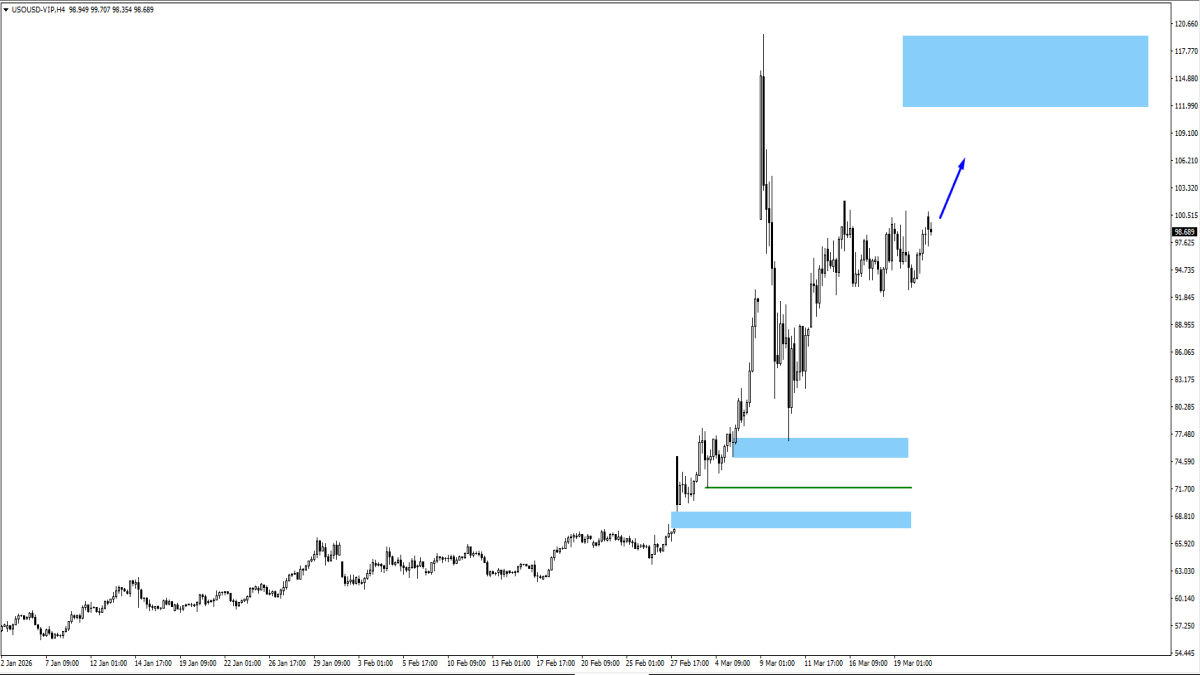
Minyak AS
Perhatikan minggu ini
Pecah dan bertahan di atas 99.284.
Lanjutan kenaikan ke arah 112.20.
Sebarang berita penyaheskalasi boleh mencetuskan risiko pembetulan semula yang ketara.
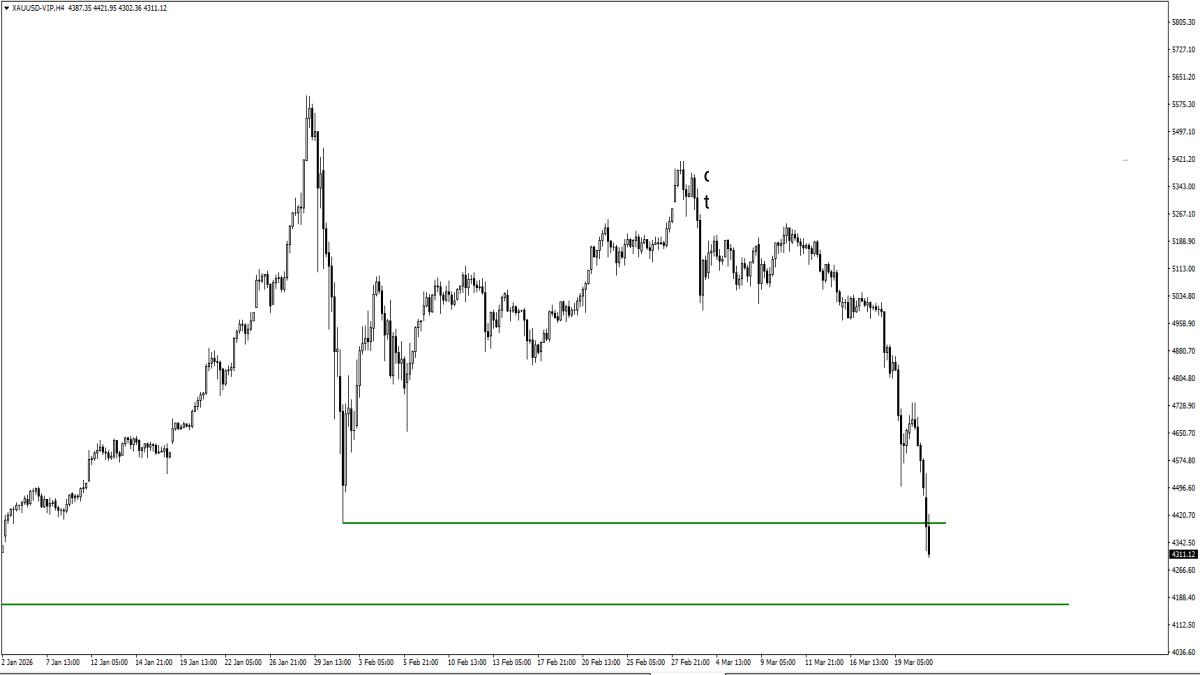
XAUUSD
Perhatikan minggu ini
Reaksi sokongan semasa selepas penembusan 4402.73.
Penembusan di bawah 4169 akan membuka satu lagi gelombang penurunan.
Penstabilan boleh menghasilkan fasa konsolidasi sementara.
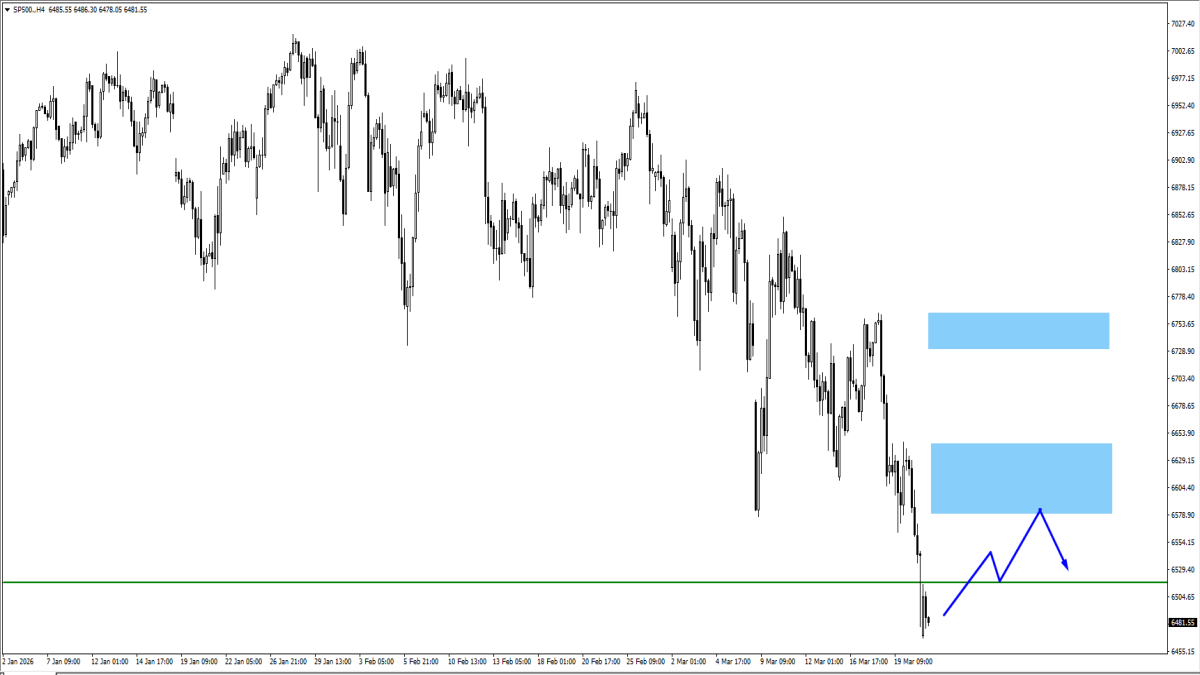
SP500
Perhatikan minggu ini
Pecahan ke bawah 6517.
Zon lantunan menurun pada 6600 dan 6750.
Struktur pemulihan yang lemah akan selari dengan naratif risiko Fed/minyak.
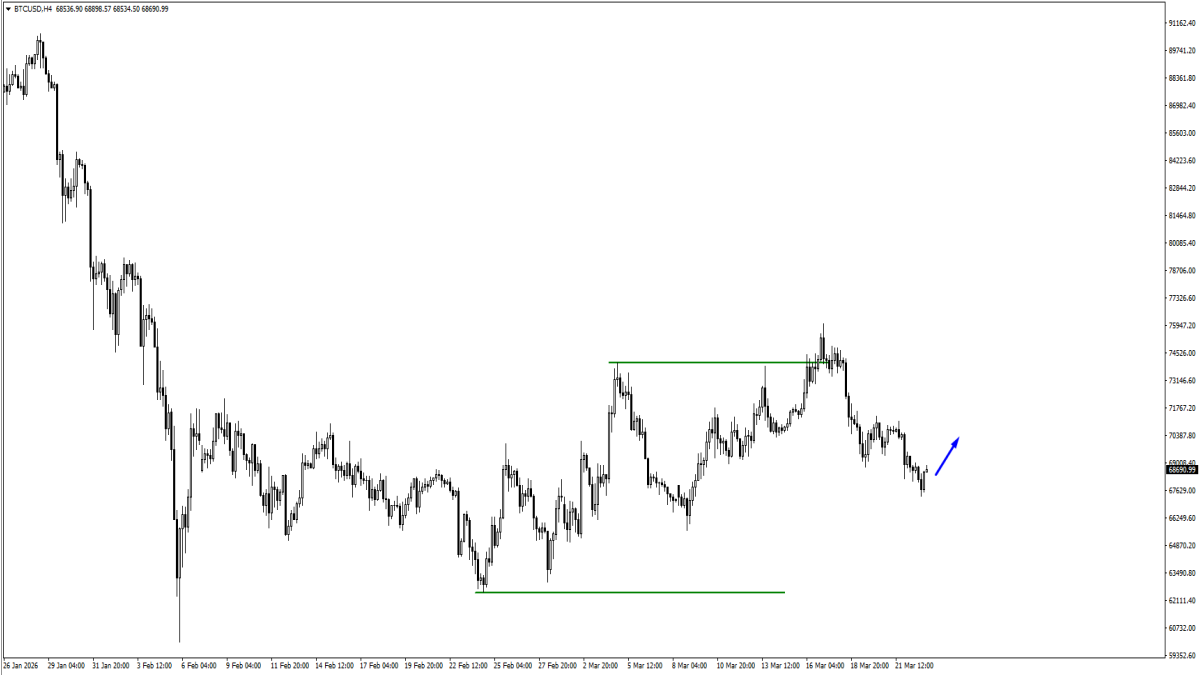
BTCUSD
Perhatikan minggu ini
Fokus lantunan ke arah 70550.
Penolakan di kawasan itu akan mengekalkan struktur rapuh.
Penerimaan kukuh akan mencadangkan selera risiko yang lebih luas sedang stabil.
Kesimpulan
Untuk minggu ini, tema utama pasaran adalah mudah: dot plot mungkin masih kelihatan teratur di permukaan, tetapi logik di bawahnya mula retak.
FOMC Mac 2026 bukanlah jeda dovish yang jelas. Ia adalah jeda yang membawa peralihan dalaman yang lebih hawkish.
Dot plot masih menunjukkan satu pemotongan, tetapi pasaran mula mempersoalkan sama ada panduan itu mampu bertahan dengan inflasi yang lebih tinggi, risiko tenaga dipacu perang, dan unjuran pertumbuhan yang masih optimistik. Ketegangan inilah yang paling penting minggu ini.
Jika carta terus mengesahkan minyak yang lebih kukuh, dolar yang lebih teguh, dan selera risiko yang melemah, pasaran mungkin membuat kesimpulan bahawa pelan hala tuju terkini Fed sudah pun kehilangan kredibiliti.
Buka akaun VT Markets secara langsung hari ini untuk mengakses ciri platform kami, termasuk pandangan pasaran dan kandungan pendidikan.
Mula berdagang sekarang – Klik di sini untuk membuat akaun sebenar VT Markets