Mixed Sentiment in Stock and Currency Markets Amid Inflation and Geopolitical Concerns

Major stock indices, including the Dow Jones Industrial Average, S&P 500, and Nasdaq Composite, saw modest gains as investors awaited U.S. consumer inflation figures and monitored Treasury yields’ retreat. The market was also influenced by expectations of the consumer price index report and Federal Reserve policy, while Exxon Mobil announced a significant acquisition and Birkenstock faced a challenging market debut. Geopolitical tensions in Israel and Hamas contributed to market uncertainty. In the currency market, the US Dollar remained flat despite positive wholesale inflation data and FOMC minutes, with the focus shifting to the impending Consumer Price Index release and divergent views among committee members. The US Dollar Index and Treasury yields experienced minor fluctuations, while currency pairs like EUR/USD and GBP/USD demonstrated varied behavior. Gold and Silver rallied due to lower yields and a weakened US Dollar.

Stock Market Updates

In Wednesday’s stock market, major indices saw modest gains as investors eagerly awaited the release of the new U.S. consumer inflation figures, while Treasury yields continued their retreat. The Dow Jones Industrial Average rose by 0.19%, or 65.57 points, closing at 33,804.87. The S&P 500 experienced a 0.43% increase, ending the day at 4,376.95, while the Nasdaq Composite, dominated by tech stocks, surged 0.71% and closed above its 50-day moving average for the first time since September 14. This marked the fourth consecutive day of gains for these key indices. Investors were also anticipating the consumer price index report for September, with economists predicting a 0.3% increase from the previous month and a year-over-year rise of 3.6%. This data was seen as critical for insights into future Federal Reserve policy moves, especially after the recent revelation of hotter-than-expected wholesale inflation figures. Additionally, the release of minutes from the Fed’s September meeting indicated that a majority of officials believed one more interest rate hike was likely, with rising Treasury yields playing a significant role in their considerations.

On the corporate front, Exxon Mobil announced the acquisition of shale driller Pioneer Natural Resources in an all-stock deal worth $59.5 billion, marking the largest merger announced on Wall Street in the year. Meanwhile, sandal manufacturer Birkenstock faced a challenging market debut, with shares priced at $46 each but falling to $40.20 by the close of the session. Investors were also monitoring the ongoing conflict between Israel and Hamas, as the latter launched an attack on Israeli civilians, leading to the deadliest offensive in the region in five decades. President Joe Biden condemned the attacks as terrorism and expressed unwavering support for Israel. Overall, the market sentiment appeared uncertain, with conflicting factors such as inflation, interest rates, and geopolitical tensions contributing to the mixed outlook for stocks.
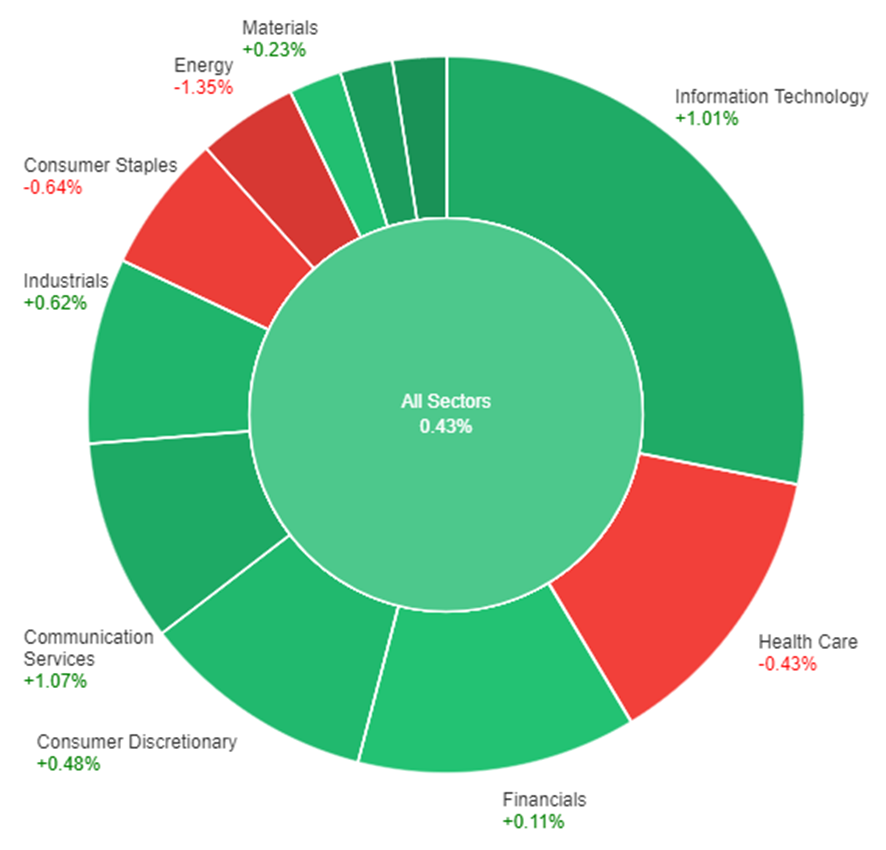
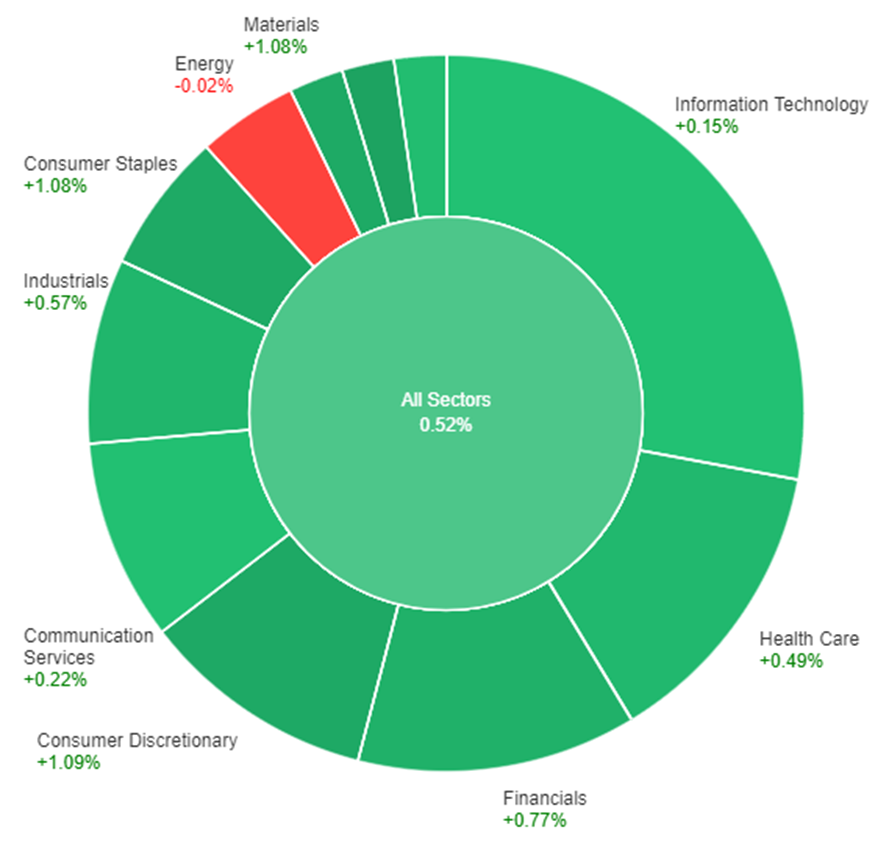
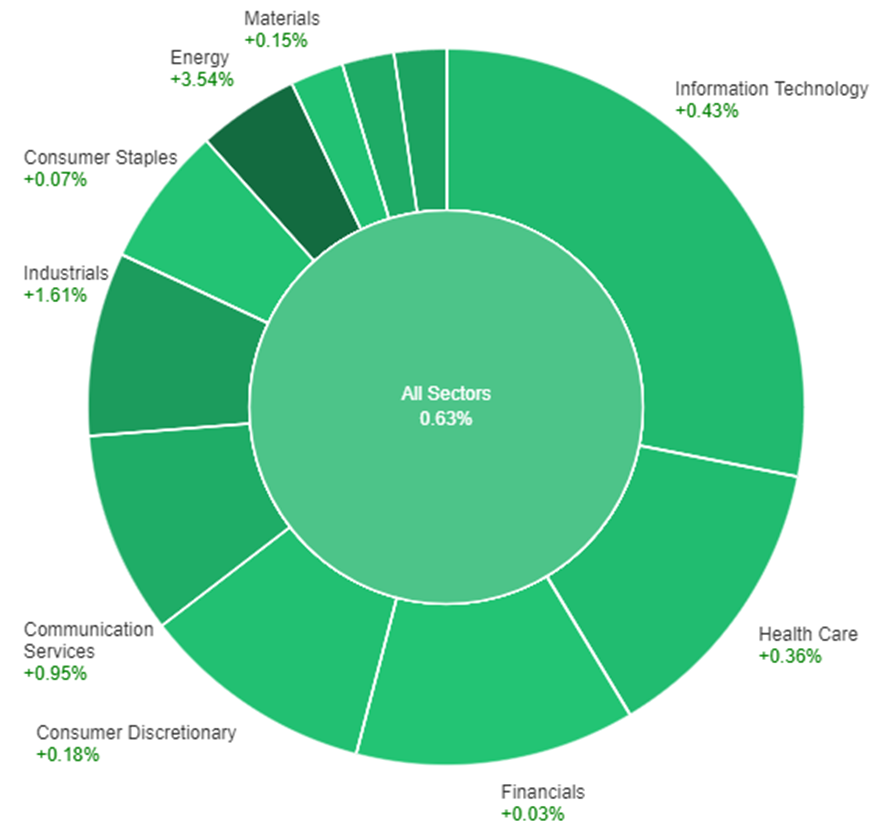
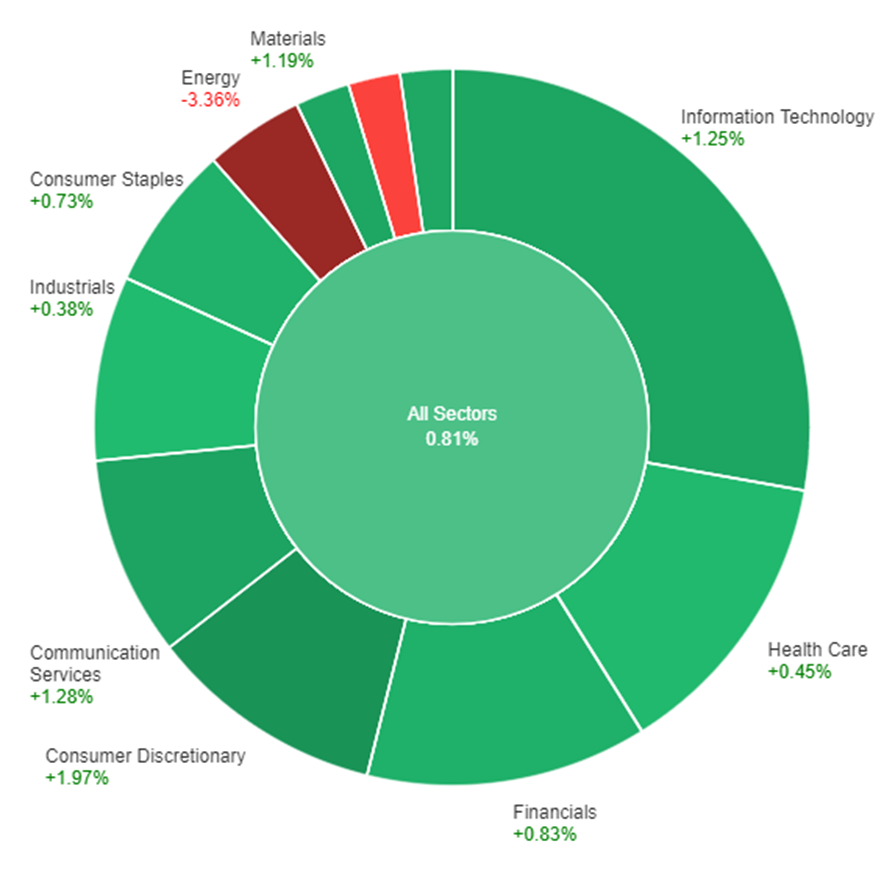
Data by Bloomberg

On Wednesday, the performance of various sectors in the market showed mixed results. Overall, all sectors combined saw a modest increase of 0.43%. Among the sectors, Real Estate performed exceptionally well with a gain of 2.01%, followed by Utilities at 1.63%, and Communication Services at 1.07%. Information Technology and Industrials also had positive gains at 1.01% and 0.62%, respectively. Meanwhile, Consumer Discretionary and Materials had smaller gains at 0.48% and 0.23%. On the other hand, Financials and Health Care experienced minimal gains of 0.11% and a decline of -0.43%, respectively. Consumer Staples and Energy were the worst-performing sectors, with losses of -0.64% and -1.35%, respectively.      

Currency Market Updates

In the recent currency market updates, the US Dollar remained largely flat despite unexpected positive data on US wholesale inflation and the release of the Federal Open Market Committee (FOMC) minutes. The Greenback’s weakness persisted as US Treasury yields continued to retreat, and a risk-on sentiment in the Wall Street stock market failed to provide support. Notably, the US Producer Price Index (PPI) accelerated in September, surprising analysts by rising from 2.0% to 2.2%, as compared to the expected 1.6%. However, this development did not raise significant concerns, with all eyes turning to the impending release of the Consumer Price Index (CPI), expected to decrease from 3.7% to 3.6% in September, promising heightened volatility in the currency market. Furthermore, the FOMC minutes revealed divergent perspectives among committee members, emphasizing a data-dependent approach and the necessity of a substantial rebound in inflation to reach a consensus on further interest rate hikes.

Following the FOMC minutes, the US Dollar Index (DXY) experienced a slight pullback but managed to finish flat at 105.75, rebounding from strong support at 105.50. The US Treasury yield for 10-year bonds dropped to 4.55%. Notably, EUR/USD maintained its recent gains and stayed close to a strong resistance level at 1.0630, demonstrating a bullish tone. However, with a week of continuous ascent, the pair appeared poised for a consolidation phase, pending the release of the US CPI figures. Meanwhile, GBP/USD achieved a second consecutive daily close above the 20-day Simple Moving Average, hovering around 1.2300 and indicating signs of potential fatigue in its recovery. Key economic data releases are expected in the UK on Thursday. In addition, Gold and Silver rallied, benefiting from lower yields and a weakened US Dollar, breaking above $1,860 and $22.00, respectively.

Picks of the Day Analysis
EUR/USD (4 Hours)

EUR/USD Rebounds from Monthly Lows Amidst Weakening US Dollar and Data-Dependent Fed Stance

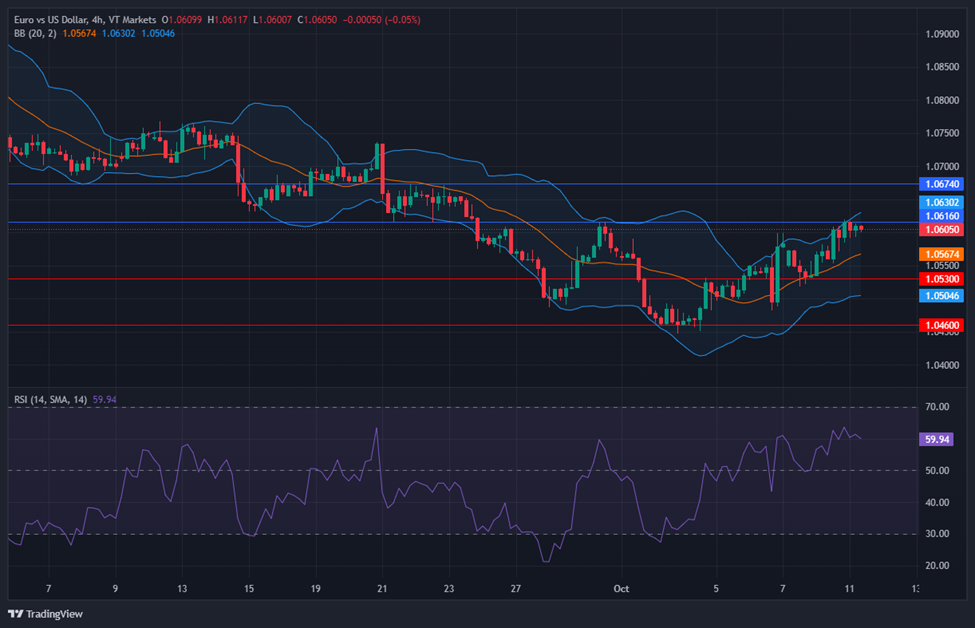
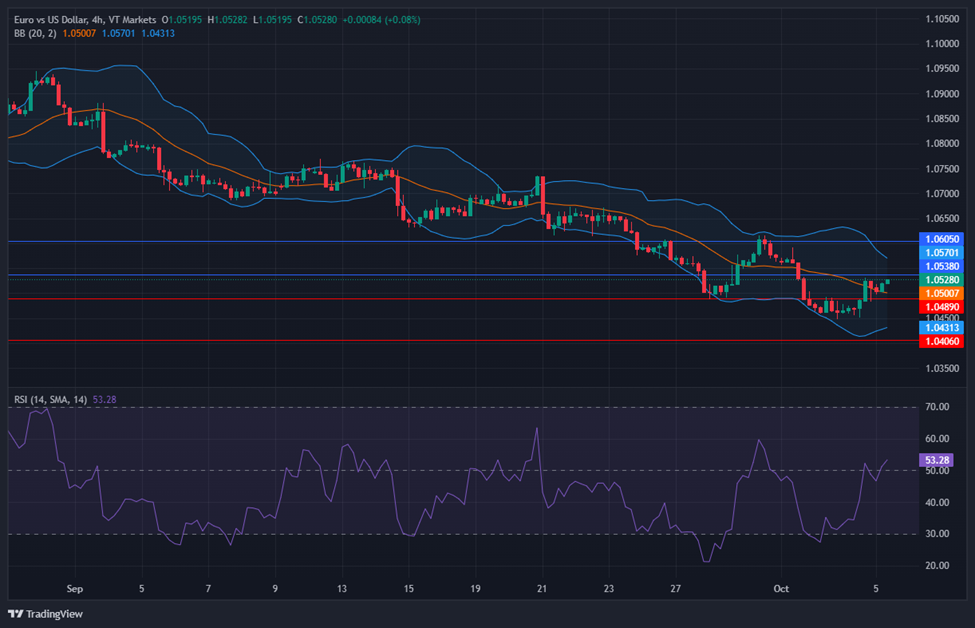
The EUR/USD pair tested levels above 1.0630 before pulling back, displaying modest gains as it recovers from monthly lows. Trading in a critical area, the Euro awaits more US inflation data, benefiting from the US Dollar’s weakness due to declining yields and positive market sentiment. The unexpected rise in the US Producer Price Index didn’t significantly impact the Dollar, while the latest FOMC minutes highlighted the Fed’s data-dependent approach to policy. A busy economic calendar on Thursday includes the release of ECB minutes and the US Consumer Price Index, with potential market impact depending on the CPI’s performance.

Chart EURUSD by TradingView

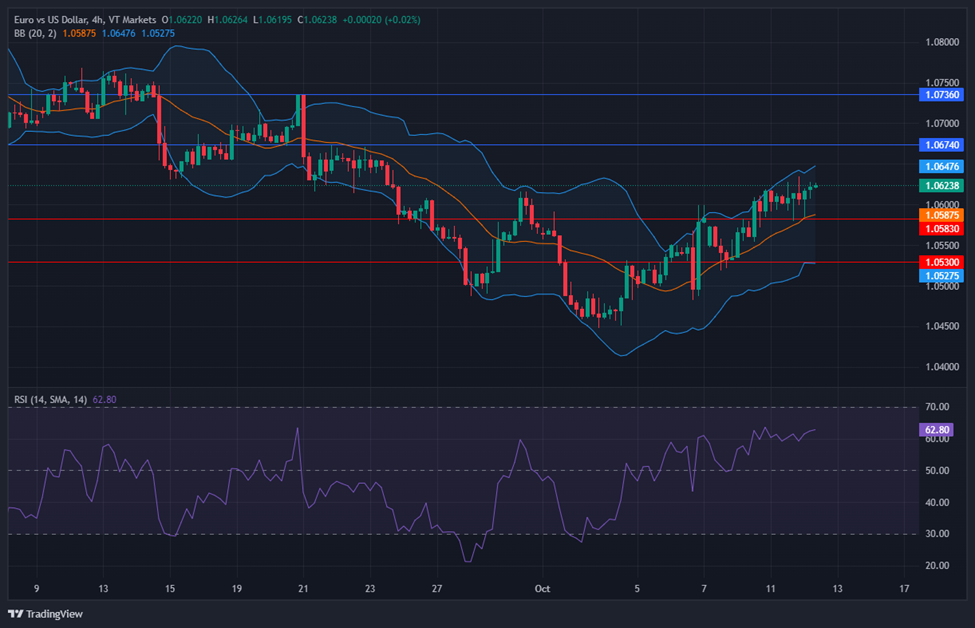
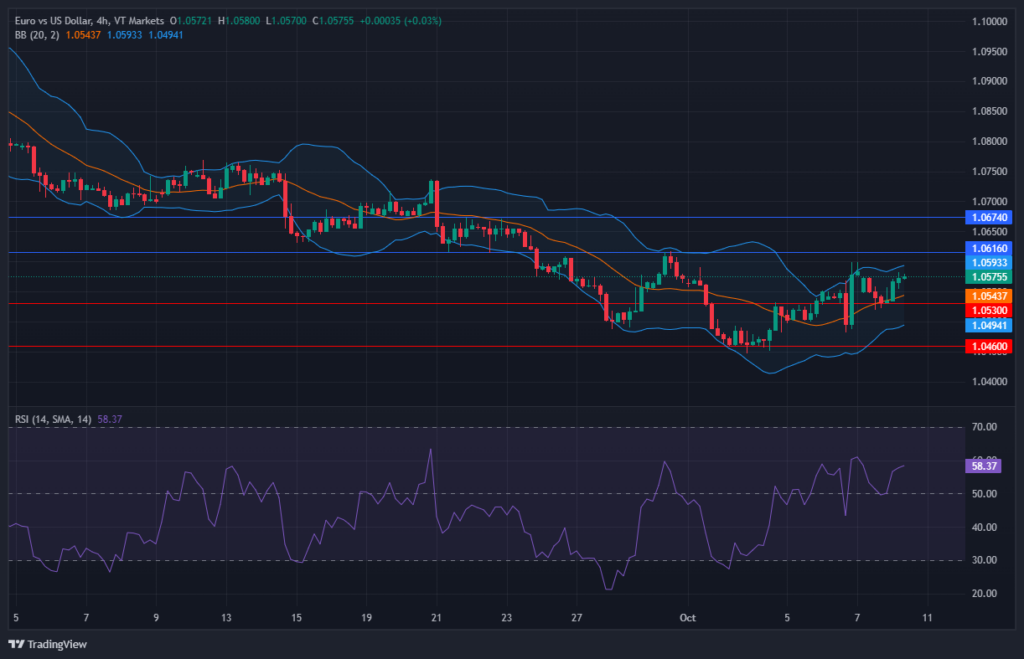
Based on technical analysis, the EUR/USD rose on Wednesday, pushing towards the upper band of the Bollinger Bands. Currently, the EUR/USD is trading below the upper band, while the bands are trending upwards, suggesting the potential for another upward move to retest the upper Bollinger Band. The Relative Strength Index (RSI) stands at 62, indicating that the EUR/USD is currently attempting to establish a bullish bias.

Resistance: 1.0674, 1.0736

Support: 1.0583, 1.0530

XAU/USD (4 Hours)

XAU/USD Surges to Two-Week High Amidst US Dollar Weakness and Bond Yield Concerns

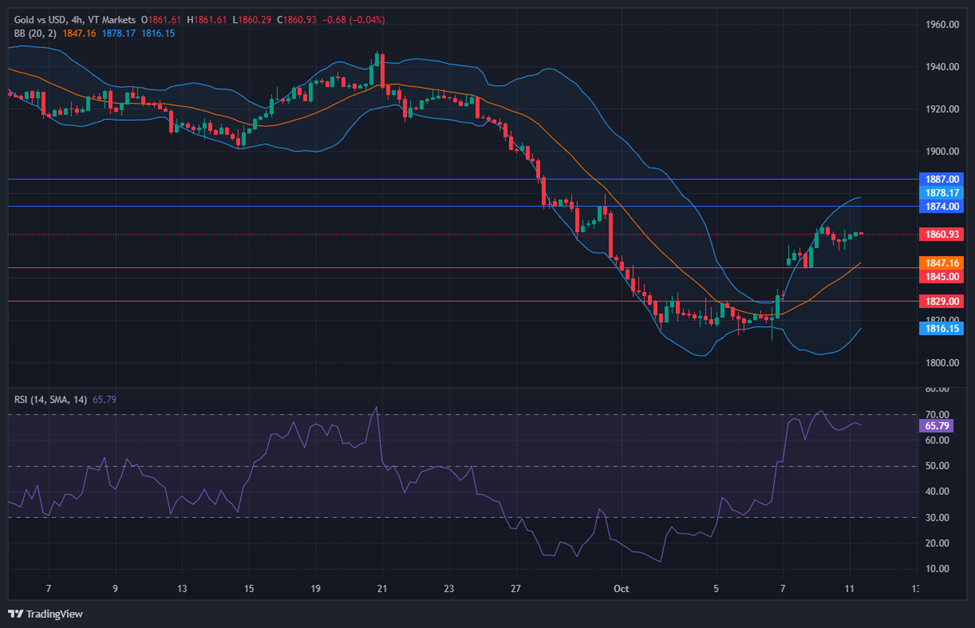
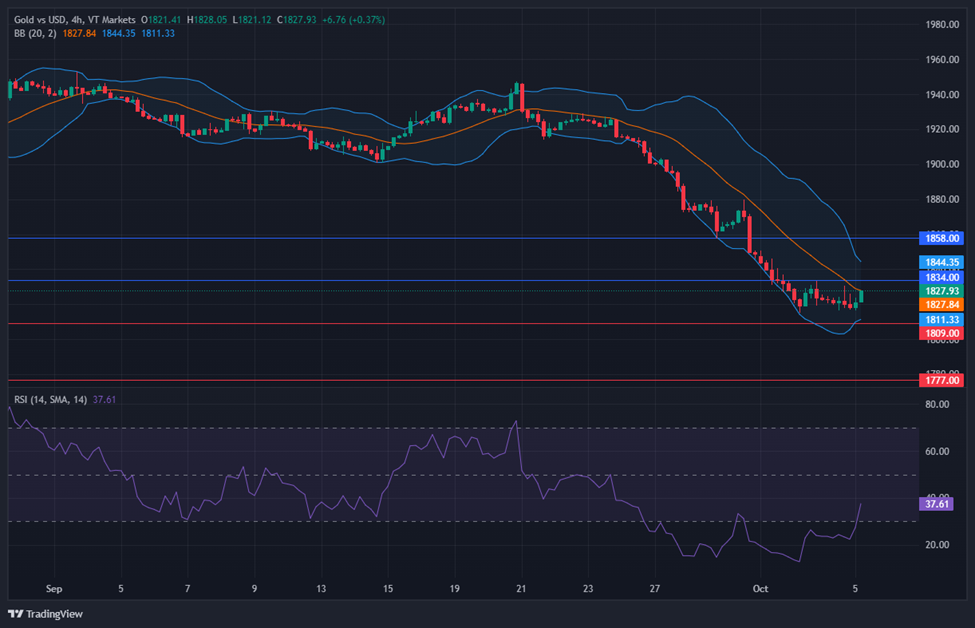
In a strong rally, the price of gold (XAU/USD) soared to a fresh two-week high at $1,877.19 per troy ounce on Wednesday. This impressive surge was attributed to the widespread weakness of the US Dollar, which was in turn linked to declining US Treasury bond yields. The dip in yields was partially driven by renewed demand for safety amid Middle East developments and dampened expectations of another Federal Reserve rate hike, as policymakers generally anticipate that robust yields will obviate the need for further tightening. Nevertheless, even as yields have eased lately, they remain near the multi-decade highs observed in September. Investor sentiment became cautious after the release of the US Producer Price Index (PPI) and in anticipation of the FOMC Meeting Minutes, as wholesale inflation in the country surged by 2.2% YoY in September, exceeding market expectations and August figures. The release of the Consumer Price Index (CPI) on Thursday is anticipated to show a 3.6% YoY increase, further influencing the gold market.

Chart XAUUSD by TradingView

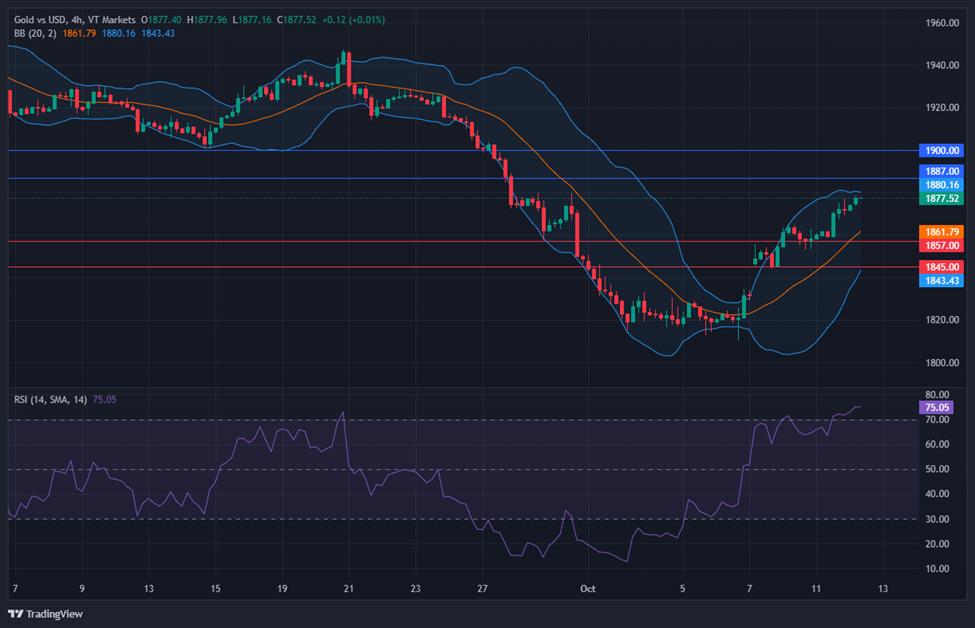
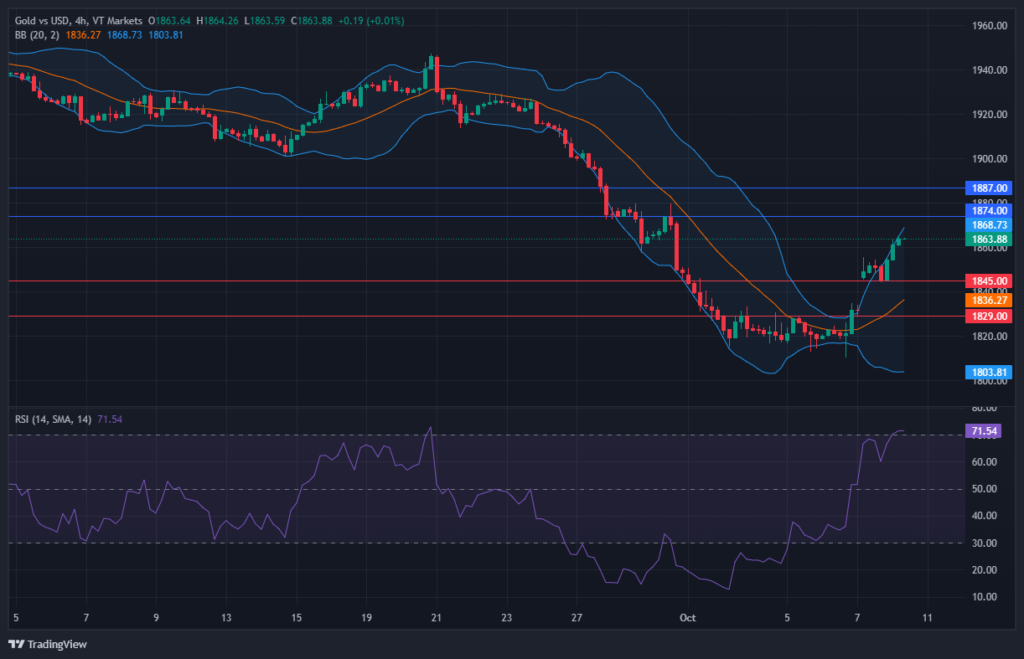
Based on technical analysis, XAU/USD is trending higher on Wednesday, creating an uptrend within the Bollinger Bands. Currently, the price of gold is trading slightly below the upper band and is beginning to consolidate between the middle and upper bands of the Bollinger Bands. The Relative Strength Index (RSI) currently registers at 75, indicating a bullish bias for the XAU/USD pair.

Resistance: $1,874, $1,887

Support: $1,845, $1,829

Economic Data
CurrencyDataTime (GMT + 8)Forecast
GBPGross Domestic Product14:000.2%
USDConsumer Price Index20:300.3%
USDCore Consumer Price Index20:300.3%
USDUnemployment Claims20:30211K

US Stocks Rise on Easing Bond Yields Amid Geopolitical Tensions

On Tuesday, U.S. stocks surged with the Dow Jones Industrial Average gaining 0.40%, the S&P 500 rising 0.52%, and the Nasdaq Composite adding 0.58%. This upward trend was fueled by a significant drop in Treasury yields, down 13 basis points to 4.65%, as investors sought safer assets due to the Israel-Hamas conflict. Positive market sentiment and anticipation of economic data releases also contributed to the market’s positive performance. The U.S. Dollar faced another decline, influenced by Wall Street’s performance, as key economic data and Federal Reserve minutes awaited scrutiny. In the currency markets, the Euro, British Pound, Australian Dollar, and New Zealand Dollar all saw gains against the U.S. Dollar, while the Japanese Yen experienced a setback.

Stock Market Updates

On Tuesday, U.S. stocks experienced a notable rise, with the Dow Jones Industrial Average surging by 0.40%, or 134.65 points, to close at 33,739.30, while the S&P 500 gained 0.52%, ending at 4,358.24. The Nasdaq Composite, which has a tech-heavy focus, added 0.58%, reaching 13,562.84. This increase in stock prices was partly attributed to a significant decrease in Treasury yields, with the benchmark 10-year Treasury yield falling by nearly 13 basis points to approximately 4.65%. This decline in yields occurred as investors sought safer assets amid the ongoing Israel-Hamas conflict. The bond market had been closed on Monday due to Columbus Day, and this shift in bond yields was the initial market reaction to the geopolitical situation. Additionally, falling oil prices after a previous rally provided further relief to investors. Despite initial concerns over rising interest rates and the conflict’s geopolitical risks, optimism grew in light of a strong September payrolls report and anticipation of upcoming third-quarter earnings releases.

One key contributor to the market’s positive performance was the shift in bond yields. This shift was perceived as a potential indication that the recent rapid increase in yields might be slowing down. Investors also began looking beyond the geopolitical concerns posed by the Israel-Hamas war and focused on economic factors, with anticipation building for inflation data releases scheduled for later in the week. Small-cap stocks, such as those in the Russell 2000 and the S&P Small Cap 600 index, demonstrated strong performance, gaining just over 1% each during the trading session. This marked the Russell’s fifth consecutive day of gains, a feat not seen since July. However, some investors remained cautious, viewing the rally as a reaction to previously priced-in negative sentiment and oversold conditions. Despite the market’s positive day, concerns about the ongoing inflationary pressures persisted, with some experts suggesting that the fourth quarter may be relatively flat despite expectations of positive earnings growth for the third quarter. Notable stock movements included PepsiCo’s 1.9% rise following better-than-expected third-quarter results and an upward revision of its earnings outlook, as well as positive gains for energy and industrial companies like Enphase Energy (5% increase) and Generac Holdings (3.8% gain).

Data by Bloomberg

On Tuesday, the stock market experienced overall gains, with all sectors combined rising by 0.52%. The biggest increases were seen in Utilities (+1.36%), Consumer Discretionary (+1.09%), Materials (+1.08%), and Consumer Staples (+1.08%). Other sectors also saw positive movements, but to a lesser extent, with Financials gaining 0.77%, Industrials increasing by 0.57%, Health Care by 0.49%, Real Estate by 0.30%, Communication Services by 0.22%, and Information Technology by 0.15%. Energy was the only sector that showed a decrease, with a decline of -0.02%.          

Currency Market Updates

The US Dollar faced another decline as positive market sentiment persisted and US yields remained distant from recent peaks, with the 10-year yield settling at 4.65% and the 2-year yield falling below 5%. This depreciation pushed the DXY index to its lowest daily close since September 18, dipping below 106.00. In the coming days, market watchers are eagerly awaiting key economic data and releases from the Federal Reserve. The US will unveil the September Producer Price Index (PPI), which could carry significant consequences if it surprises to the upside. Furthermore, the Federal Reserve will publish the minutes from the September FOMC meeting, offering insights into the central bank’s economic outlook. Meanwhile, the US Dollar’s decline was influenced by Wall Street’s positive performance, and despite a modest pullback in crude oil prices, commodity markets demonstrated mixed movements.

In the currency markets, the Euro made gains against the US Dollar, surpassing the 20-day Simple Moving Average for the first time since August, reaching a level around 1.0600. Key resistance for the EUR/USD pair is anticipated at 1.0630. The British Pound also benefited from short-term momentum, with GBP/USD rising above the 20-day SMA and hovering near 1.2300. The Japanese Yen experienced a setback, as rising equity prices and a modest rebound in yields pushed USD/JPY above 149.00, though it later retraced to 148.60. In contrast, the Australian Dollar saw gains for the fifth consecutive day, with AUD/USD maintaining a position above 0.6400 and aiming to extend its recovery, with significant resistance awaiting at 0.6500. The New Zealand Dollar followed a similar trajectory, holding above 0.6000 and posting its highest daily close in two months at 0.6040. Finally, USD/CAD remained relatively stable around the 1.3600 range as the Canadian Dollar consolidated recent gains, with a flat 20-day SMA at 1.3555 offering a potential point of interest.

Picks of the Day Analysis

EUR/USD (4 Hours)

EUR/USD Reaches Two-Week High at 1.0620 Amid US Dollar Correction and Geopolitical Concerns

In recent trading, the EUR/USD pair experienced a surge to 1.0620, marking its highest level in two weeks, before slightly retracing to the 1.0600 range. This upward movement is fueled by an improved market sentiment and the ongoing correction of the US Dollar, compounded by concerns over geopolitical events. The spotlight now turns to the upcoming US inflation data, particularly the Producer Price Index (PPI) and Consumer Price Index (CPI), as well as the release of the FOMC minutes, which will shed light on the Federal Reserve’s monetary policy expectations. Meanwhile, in Europe, the German Consumer Price Index remains stable, but the sluggish inflation and a pessimistic economic outlook suggest that the European Central Bank is likely done with interest rate hikes.

Chart EURUSD by TradingView

Based on technical analysis, the EUR/USD went up on Tuesday and managed to reach the upper band of the Bollinger Bands. Right now, the EUR/USD is trading below the upper band, which suggests a chance for a small downward move to reach the middle band of the Bollinger Bands. The Relative Strength Index (RSI) is at 59, indicating that the EUR/USD is currently trying to return to a neutral position with a bullish bias.

Resistance: 1.0616, 1.0674

Support: 1.0530, 1.0460

XAU/USD (4 Hours)

XAU/USD Shines as Investors Seek Safety Amid Fed’s Monetary Tightening Hints and Easing Dollar

Spot Gold has extended its weekly rally to $1,865.35 a troy ounce as investors continue to seek safety, while the US Dollar eases following comments from different Federal Reserve (Fed) officials, hinting at no more monetary tightening. Fed Vice Chair Philip Jefferson and Dallas Fed President Lorie Logan noted that higher Treasury yields help tighten financial conditions and could offset the need for additional hikes, while Atlanta Federal Reserve President Raphael Bostic believes the policy rate is sufficiently restrictive to reach the 2% inflation target, despite acknowledging there’s still a long way to go. Meanwhile, tensions in the Middle East have fueled demand for government bonds, resulting in easing yields, making Gold an attractive option for investors.

Chart XAUUSD by TradingView

Based on technical analysis, XAU/USD is consolidating on Tuesday creating a narrow range in the price movement. Currently, the price of gold is moving between the middle and upper bands of the Bollinger Bands. The Relative Strength Index (RSI) currently stands at 65, signaling a bullish bias for the XAU/USD pair.

Resistance: $1,874, $1,887

Support: $1,845, $1,829

Economic Data
CurrencyDataTime (GMT + 8)Forecast
USDCore Producer Price Index20:300.2%
USDProducer Price Index20:300.3%

History of gold: From ancient cultures to modern economies 

Gold, often referred to as the “King of Metals,” has consistently held a paramount position in the world’s economic landscape, transcending mere aesthetics and luxury. 

Gold
source ThoughtCo

A prime example underscoring gold’s critical role in the global economy lies in the significant gold reserves central banks maintain. These financial linchpins of nations uphold these reserves as a testament to gold’s unparalleled value, a tradition spanning centuries. 

During the height of the late 19th and early 20th-century gold standard era, major economies like the United States anchored their currencies to gold, solidifying the stability of the global financial system. 

For instance, the U.S., a major economic power at the time, boasted one of the largest gold reserves, officially holding approximately 20,663 metric tons of gold as of 1939, just before the outbreak of World War II. A considerable portion of this gold was securely housed at Fort Knox in Kentucky, a renowned depository. 

Gold, beyond its charm, stands as a financial cornerstone, bolstering stability, credibility, and global relations. Appreciating its cultural, economic, and historical worth requires understanding its extensive history. Gold’s journey across civilisations reveals its enduring allure and lasting impact on human history. 

Egyptian pharaoh
source Business Hub

Ancient Beginnings 

Gold, one of the most coveted metals in history, has captivated humanity for millennia. Its appeal can be traced back to ancient civilisations such as the Egyptians, Greeks, and Romans, holding immense cultural, economic, and aesthetic value. 

In ancient Egypt, gold was revered as the “flesh of the gods,” symbolising divine power and immortality. Egyptians widely used gold for various purposes, including currency, jewellery, and religious artifacts. Pharaohs were often buried with vast amounts of gold, a testament to its  

The Greeks, too, held gold in high esteem, associating it with gods and considering it indestructible due to its non-reactive nature. This perception elevated gold to a divine status, reinforcing its prominence in society. 

Gold in Ancient China and India 

In ancient China, gold held immense cultural and economic value. It was used for ornamental purposes, religious offerings, and even as a form of currency during various dynasties. The Chinese associated gold with prosperity and believed it brought good luck. 

India has a deep-rooted cultural affinity for gold, considering it auspicious and a symbol of purity and prosperity. Gold is an integral part of weddings, festivals, and religious ceremonies, often passed down through generations as heirlooms. 

The Spanish Conquest and the New World 

During the Spanish conquests in the 15th and 16th centuries, significant gold reserves were uncovered in regions now known as Mexico, Peru, and parts of Central and South America. 

Legends like El Dorado drove Spanish explorations, leading to the discovery of abundant gold, especially in present-day Colombia, Venezuela, and the famed silver mines of Potosí in Bolivia. 

The influx of gold from the Americas significantly altered global gold supply, affecting trade dynamics and gold’s value worldwide. The wealth from the Americas financed wars, fuelled industries, and facilitated the rise of powerful merchant families, causing a price revolution and laying the foundation for modern banking systems. 

History of Global Gold Production
source Visual Capitalist

Gold Rushes and Exploration 

The 19th century witnessed the phenomenon of gold rushes, forever altering the course of history. The California Gold Rush (1848-1855) and the Australian Gold Rush (1851) were pivotal events that ignited economic booms, sparking population growth and advancements in mining technologies. 

These gold rushes acted as magnets, attracting people from around the globe in search of wealth. The influx of people led to the rapid development of cities, infrastructure, and entire economies in these regions, leaving an enduring mark on their landscapes. 

In response to the surging demand for gold, miners and prospectors developed innovative mining technologies and techniques. These advancements not only revolutionised the mining sector but also had a broader impact, driving progress in industrial and engineering domains. 

The Gold Standard Era 

The late 19th and early 20th centuries witnessed the widespread adoption of the gold standard, anchoring the value of a nation’s currency to a specific quantity of gold. This system instilled confidence in the monetary system and promoted financial stability. 

Under the gold standard, each unit of currency was backed by a fixed amount of gold held in reserve, providing a sense of security to holders of that currency. This ensured that the paper currency had tangible value tied to a precious metal. 

However, the gold standard’s rigidity became apparent, especially during economic downturns. Governments found it challenging to implement flexible monetary policies to combat economic crises. Consequently, nations began transitioning away from the gold standard, opting for more adaptable monetary systems. 

Fort Knox Gold Treasury
source Daily Mail

Gold in the Modern Era 

The 20th century, marked by the two World Wars, saw a surge in gold demand. Governments and individuals sought gold as a safe-haven asset during times of uncertainty. Post-World War II, gold played a crucial role in shaping the global monetary system, evolving into its significance in the 21st century as a safe-haven asset amid economic volatility and geopolitical tensions. 

In recent years, gold has maintained its status as a safe-haven asset, particularly during economic downturns and geopolitical instability. Its value surged after the 2008 financial crisis, highlighting its resilience and enduring relevance in the modern financial landscape. 

Gold’s Influence on the Modern Global Economy 

Gold, often revered as a timeless symbol of wealth and prosperity, continues to wield immense influence in the contemporary global economy. Explore how this precious metal remains an enduring force, shaping the dynamics of the modern economic landscape. 

Distribution of gold demand worldwide by sector in 2022
source Statista

The Significance of Gold Reserves for Central Banks 

Central banks play a pivotal role in maintaining a stable modern global economy. Gold reserves held by central banks are a fundamental component, providing a solid foundation for economic stability and bolstering a nation’s creditworthiness. These reserves act as a safeguard, particularly during economic downturns and emergencies, instilling confidence in the financial system. 

Key players in the global financial landscape, including the United States, Germany, and the International Monetary Fund (IMF), uphold substantial gold reserves. For instance, as of 2023, the United States holds the largest gold reserves globally, amounting to approximately 8,133 metric tons. Germany comes in second with about 3,355 metric tons, followed by the IMF with approximately 2,814 metric tons. These extensive holdings underscore gold’s enduring importance in the modern economic framework, showcasing its resilience and relevance. 

Gold’s Role as a Safeguard against Economic Uncertainties 

In the contemporary world, gold is universally acknowledged as a reliable hedge against economic uncertainty. Its historical status as a safe-haven asset is reinforced during times of economic turbulence, be it inflation, deflation, geopolitical instabilities, or financial crises. Investors turn to gold, seeking a secure investment that can effectively preserve their wealth in volatile market conditions. 

Notably, the demand for gold escalates during economic crises, as it is perceived as a safe bet amidst market volatilities. For example, during the 2008 financial crisis, gold prices surged from around $800 per ounce in 2008 to over $1,900 per ounce in 2011, demonstrating its value as a safe-haven asset during tumultuous times. 

Gold’s Multifaceted Role in the Modern Era 

Gold’s influence extends far beyond its traditional role. In the contemporary global economy, gold plays a multifaceted and indispensable role. Gold is not only a store of value and a safe-haven asset; it’s widely used in different sectors, making it even more important. 

In the realm of jewellery, gold is not just a symbol of opulence but also a representation of tradition and cultural significance. In 2022, the global demand for gold in the jewellery sector amounted to approximately 2,086 metric tons. 

Its exceptional conductivity properties make it a vital component in the electronics industry, contributing to the production of various technological devices. Furthermore, its unique attributes make gold indispensable in specialised applications like aerospace technology and medical devices. 

Golden Jewellery
source Arabian Business

Factors Shaping Gold Prices 

Numerous factors intricately affect gold prices in the global market, including supply-demand dynamics, economic indicators, geopolitical events, currency strength, central bank policies, market speculation, and industrial demand. Understanding these influences is crucial for comprehending gold market dynamics. 

  • Supply and Demand: Gold prices respond to changes in gold production, recycling, central bank transactions, and demand from sectors like jewellery and industry. 
  • Economic Factors: Gold can serve as a hedge against inflation, with higher inflation often boosting demand. Interest rates also impact gold prices, with lower rates making gold more attractive. 
  • Geopolitical Events: Geopolitical tensions, conflicts, and trade disputes can drive investors to seek the safety of gold, elevating its prices. 
  • Currency and US Dollar: Gold often moves inversely to the US dollar, becoming more appealing when the dollar weakens. It can also serve as a safe-haven currency. 
  • Central Bank Policies: Monetary decisions and gold transactions by central banks can directly influence gold prices and market sentiment. 
  • Market Sentiment and Speculation: Investor sentiment and speculative trading activities can result in short-term price fluctuations. 
  • Industrial Demand: Gold’s use in electronics and industry impacts its price, with technological trends influencing demand. 

In conclusion, comprehending gold’s historical journey unveils not only its economic implications but also its profound impact on our lives and businesses. Gold symbolises human creativity, resilience, and adaptability. It acts as a bridge across generations, a timeless emblem that continues to influence our world, connecting our past, present, and future. As we navigate the complexities of economics and trade, the enduring value of gold in the tapestry of humanity remains a constant and compelling reminder.

Stock Market Recovers Amid Geopolitical Tensions as Investors Monitor Israel-Hamas Conflict

On Monday, the stock market rebounded, with the Dow Jones Industrial Average closing 0.59% higher and the S&P 500 and Nasdaq Composite also showing gains despite earlier uncertainties tied to the Israel-Hamas conflict. The conflict, along with concerns about inflation and interest rates, led to initial market declines and a surge in crude oil prices. Major oil and gas companies, as well as defense companies, saw significant gains. While investors reacted with some knee-jerk moves, small-cap stocks in the Russell 2000 index increased, boosting confidence in the broader economy. In the currency market, the US dollar’s performance was mixed due to risk-off sentiment and changes in Federal Reserve rate expectations, with the Japanese yen emerging as a strong performer. Attention now turns to upcoming economic data releases that will shape market expectations.

Stock Market Updates

On Monday, the stock market rebounded despite earlier uncertainties linked to the Israel-Hamas conflict. The Dow Jones Industrial Average showed a notable recovery, closing 0.59% higher, gaining 197.07 points, and concluding at 33,604.65. The S&P 500 followed suit, with a 0.63% increase, ending at 4,335.66, and the tech-focused Nasdaq Composite climbed 0.39% to reach 13,484.24. Earlier in the day, all major indexes experienced declines, with the Dow shedding 153.89 points, the S&P 500 losing 0.6%, and the Nasdaq pulling back as much as 1.15% before rebounding. The Israeli-Palestinian conflict, which escalated over the weekend with Hamas launching an invasion and Israel responding, initially put pressure on the stock market. This geopolitical tension may impact the energy market, potentially causing a brief surge in crude oil prices, though the overall impact is expected to be limited. The conflict, combined with concerns about persistent inflation and higher interest rates, could lead to increased market volatility. On Monday, WTI crude oil futures increased by 4.3% to $86.38, while international Brent futures rose 4.2% to $88.15, marking their best performances since April 3. Gains were observed across all sectors, with energy and industrials leading, closing higher by 3.5% and 1.6%, respectively. Major oil and gas companies, as well as defense companies, also saw significant gains amid the conflict.

Lockheed Martin and Northrop Grumman, in particular, registered increases of 8.9% and 11.4%, respectively. Investors’ reactions to the conflict were initially marked by a rapid response, with the market closely monitoring the situation for more clarity on potential impacts. Analysts are keeping an eye on Iran, a major OPEC producer, to gauge crude oil movements as the conflict unfolds. Despite the initial uncertainty, some investors expressed confidence in the market’s ability to assess the impact of the attack over the weekend, and small-cap stocks in the Russell 2000 index increased by 0.6%, boosting confidence in the broader economy. With the bond market closed for Columbus Day, Wall Street awaits an update on interest rates until Tuesday. Additionally, investors are looking ahead to upcoming earnings reports, including those from companies like PepsiCo, Walgreens Boots Alliance, JPMorgan, and BlackRock, to gain further insights into the health of the broader economy.

Data by Bloomberg

On Monday, across all sectors, the market experienced a positive trend with a gain of 0.63%. Notable sector performances included significant gains in the Energy sector, which increased by 3.54%, and positive growth in the Industrials, Real Estate, and Utilities sectors, rising by 1.61%, 1.30%, and 1.01%, respectively. The Communication Services and Information Technology sectors also saw modest gains of 0.95% and 0.43%, while Health Care, Consumer Discretionary, and Materials sectors experienced smaller increases of 0.36%, 0.18%, and 0.15%, respectively. The Consumer Staples and Financials sectors had more modest gains of 0.07% and 0.03%. 

Currency Market Updates

In recent currency market developments, the US dollar exhibited mixed performance. Initially, the dollar index saw a marginal increase, largely attributed to its role as a safe-haven currency during the ongoing conflict in Israel. However, as risk-off sentiment prevailed and Federal Reserve rate expectations took a significant dip, the dollar’s upward momentum waned. This shift was also influenced by a surge in energy prices, which benefited energy-exporting nations. The Japanese yen emerged as the strongest performer among G7 currencies, gaining against the dollar, euro, and sterling due to its status as a funding currency, supported by the Bank of Japan’s accommodative monetary policy. The USD/JPY pair saw a decline as Fed fund futures began pricing in a 17 basis-point reduction in the Federal Reserve rate by December 2024. This was driven by derisking flows and a perception that recent increases in Treasury yields reduced the necessity for further Fed tightening.

As investors closely monitored these developments, attention turned to upcoming economic data releases, particularly the US Producer Price Index (PPI) and Consumer Price Index (CPI) scheduled for Wednesday and Friday. These reports were deemed crucial for shaping market expectations regarding the Federal Reserve’s future monetary policy decisions and the support for the US dollar’s yield. The euro depreciated against the US dollar, with a potential bearish outlook if the sharp increases in crude and natural gas prices, which were driven by the escalating conflict in Israel, continued. Sterling managed to recover from its lows, influenced by risk-off sentiment and a drop in Fed rate pricing. Meanwhile, the Australian dollar rebounded after an initial risk-off slide, and the Canadian dollar also saw gains as oil prices rebounded, coupled with diminishing expectations of Federal Reserve rate hikes compared to the Reserve Bank of Australia and the Bank of Canada in the coming year. Notably, the Israeli shekel faced a significant devaluation of 2.65% despite the Bank of Israel’s announcement of selling up to $30 billion of foreign currency to stabilize the currency amid the ongoing war.

Picks of the Day Analysis
EUR/USD (4 Hours)

EUR/USD Holds Steady Below 1.0600 as Geopolitical Concerns Weigh on Euro

In the American session, the EUR/USD pair saw a modest rise but remained below Friday’s close, with the US Dollar’s weakness falling short of pushing it above 1.0600. Notably, the Euro underperformed compared to other G10 currencies due to new geopolitical concerns. The Euro faced additional pressure as the 10-year German bond yield dropped significantly. German Industrial Production data for August disappointed, and the Eurozone Sentix Investor Confidence also declined in October. Tuesday sees no major economic reports in either the Eurozone or the US, with attention turning towards the US Consumer Price Index later in the week.

Chart EURUSD by TradingView

Based on technical analysis, the EUR/USD went up on Monday and managed to move above the middle band of the Bollinger Bands. Right now, the EUR/USD is trading below the upper band, which suggests a chance for another upward to push the upper band of the Bollinger Bands. The Relative Strength Index (RSI) is at 58, indicating that the EUR/USD is currently in a neutral stance with a try to have a bullish bias.

Resistance: 1.0616, 1.0674

Support: 1.0530, 1.0460

XAU/USD (4 Hours)

XAU/USD Surges as Middle East Tensions Spark Safe-Haven Demand Amidst US Market Closure Gold prices opened the week with a significant gap higher, reaching $1,855.28 during Asian trading hours, driven by escalating tensions in the Middle East, with Israeli Prime Minister Benjamin Netanyahu declaring the country at war following a major attack by the Palestinian Hamas group. This unexpected situation led to increased risk aversion and a surge in demand for safe-haven assets, with Gold benefiting the most. While the US Dollar initially strengthened, it receded after London’s close, and the reaction of American markets to the weekend news remains uncertain as they are closed for Columbus Day. The week ahead will bring important US economic data, including the release of the FOMC meeting Minutes and the September Consumer Price Index, which is expected to offer key insights into inflation trends.

Chart XAUUSD by TradingView

Based on technical analysis, XAU/USD moves high on Monday. It creates a push for the upper band of the Bollinger Bands. Currently, the price of gold is trying to push the upper band even higher. The Relative Strength Index (RSI) currently stands at 71, signaling a bullish bias for the XAU/USD pair.

Resistance: $1,874, $1,887

Support: $1,845, $1,829

Chart Indicators: Data-Driven Forex Trading 

In the not-so-distant past, Forex trading was primarily driven by intuition, market experience, and fundamental analysis. However, the introduction of Forex chart indicators revolutionised the landscape, providing traders with a powerful analytical tool that transformed decision-making. 

A trader using chart indicators
Source: Shutterstock

Forex chart indicators brought a scientific approach to trading, enabling traders to objectively analyse historical price data and predict potential future price movements. Traders could now identify patterns, trends, and market behaviour, allowing for more accurate entry and exit points. This shift from gut-feeling trading to data-driven analysis was similar to shedding light on a previously dimly lit path. 

By empowering traders with a plethora of indicators from Moving Averages to Bollinger Bands, RSI, MACD, and more – charting tools equipped them with a deeper understanding of market dynamics. These indicators acted as beacons, illuminating market trends, volatility, and momentum. Traders could fine-tune their strategies, manage risk, and optimise their trades for greater profitability. 

Furthermore, the advent of technology, especially online trading platforms democratised access to these indicators. What was once exclusive to institutional traders and professionals became readily available to individual traders. Now, traders, whether seasoned or beginners, could harness the power of chart indicators to level the playing field. 

Today, Forex chart indicators are an integral part of every trader’s toolkit. They have shifted trading from speculative guessing to informed decision-making, contributing to the growth and accessibility of the Forex market. This evolution underscores the profound impact of technology and analytics on the financial world, ushering in a new era of possibilities for traders around the globe. 

Chart indicators
Source: Investgrams

What are Chart Indicators? 

Chart indicators are fundamental tools used in financial analysis, specifically in the domain of Forex trading. These tools are grounded in mathematical calculations and are applied to a variety of market data, such as price and volume, to provide insights into market trends and potential future price movements. 

The primary objective of chart indicators is to assist traders in understanding the complex dynamics of the market and to aid in the development of effective trading strategies. Through careful interpretation of these indicators, traders can make informed predictions about the likely changes in price, enabling them to execute timely decisions to either maximise gains or minimise losses. 

At the core of chart indicators lies mathematical algorithms. These algorithms process historical and real-time market data to generate specific values, often displayed on charts, that traders can analyse. The calculations involved in these indicators may consider various parameters, including price, volume, or a combination of both, depending on the type of indicator being used. 

A trader using chart indicators
Source: Shutterstock

How Do Chart Indicators Help Traders? 

Chart indicators function as a lens that magnifies and simplifies the intricate market dynamics. They help traders identify patterns, trends, and potential turning points, giving a clear view of the market’s behaviour. For example, a moving average smoothes out price data, revealing the underlying trend more clearly. 

Understanding market dynamics is pivotal in devising successful trading strategies. Chart indicators equip traders with crucial information, allowing them to strategise their trades. For instance, an RSI reading above 70 might indicate an overbought market, prompting traders to consider selling, while a reading below 30 could suggest an oversold market, potentially signalling a buy opportunity. 

The ultimate goal of employing chart indicators is to foresee how prices might change in the future. By interpreting these indicators and recognising patterns or signals, traders gain insights into potential price shifts. This foresight enables them to make timely decisions – be it entering or exiting a trade – aiming to maximise profits during price upswings and mitigate losses during downturns. 

Chart indicators
Source: Sofien Kaabar, CFA – Medium

Types of Popular Chart Indicators 

Before delving deeper into the world of Forex chart indicators, it’s essential to understand the diverse range of tools available to traders. In this section, we’ll explore an array of popular chart indicators, each with its unique characteristics and insights into market behaviour. These indicators serve as essential instruments for traders, providing valuable signals and helping navigate the complex Forex landscape with confidence. 

Moving Averages 

Moving averages are foundational in technical analysis, smoothing price data for a clear trend representation over a specified time frame. Types include Simple Moving Averages (SMA), Exponential Moving Averages (EMA), and Weighted Moving Averages. 

SMAs give equal weight to each price point, suitable for trend identification. EMAs prioritise recent prices, making them responsive to market shifts. Weighted Moving Averages emphasise specific data points, allowing flexible customisation. Traders experiment with these types to match their strategy and market conditions. 

Relative Strength Index (RSI) 

RSI, a key momentum indicator, gauges both the speed and change of price movements within a given period. By doing so, it provides traders with valuable insights into overbought and oversold conditions, aiding in the assessment of potential trend reversals or continuations. 

RSI values above 70 usually suggest overbought conditions, implying a possible price correction or trend reversal, while values below 30 typically indicate oversold conditions, potentially signalling a buying opportunity. This indicator serves as a critical tool in a trader’s toolkit for understanding market sentiment and making informed decisions. 

Bollinger Bands
Source: Investopedia

Bollinger Bands 

Bollinger Bands, a widely-used volatility indicator, consist of a middle band, typically a 20-day simple moving average (SMA), flanked by an upper and lower band. The upper band is calculated by adding two times the 20-day SMA’s standard deviation to the SMA, while the lower band is obtained by subtracting two times the standard deviation from the SMA. 

These bands dynamically adjust to market volatility, widening during volatile periods and narrowing during calmer phases. When prices approach the upper band, it may signify overbought conditions, potentially indicating a sell opportunity, while nearing the lower band may suggest oversold conditions, hinting at a buy opportunity. 

MACD (Moving Average Convergence Divergence) 

MACD is a versatile indicator illustrating the relationship between two moving averages, highlighting changes in market momentum. It’s calculated by subtracting the 26-day exponential moving average (EMA) from the 12-day EMA, resulting in the MACD line. A 9-day EMA of the MACD line, called the signal line, identifies buy or sell signals. 

When the MACD line crosses above the signal line, it generates a bullish signal, suggesting a potential uptrend, and vice versa for a bearish signal. The histogram, representing the difference between the MACD line and the signal line, visualises trend strength and direction. Traders use MACD to identify entry and exit points, aiding in informed trading decisions. 

Stochastic Oscillator 

The Stochastic Oscillator, a momentum indicator, compares a security’s closing price to its price range over a specified time period, typically 14 periods. It generates values between 0 and 100, indicating the closing price’s position within the price range. 

A value near 0 indicates that the closing price is at the low end of the range, signifying potential oversold conditions, while a value near 100 suggests the closing price is at the high end of the range, hinting at potential overbought conditions. Traders use this information to identify possible trend reversals or continuation patterns, aiding in strategic decision-making. 

Fibonacci Retracement
Source: Investopedia

Fibonacci Retracement 

Fibonacci Retracement, a widely utilised tool, employs horizontal lines to identify crucial areas of potential support or resistance based on key Fibonacci levels. These levels – notably 23.6%, 38.2%, 50%, 61.8%, and 78.6% – are derived from the Fibonacci sequence. 

Traders utilise these retracement levels to gauge possible points of price reversal or continuation, assisting in making informed trading decisions. 

Ichimoku Cloud 

The Ichimoku Cloud, a comprehensive technical indicator, offers a holistic view of support/resistance levels, trends, and momentum. It consists of several components, including the cloud (or “Kumo”), Tenkan-sen, Kijun-sen, Senkou Span A, and Senkou Span B. 

The cloud represents an area of potential support or resistance, providing traders with valuable insights into market trends and aiding in the identification of potential trade opportunities based on the relationship between the components and the price. 

Keltner Channel 

The Keltner Channel, a volatility-based indicator, is a powerful tool used to assess market volatility and potential trend reversals. It consists of an upper band, calculated by adding the average true range (ATR) of an asset to a simple moving average (SMA), and a lower band, obtained by subtracting the ATR from the SMA. 

When prices approach the upper band, it indicates increased volatility and a potential trend reversal, offering traders valuable information for their trading strategies. 

Parabolic SAR (Stop and Reverse) 

The Parabolic SAR (Stop and Reverse) is a versatile technical indicator designed to identify potential entry and exit points in a market. It places dots either above or below the price chart, indicating potential trend changes. 

When the dots are above the price, it suggests a downward trend, signaling a possible sell opportunity. Conversely, when the dots are below the price, it indicates an upward trend, suggesting a potential buy opportunity. Traders use these signals to make informed decisions and effectively manage their trades. 

Williams %R
Source: Investopedia

Williams %R 

Williams %R, an important oscillator, aids traders in identifying overbought or oversold market conditions within a specific timeframe, typically 14 periods. The indicator provides a numerical value between -100 and 0, with values approaching -100 indicating oversold conditions and values nearing 0 indicating overbought conditions. 

Traders utilise these readings to make timely decisions, potentially entering a trade when the market is oversold and exiting or shorting when it’s overbought. 

Average Directional Index (ADX) 

The Average Directional Index (ADX) is a pivotal indicator for traders, measuring the strength of a market trend. It provides a numerical value typically between 0 and 100, with higher values indicating a stronger trend. 

When the ADX value is low, it suggests a weak or absent trend, aiding traders in identifying ranging markets. Conversely, a high ADX value signifies a robust trend, assisting traders in assessing the potential for trend-based trading strategies. 

A trader using chart indicators
Source: Shutterstock

How to Use Chart Indicators Effectively 

To optimise chart indicators for effective trading: 

  • Combine indicators: Utilise multiple indicators, like RSI, MACD, and moving averages, to form a comprehensive analysis. This offers a well-rounded view of the market dynamics. 
  • Spot trends and points: Chart indicators help identify trends (up, down, or sideways), potential trend reversals, and precise entry or exit points for trades. 
  • Customise parameters: Adjust indicator parameters, such as period lengths or sensitivity, to suit specific trading strategies and the asset being traded. Tailoring these parameters enhances indicator effectiveness. 
  • Practice and adapt: Continuously practice using indicators and adapt them to changing market conditions. This hands-on experience fine-tunes your understanding and application of these tools, leading to improved decision-making. 

In conclusion, understanding popular chart indicators is a crucial step for non-professional traders aiming to enhance their Forex trading strategies. By leveraging these indicators effectively, traders can make informed decisions and navigate the Forex market with increased confidence. Experiment with different indicators and find the ones that align with your trading style and goals, ultimately enhancing your trading success. Best of luck with your trades! 

Summary:

  • Chart indicators transformed Forex trading from intuition-based to data-driven analysis. 
  • Chart indicators use mathematical algorithms on market data to generate specific values for analysis. 
  • Traders can identify patterns, trends, and market behaviour for accurate entry and exit points. 
  • Popular chart indicators: Moving Averages, RSI, Bollinger Bands, MACD, Stochastic Oscillator, Fibonacci Retracement, Ichimoku Cloud, Keltner Channel, Parabolic SAR, Williams %R, ADX. 
  • Effective use of chart indicators entails combining, customising, and adapting for optimal analysis and informed decision-making. 

Week Ahead: All Eyes on US PPI and US CPI

Several significant market developments are expected to impact the financial markets this week. In particular, we await the release of the US Consumer Price Index (CPI) and Producer Price Index (PPI). Given the potential impact of these announcements, we strongly recommend traders to exercise caution in their trading preparations, taking into account the possibility of increased market volatility.

Here are some essential economic highlights to monitor throughout the week:

US Producer Price Index (11 October 2023)

Producer prices in the US increased by 0.7% in August 2023, the highest level since June 2022. 

New PPI data will be released on 11 October, with analysts expecting a 0.3% increase.

UK Gross Domestic Product (12 October 2023)

The British economy contracted by 0.5% month-over-month in July 2023, marking the largest decline of the year. This also represented a reversal from the 0.5% growth observed in June. 

Data for August is scheduled for release on 12 October, with analysts anticipating a 0.2% increase.

US Consumer Price Index (12 October 2023)

Consumer prices in the US increased by 0.6% month-over-month in August 2023, following a 0.2% rise in July. 

Analysts expect a 0.3% increase in the figures for September, which are set to be released on 12 October.

FOMC Meeting Minutes (12 October 2023)

During its September 2023 meeting, the Federal Open Market Committee (FOMC) maintained the target range for its funds rate at a 22-year high of 5.25%–5.5%, following a 25 bps hike in July. 

The central bank signalled the possibility of another rate hike later this year, following potential meetings in November or December 2023.

University of Michigan Consumer Sentiment Index (13 October 2023)

The University of Michigan Consumer Sentiment Index for the US increased to 68.1 in September 2023.

Analysts expect the index to drop to 67.4 in the next set of published data.

服务器升级维护通知 – 2023年10月06日

尊敬的用户:

您好! VT Markets 致力于为客户提供更快速且稳定的交易环境,我们将于周末进行服务器 (MT4/MT5) 升级维护。

维护时段:
2023 年 10 月 07 日 (星期六) 07:00 至 10:00

上述时段采用 GMT+8

维护期间请您务必留意下列事项:

1. 服务器报价将会暂停,客户将无法建立新仓位或是关闭既有持仓。

2. 维护前后的市场价格可能发生跳空,在跳空范围内的挂单或止损/止盈设置将在维护结束后的市场价格成交。

3. 具体维护完毕与开盘时间请依据MT4/MT5软件为准。

望您谅解因此次升级维护为您所带来的不便,我们将继续为您提供更优质的服务。

如您有任何疑问,我们的团队将十分乐意为您解答。
请留言或发邮件至 [email protected] 或联系在线客服。

Market Wavers as Job Data Looms; Dollar Faces Correction Amid Surging Treasury Yields

During cautious investor sentiment and rising concerns about surging Treasury yields, the stock market saw a minor dip as job market data loomed on the horizon. The Dow Jones Industrial Average closed slightly lower, while consumer staples companies faced substantial losses. Meanwhile, the US dollar underwent a correction due to overbought conditions, influenced by declining Treasury yields and disappointing economic data. In the currency market, the EUR/USD pair rebounded, and the USD/JPY pair saw a decrease, impacting speculators. Sterling rose, and the Australian dollar saw gains, while crude oil prices dropped significantly. Amidst all this, the S&P 500 remained above its 200-day moving average, leaving investors eagerly awaiting the forthcoming job market data’s potential impact on interest rates and the stock market.

Stock Market Updates

On Thursday, the stock market experienced a slight downturn as investors anxiously awaited key job market data scheduled for release on Friday. The Dow Jones Industrial Average closed with a minor loss of 9.98 points, or 0.03%, settling at 33,119.57, while the S&P 500 dipped 0.13% to 4,258.19, and the Nasdaq Composite dropped 0.12% to finish at 13,219.83. Notably, consumer staples companies bore the brunt of the market losses, with Molson Coors shares falling by 6.3%, and Mondelez International and Clorox both declining by over 5%.

Investor sentiment remained cautious as weekly initial jobless claims came in at 207,000, a mere 2,000 increase from the prior week, falling just short of economists’ expectations of 210,000. While this slight rise in jobless claims was in line with market predictions, it was disappointing to some investors hoping for signs of a labor market downturn that might influence the Federal Reserve’s interest rate decisions. The 10-year Treasury yield initially ticked up but ultimately decreased to 4.714%, reflecting the ongoing uncertainty in the market as it transitions from a low-rate environment to a more normalized one. On Friday, the market eagerly anticipated nonfarm payrolls data for September, with economists projecting a gain of 170,000 jobs, a decline from the previous month, as investors hoped for labor market softening that could potentially affect rate hikes and Treasury yields.

Despite a slight boost in stocks on Wednesday, following positive payroll data from ADP, both the broad market index and the Dow are on track for a losing week. The Dow declined by 1.16% over the week and turned negative for the year during Tuesday’s market selloff, while the S&P 500 is down 0.7% for the week, and the Nasdaq has remained relatively flat. Overall, investors are closely monitoring labor market data to gauge potential changes in interest rates and their impact on the stock market.

Data by Bloomberg

On Thursday, the overall market showed a slight decline of -0.13%. Real Estate and Health Care sectors performed well, with gains of +0.67% and +0.49% respectively. Financials and Information Technology also saw growth at +0.38% and +0.25%. However, Communication Services, Utilities, Consumer Discretionary, Energy, Industrials, and Materials sectors all experienced declines, ranging from -0.12% to -1.26%. Consumer Staples recorded the most significant drop, with a decline of -2.07%.


Currency Market Updates

The US dollar faced a decline in its value, as reflected by the dollar index, which retreated on Thursday. This depreciation was attributed to the overbought state of the US currency, influenced by declining Treasury yields. The correction was initiated following disappointing ADP payroll data and mediocre ISM services data earlier in the week, and it was not alleviated by Thursday’s job claims data. Investors were also concerned about the significant increase in 10-year Treasury yields, which had surged from 4.06% to 4.88% since a correction low in September. This surge in yields amplified financial risk beyond the Federal Reserve’s rate increases, potentially reducing the need to maintain high-interest rates for an extended period. While Fed speakers have maintained a hawkish stance, there were worries that soaring Treasury yields could intensify tightening efforts and disinflation. Chicago Federal Reserve Bank President Austan Goolsbee expressed optimism about the economy’s path toward 2% inflation without excessive recession risk.

In the currency market, the EUR/USD pair exhibited a recovery despite challenges, breaching the 10-day moving average. This rebound occurred even as German August exports fell short of forecasts, and an ECB policymaker, Francois Villeroy de Galhau, pointed out that the spike in yields argued against another rate hike. The USD/JPY pair saw a 0.5% decrease as Treasury-JGB yield spreads declined, influenced by factors such as 10-year JGB yields rising to their highest levels since 2013. These developments impacted speculators who were looking for a breakout in USD/JPY, with their expectations dashed by a recent plunge in the pair. Sterling, on the other hand, experienced a 0.45% rise and surpassed resistance levels for the first time since early September, although oversold buy signals would require a close above last Friday’s swing high and weaker-than-anticipated U.S. jobs data for confirmation. Additionally, the Australian dollar rose by 0.7% as high-beta currencies rebounded due to the pullback in Treasury yields and a shift towards derisking, while crude oil prices fell by over 2% following a significant drop the previous day, driven by concerns about demand. Meanwhile, the S&P500 remained above its 200-day moving average.

Picks of the Day Analysis
EUR/USD (4 Hours)

EUR/USD Gains Ground as US Dollar Weakens, Awaiting Jobs Data

The EUR/USD has experienced a two-day climb, nearing the 1.0550 level, driven by a softer US dollar, although the overall trend remains bearish, with future direction dependent on forthcoming US jobs data. Germany’s recent economic indicators reveal a sluggish outlook, reinforcing expectations that the European Central Bank is unlikely to raise interest rates. In the US, despite mixed job market data, a decrease in US yields and a rebound in equities have weakened the Greenback. The upcoming US Nonfarm Payrolls report will be pivotal in determining the EUR/USD’s path, with a strong report poised to reinforce the bearish trend and weak numbers potentially extending the recovery.

Chart EURUSD by TradingView

Based on technical analysis, the EUR/USD went up on Thursday and managed to reach the upper band of the Bollinger Bands. Right now, the EUR/USD is trading below the upper band, which suggests a chance for a small downward move to reach the middle band of the Bollinger Bands. The Relative Strength Index (RSI) is at 56, indicating that the EUR/USD is currently trying to return to a neutral position.

Resistance: 1.0558, 1.0616

Support: 1.0489, 1.0406

XAU/USD (4 Hours)

XAU/USD Nears Multi-Month Low as Dollar Corrects Amid Economic Concerns

The XAU/USD pair is trading close to a recent multi-month low of $1,813 per troy ounce, marking its ninth consecutive day of decline. Despite the US Dollar’s correction from multi-month highs, Gold struggles to attract buyers. Concerns over persistent inflationary pressures and a tight labor market persist as investors remain cautious, driven by hawkish comments from Federal Reserve officials and mixed employment sector signals. With the release of the September Nonfarm Payrolls report looming, the stability in US Treasury yields at slightly lower levels is preventing a near-term Dollar rally.

Chart XAUUSD by TradingView

Based on technical analysis, XAU/USD exhibited consolidation on Thursday. It creates a narrow band of the Bollinger Bands. Currently, the price of gold is squeezed by the bands which indicate that the market is still in waiting mode. The Relative Strength Index (RSI) currently stands at 38, signaling a bearish bias for the XAU/USD pair.

Resistance: $1,834, $1,858

Support: $1,809, $1,777

Economic Data
CurrencyDataTime (GMT + 8)Forecast
CADEmployment Change20:3022.1K
CADUnemployment Rate20:305.6%
USDAverage Hourly Earnings20:300.3%
USDNon-Farm Employment Change20:30171K
USDUnemployment Rate20:303.7%

美股产品交易设置调整通知 – 2023年10月5日

尊敬的用户:

您好!

为进一步丰富广大客户的投资选择,我们很高兴地在此宣布将于下述时间放宽对于美股产品的相关交易条件,VT Markets 将于 2023 年 10月 16日调整美股产品的部份交易设置,详请参考如下:

注意:以上数据仅供参考,实际执行数据有可能会有变动,具体请依据MT4/MT5软件为准。

温馨提醒:

1. 本次调整除杠杆之外,美股产品的其他所有交易细则维持不变。

2. 此次调整可能影响账户内预付款比例,建议您确保账户内有足够资金。

如您有任何疑问,我们的团队将十分乐意为您解答。
请留言或发邮件至 [email protected] 或联系在线客服。

Dow Jones Rebounds as Treasury Yields Retreat, Markets Await Jobs Report

On Wednesday, the Dow Jones Industrial Average ended a three-day losing streak as Treasury yields pulled back from multiyear highs. The Dow gained 0.39%, while the S&P 500 and Nasdaq also showed positive performances. Notable sector performances included the consumer discretionary sector, boosted by Tesla and Norwegian Cruise Line, and the energy sector, which suffered due to a drop in crude prices. These market movements followed the release of weak private payrolls data, raising concerns about higher interest rates and their impact on the economy. Currency markets saw a decline in the US dollar as Treasury yields and oil prices retreated, adding to uncertainty in the market. All eyes were on Friday’s jobs report for insights into the labor market and the direction of equities and interest rates.

Stock Market Updates

On Wednesday, the Dow Jones Industrial Average snapped a three-day losing streak in response to a pullback in Treasury yields, which had reached multiyear highs. The 30-stock index gained 127.17 points, or 0.39%, closing at 33,129.55. The S&P 500 also showed a positive performance, increasing by 0.81% and closing at 4,263.75, while the Nasdaq Composite surged by 1.35% to close at 13,236.01. Notable among sector performances within the S&P 500 was the consumer discretionary sector, which stood out as the best performer, with a rise of approximately 2%. This boost was primarily attributed to strong gains from Tesla, up by 5.9%, and Norwegian Cruise Line, up by 3.8%. In contrast, the energy sector was the worst-performing sector for the day due to a significant drop in crude prices. Devon Energy and Marathon Oil both saw declines of around 5%, while SLB and Halliburton dropped more than 4%.

These market movements came after the release of new jobs data, which revealed that only 89,000 private payrolls were added in the previous month, significantly below the Dow Jones forecast of 160,000 and even lower than the upwardly revised figure of 180,000 payroll additions for August. Consequently, Treasury yields pulled back slightly from their 2007-level highs, with the 10-year Treasury yield trading at 4.735%. The market has been grappling with concerns over higher interest rates, which have raised fears of a potential recession and pushed mortgage rates to nearly 8%, causing mortgage demand to plummet to its lowest levels since 1996. Investors are eagerly awaiting the release of September’s nonfarm payrolls data on Friday, hoping for more insights into the labor market’s strength and the future direction of equities and interest rates. The recent divergence between fixed income and equities has left investors on edge, and the market is being heavily influenced by movements in interest rates.

Data by Bloomberg

On Wednesday, across all sectors, the market experienced a positive trend with a gain of 0.81%. The sectors that performed particularly well include Consumer Discretionary (+1.97%), Communication Services (+1.28%), Information Technology (+1.25%), Materials (+1.19%), Real Estate (+1.13%), and Financials (+0.83%). On the other hand, some sectors had a less favorable day, with Consumer Staples (+0.73%), Health Care (+0.45%), Industrials (+0.38%) recording more modest gains. Utilities (-0.09%) saw a slight decline, while Energy had a significant decrease of -3.36%.

Currency Market Updates

In recent currency market updates, the US dollar experienced a decline of 0.27% as Treasury yields and oil prices retreated, prompting market participants to contemplate the potential adverse economic consequences and the sustainability of these trends. The uncertainty was evident in the performance of USD/JPY, which had previously witnessed a significant drop from its 2023 peak, ranging from 150.165 to 147.30 on Tuesday, while crude oil prices collapsed. The day’s US economic data, including ADP’s 89,000 employment increase, falling short of the expected 153,000, added to the uncertainty. This was further compounded by the upcoming non-farm payrolls report, with forecasts predicting a decline from 187,000 to 170,000, a key market indicator. ISM services remained on par with forecasts at 53.6, showing a slight dip from the previous month, primarily due to a significant drop in new orders, which fell from 57.5 to 51.8, reaching a nine-month low. Notably, the article highlighted that the eurozone was expected to contract in the third quarter, while the US Q3 GDP forecasts remained optimistic at 4.9% annualized. In terms of monetary policy, the European Central Bank (ECB) was seen as less likely than the Federal Reserve (Fed) to raise interest rates again.

Amid this context, the EUR/USD currency pair saw a 0.37% rise, primarily driven by the broader weakening of the US dollar and a 7-basis point rebound in 2-year bund-Treasury yield spreads. The pair’s rebound from Tuesday’s low of 1.0448 may depend on Friday’s payrolls report echoing the soft ADP data from Wednesday. USD/JPY remained relatively flat within a narrow trading range of around 149, particularly after bouncing back from a notable decline that saw it drop from 150.165 to 147.30 on Tuesday. Concerns over potential Japanese intervention to bolster the yen’s value left the USD/JPY uptrend in a state of uncertainty. Meanwhile, the British pound experienced a 0.5% increase, partly due to a positive revision in the UK’s September PMIs, despite the fact that the PMI figures still indicated contraction below the 50 mark. These market dynamics occurred in the backdrop of 10- and 30-year Treasury yields falling after testing crucial resistance levels earlier on Wednesday. As the week progressed, all eyes were on Friday’s jobs report, which was anticipated to have a substantial impact on the currency markets.

Picks of the Day Analysis
EUR/USD (4 Hours)

EUR/USD Struggles to Hold Ground Against Strengthening US Dollar Amid Rising Yields and Weak Economic Data

The Euro, after recovering from a year-low against the US Dollar, is facing challenges in maintaining its position above 1.0500. Rising government bond yields, with the German 10-year yield hitting its highest level since 2011, are causing concern among investors. Additionally, economic data from the Eurozone, including a negative shift in the Producer Price Index and a decline in Retail Sales, are adding to the Euro’s woes. While the European Central Bank remains cautious about interest rates, the US Dollar continues its upward trend, supported by strong fundamental factors and upcoming employment data releases.

Chart EURUSD by TradingView

Based on technical analysis, the EUR/USD went up on Wednesday and managed to reach the middle line of the Bollinger Bands. Right now, the EUR/USD is trading above the middle line, which suggests a chance for a small upward move to reach the upper line of the Bollinger Bands. The Relative Strength Index (RSI) is at 53, indicating that the EUR/USD is currently trying to return to a neutral position.

Resistance: 1.0538, 1.0605

Support: 1.0489, 1.0406

XAU/USD (4 Hours)

XAU/USD Holds Steady Around $1,820 as Investors Seek Yield Amid Uncertain Market Signals

Gold prices remained relatively stable on Wednesday, with little movement as they hovered around the $1,820 mark. While initial demand for the precious metal appeared before Wall Street’s opening, it was short-lived, as investors turned to high-yield assets. Financial markets sought direction from government bond yields and US economic data but found few clear signals. The 10-year Treasury note yield reached its highest level since 2007 before easing, while the US Dollar traded near daily lows, reflecting a modest improvement in market sentiment amid mixed economic figures.

Chart XAUUSD by TradingView

Based on technical analysis, XAU/USD exhibited consolidation on Wednesday. It reached the downward-sloping middle line of the Bollinger Bands. Currently, the price of gold is trading around the middle line, indicating the potential for further consolidation throughout the day, given the narrowing of the Bollinger Bands. The Relative Strength Index (RSI) currently stands at 37, signaling a bearish bias for the XAU/USD pair.

Resistance: $1,834, $1,858

Support: $1,809, $1,777

Economic Data
CurrencyDataTime (GMT + 8)Forecast
USDUnemployment Claims20:30211K
Back To Top
server

您好 👋

我能帮您什么吗?

立即与我们的团队聊天

在线客服

通过以下方式开始对话...

  • Telegram
    hold 维护中
  • 即将推出...

您好 👋

我能帮您什么吗?

telegram

用手机扫描二维码即可开始与我们聊天,或 点击这里.

没有安装 Telegram 应用或桌面版?请使用 Web Telegram .

QR code