Nvidia’s stellar earnings propel S&P 500 and Nasdaq to new highs amidst broad market optimism

On Thursday, the S&P 500 and Nasdaq Composite reached impressive new heights, largely driven by Nvidia’s remarkable quarterly earnings report. The S&P 500 surged by 2.11%, its best performance since January 2023, while the Nasdaq Composite soared by 2.96%, flirting with its all-time high, thanks to Nvidia’s 16.4% share price jump after reporting a 265% revenue increase from its thriving AI business. This surge highlighted Nvidia’s growing dominance in the tech sector and boosted confidence across the broader market, particularly in Big Tech stocks like Meta, Amazon, Microsoft, and Netflix. Concurrently, the U.S. economy showed signs of robust health with a significant drop in jobless claims and a surge in existing home sales, further fueling market optimism. Meanwhile, currency markets adjusted to the mixed global economic indicators and policy expectations, with the dollar stabilizing and the USD/JPY pair experiencing an uptick, reflecting the complex interplay of global economic trends and monetary policy anticipations.

Stock Market Updates

On Thursday, the S&P 500 reached new heights, propelled by Nvidia’s unexpectedly strong quarterly earnings, which not only boosted the broader market but also significantly lifted the tech sector. The S&P 500 climbed 2.11% to close at 5,087.03, marking its most impressive performance since January 2023, while the Nasdaq Composite soared 2.96% to end the day at 16,041.62, nearing its all-time closing high. Meanwhile, the Dow Jones Industrial Average experienced a notable surge of 456.87 points or 1.18%, surpassing the 39,000 mark for the first time and closing at a new record of 39,069.11, reflecting widespread optimism in the financial markets.

Nvidia, a leading chipmaker, saw its shares jump 16.4% to an all-time high after announcing a staggering 265% increase in total revenue from the previous year, primarily fueled by its booming artificial intelligence business. This growth has positioned Nvidia as one of the largest U.S. companies by market capitalization, with expectations for continued revenue growth in the coming quarter. The enthusiasm around AI and Nvidia’s extraordinary performance has significantly influenced the rally in Big Tech stocks, including notable gains in shares of Meta, Amazon, Microsoft, and Netflix, thereby bolstering confidence in the tech space, and benefiting the broader stock market.

Data by Bloomberg

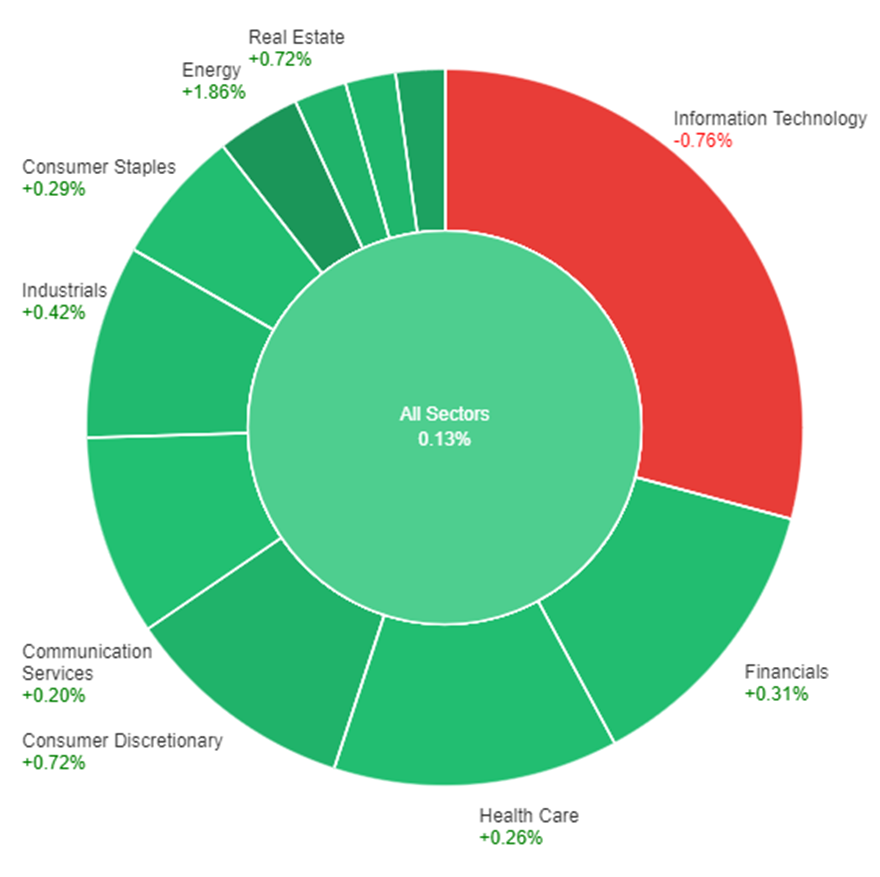
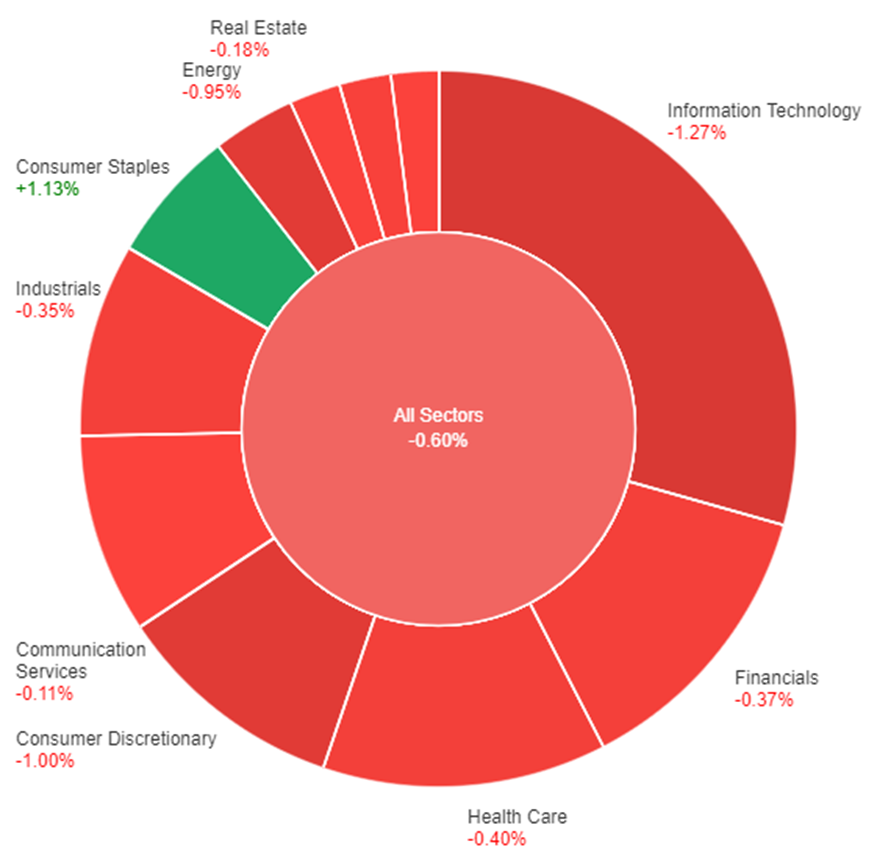
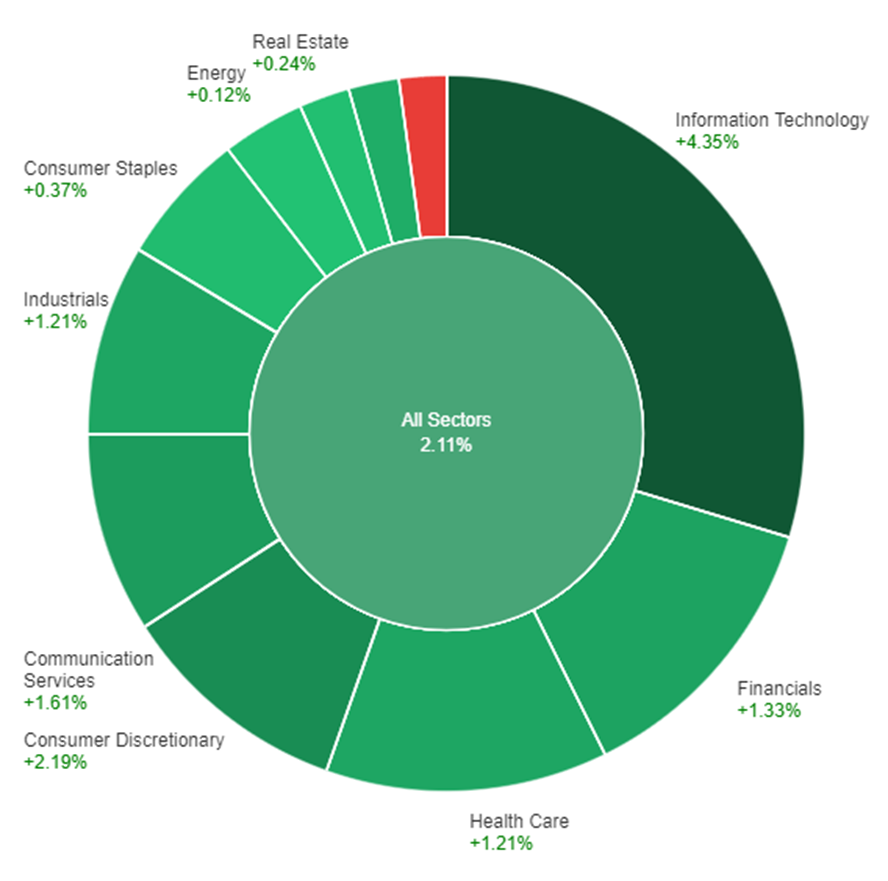
On Thursday, the stock market witnessed a positive trend across most sectors, with the overall sector experiencing a 2.11% increase in price. Information Technology led the gains with a significant rise of 4.35%, followed by Consumer Discretionary and Communication Services, which saw increases of 2.19% and 1.61%, respectively. Financial, Industrials and Health Care sectors also enjoyed gains, each increasing by over 1%. Materials, Consumer Staples, and Real Estate sectors saw modest rises, with Energy experiencing a slight increase of 0.12%. In contrast, Utilities were the only sector to decline, dropping by 0.77%.

Currency Market Updates

The currency market has seen a notable shift as the dollar index stabilized from a three-week low, propelled by an unexpected drop in U.S. jobless claims which overshadowed the mixed performance in flash PMIs across major economies. Despite the composite PMI readings from the eurozone and the UK slightly surpassing forecasts, and a contraction in the U.S. figures, the market’s attention gravitated towards the robust U.S. jobless claims data, showcasing the lowest levels since before 2018 and comparable to figures last seen in 1969. Additionally, the U.S. housing market demonstrated resilience with existing home sales in January surging by 3.1%, marking the highest point since the previous August, suggesting a sensitivity to fluctuating mortgage rates. This economic optimism was further buoyed by stellar quarterly results from Nvidia, which underscored the rapid expansion of AI usage, influencing global equity markets positively.

Amid these developments, currency pairs reacted to the broader economic indicators and policy expectations. The Euro dipped to a flat position against the dollar, reflective of Germany’s PMI contraction and aligning with anticipations of the ECB’s rate cuts preceding those of the Federal Reserve. Meanwhile, the Sterling showed modest gains against the dollar, buoyed by promising UK PMIs, despite being significantly off its recent high. The USD/JPY pair experienced an uptick, driven by the widening yield spreads between U.S. Treasury and Japanese government bonds, and a general shift towards risk-off flows that placed more pressure on the yen. As the market anticipates upcoming U.S. economic reports, including the core PCE inflation data, income, and consumption figures, the currency landscape remains poised for further adjustments, with special attention to the potential impacts on USD/JPY’s trajectory toward its yearly highs and the looming possibility of Japanese intervention amidst speculations of policy normalization by the Bank of Japan.

Picks of the Day Analysis
EUR/USD (4 Hours)

EUR/USD Retreats from Three-Week High Amid Mixed US Economic Signals and ECB Caution

EUR/USD experienced a decline from its three-week peak around 1.0900, settling near 1.0820 after an initial surge, influenced by positive US job data and varied bond yield performances amidst speculation of future Federal Reserve (Fed) interest rate cuts. The possibility of the Fed easing monetary policy has been bolstered by strong US inflation figures, though the likelihood of a May rate cut seems diminished, with a greater chance anticipated for June. Conversely, the European Central Bank (ECB) maintains a cautious stance against early rate reductions, despite expectations of a downward inflation forecast revision in March. This cautious approach is echoed by ECB officials, emphasizing the premature nature of financial market relaxation, and highlighting ongoing concerns over wage pressures and the labour market’s tightness, suggesting a potential delay in the ECB’s monetary easing.

Chart EUR/USD by TradingView

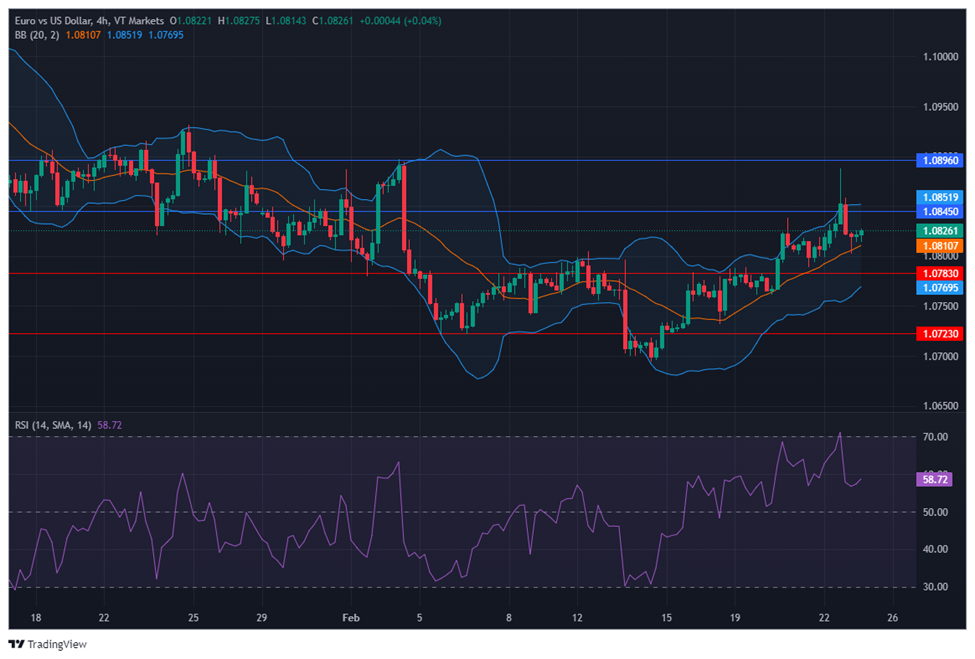
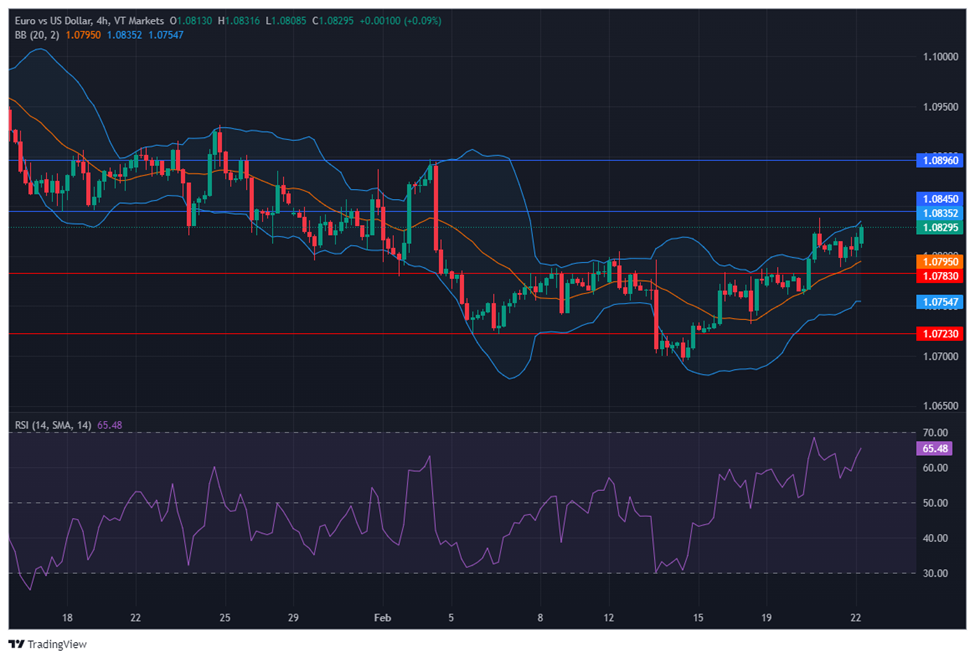
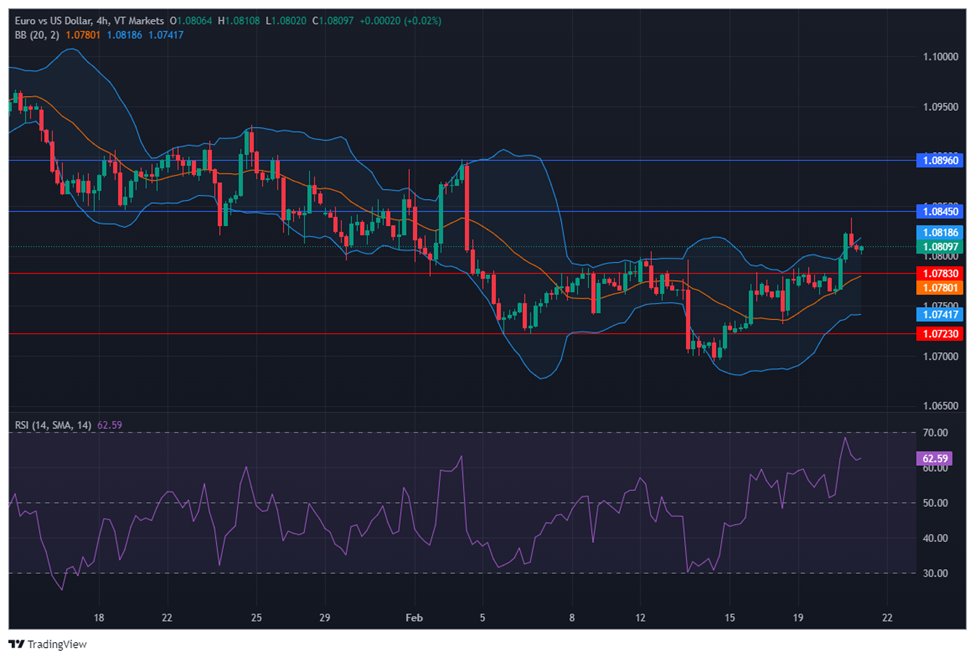
On Thursday, the EUR/USD moved higher and reached the upper band of the Bollinger Bands. Currently, the price is moving just above the middle band, suggesting a potential upward movement to reach back to the upper band. Notably, the Relative Strength Index (RSI) maintains its position at 58, signaling a neutral outlook for this currency pair.

Resistance: 1.0845, 1.0896

Support: 1.0783, 1.0723

XAU/USD (4 Hours)

XAU/USD Retreats from Peak as US Dollar Recovers Amid Positive Economic Indicators

Spot Gold receded from its recent high of $2,034.86 as the US Dollar regained strength following positive US economic data and increased government bond yields. Despite the Dollar’s initial drop amid a tech-led stock market rally in Asia and Europe, it rebounded before the US markets opened, influenced by less-than-expected growth in Initial Jobless Claims and a surge in February’s PMI figures, indicating a robust expansion in manufacturing and a slight contraction in services. Meanwhile, the 10-year Treasury note yields touched multi-week highs, driven by the Federal Open Market Committee’s minutes, which suggested a cautious approach towards rate cuts, awaiting further inflation progress.

Chart XAU/USD by TradingView

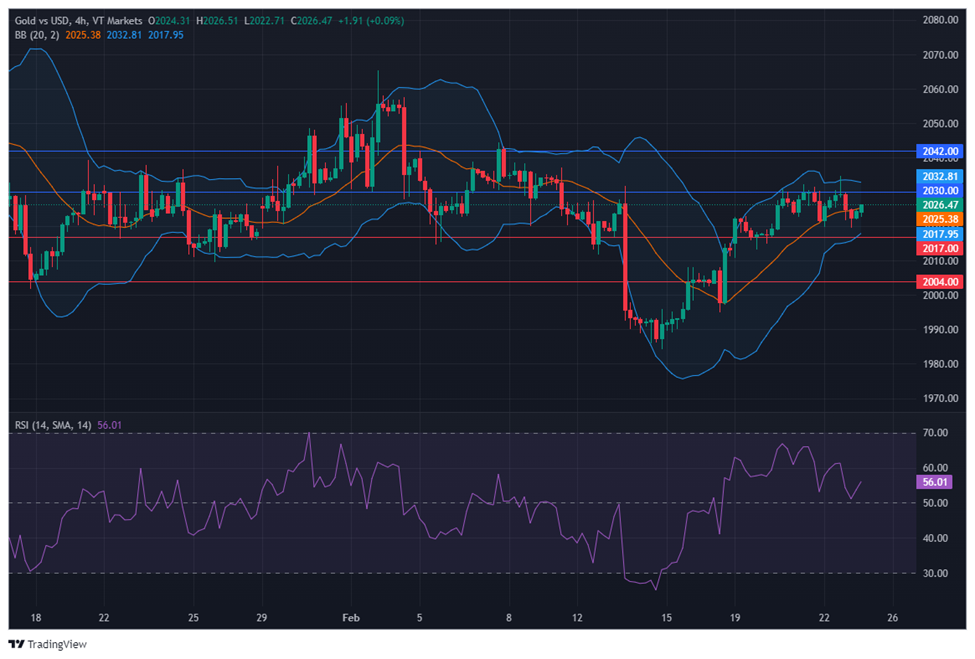
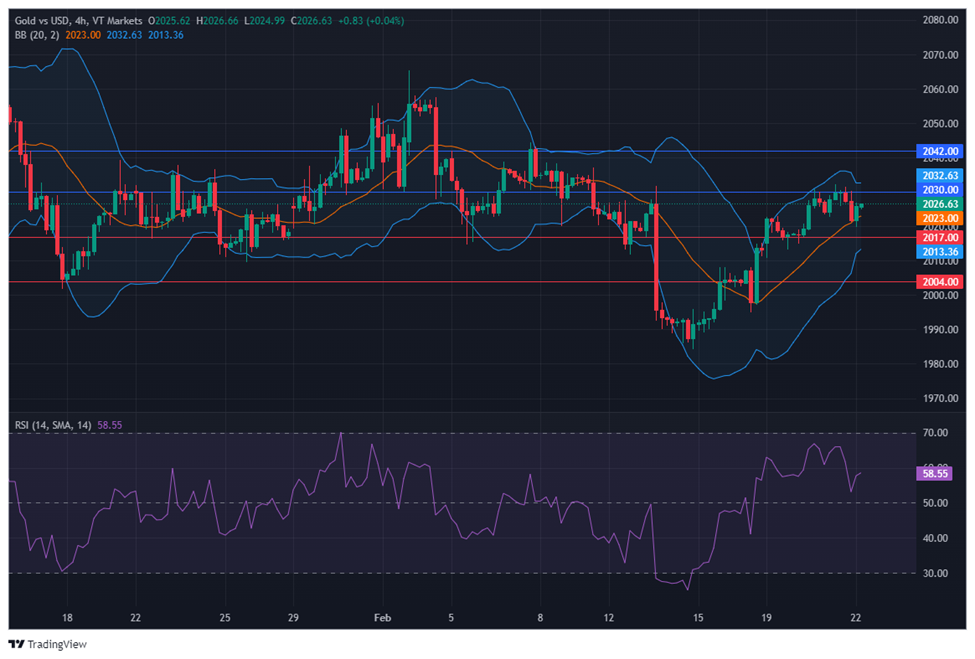
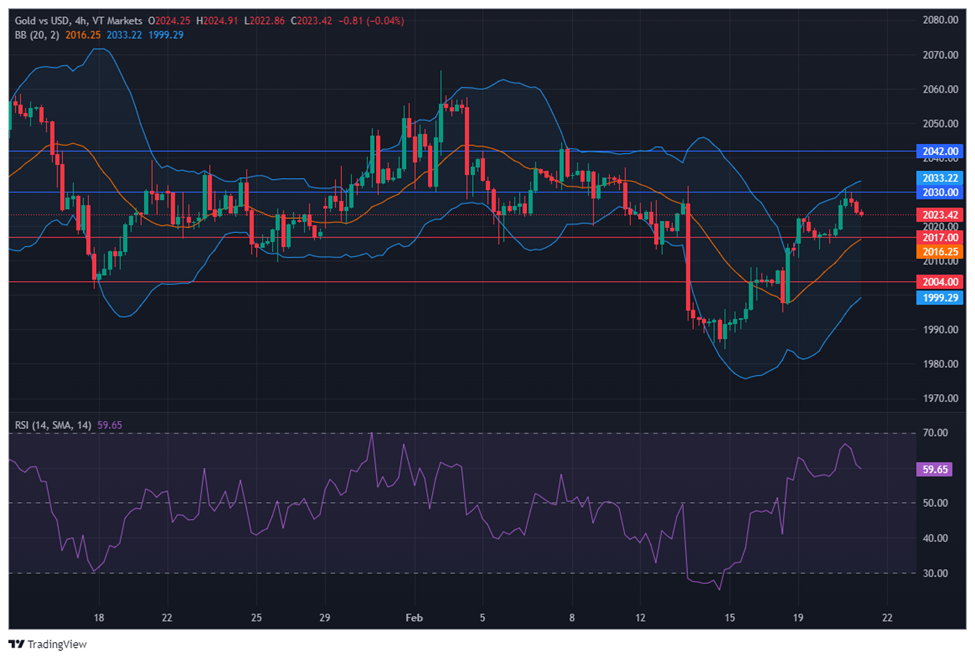
On Thursday, XAU/USD moved lower to reach below the middle band after reaching the upper band of the Bollinger Bands. Currently, the price is moving just around the middle band, suggesting a potential consolidation movement as the bands are squeezing. The Relative Strength Index (RSI) stands at 56, signaling a neutral outlook for this pair.

Resistance: $2,030, $2,042

Support: $2,017, $2,004

服务器升级维护通知 – 2024年2月22日

尊敬的用户:

您好! VT Markets 致力于为客户提供更快速且稳定的交易环境,我们将于周末进行服务器 (MT4/MT5) 升级维护。

维护时段:
2024 年 02 月 24 日 (星期六) 08:00 至 16:00

上述时段采用 GMT+8

维护期间请您务必留意下列事项:

1. 服务器报价将会暂停,客户将无法建立新仓位或是关闭既有持仓。若您不希望在维护时段有任何持仓,建议您可先行平仓。

2. 维护前后的市场价格可能发生跳空,在跳空范围内的挂单或止损/止盈设置将在维护结束后的市场价格成交。

3. 具体维护完毕与开盘时间请依据MT4/MT5软件为准。望您谅解因此次升级维护为您所带来的不便,我们将继续为您提供更优质的服务。

如您有任何疑问,我们的团队将十分乐意为您解答。
请留言或发邮件至 [email protected] 或联系在线客服。

Diversifying investments through ETF trading 

ETFs, or Exchange-Traded Funds, are gaining popularity among investors for their simplicity and versatility. They provide an easy way to invest in a range of assets, making them accessible for non-professional traders. 

Imagine being able to invest in a diverse basket of stocks or bonds without the complexity of managing individual assets—that’s the power of ETFs. 

In this article, we’ll explore why ETFs matter for forex traders, covering their basics, advantages, popular categories, and practical trading tips. 

Understanding ETFs 

ETFs are investment funds traded on stock exchanges, similar to individual stocks. However, they’re different from mutual funds and individual stocks in a couple of ways. 

  • Firstly, ETFs are like mutual funds because they pool investors’ money to invest in various assets like stocks, bonds, or commodities. But, unlike mutual funds traded at the end of the day, ETFs are traded on stock exchanges throughout the day at market prices, just like stocks. 
  • Secondly, ETFs differ from individual stocks because they represent ownership in a mix of assets, not just one company. So, when you invest in an ETF, you’re actually buying a share of a fund holding a bunch of different securities. 

ETFs track specific benchmarks like the S&P 500 for stocks or the Barclays Capital Aggregate Bond Index for bonds, aiming to mirror their performance by holding similar assets. 

For forex traders, ETFs offer diversification by investing in a variety of securities within one investment. This spreads risk, ideal for those with limited capital or seeking a diverse portfolio without buying multiple securities. 

ETFs provide liquidity since they trade on stock exchanges throughout the day at market prices. This allows easy buying and selling, unlike mutual funds which trade once a day. 

Furthermore, ETFs offer transparency by disclosing their holdings daily, giving investors clear visibility into their investments. 

Popular ETF categories 

ETFs come in various categories, each offering unique investment opportunities for forex traders. Here is a breakdown of the most common types

1. Equity ETFs 

These ETFs invest in stocks, providing exposure to a particular market, industry, or region. They offer diversification across multiple companies within a single investment. 

For example, the SPDR S&P 500 ETF (SPY) tracks the performance of the S&P 500 Index, offering broad exposure to large-cap US stocks. 

2. Bond ETFs 

Bond ETFs invest in fixed-income securities such as government bonds, corporate bonds, or municipal bonds. They offer income generation and diversification, with varying levels of risk depending on the underlying bonds. 

An example is the iShares Core US Aggregate Bond ETF (AGG), which tracks the performance of the US investment-grade bond market. 

Brief history of ETFs
source: Investopedia

3. Commodity ETFs 

These ETFs track the performance of commodities like gold, silver, oil, or agricultural products. They provide exposure to commodity prices without the need for direct commodity ownership. 

The SPDR Gold Shares ETF (GLD) is a popular example, offering exposure to the price of gold. 

4. Sector ETFs 

Sector ETFs focus on specific sectors or industries, such as technology, healthcare, or energy. They allow investors to target areas of the market they believe will outperform or diversify their portfolio. 

For instance, the Technology Select Sector SPDR Fund (XLK) invests in technology companies within the S&P 500 Index. 

Each category of ETFs has its own characteristics and potential benefits, catering to different investment objectives and risk tolerances. 

Advantages of trading ETF CFDs 

Trading ETFs through CFDs (Contracts for Difference) involves entering into a contract with a broker to speculate on the price movement of the ETF without owning the underlying asset. 

When it comes to ETF CFDs trading, there are several advantages worth considering: 

  • Flexibility and leverage: CFDs offer traders the flexibility to control larger positions with a smaller amount of capital, potentially amplifying gains or losses compared to traditional investing. 
  • Long and short positions: CFD trading allows traders to take both long (buy) and short (sell) positions on ETFs, enabling them to profit from both rising and falling markets. 

In summary, trading ETFs through CFDs provides forex traders with flexibility, leverage, and the opportunity to profit from both upward and downward price movements in the market. 

Tips for successful ETF trading 

By following these tips, you can enhance your chances of success in ETF trading while managing risks effectively: 

  • Have a well-defined trading plan: It’s crucial to establish a clear trading plan outlining your goals, risk tolerance, and strategies. Stick to your plan and avoid making impulsive decisions based on emotions or market fluctuations. 
  • Stay informed about market trends: Keep yourself updated on market trends and news that could affect ETF prices. This includes economic indicators, geopolitical events, and industry-specific developments. Being informed allows you to make informed decisions and adapt your trading strategy accordingly. 
  • Diversify your investments: Spread your risk by diversifying across multiple ETFs representing different sectors or asset classes. This helps mitigate the impact of volatility in any single investment and allows you to capture opportunities in various market segments. 

In conclusion, ETFs serve as versatile investment vehicles for forex traders, offering exposure to various asset classes like stocks, bonds, and commodities. Trading ETFs through CFDs provides flexibility, leverage, and profit opportunities. It’s essential to have a well-defined trading plan, stay informed about market trends, and practice responsible trading strategies. By implementing these principles, traders can navigate the market confidently and responsibly, maximising their potential for success. 

Unlocking the power of correlations in forex trading 

In forex trading, correlations show how different currency pairs or financial instruments move together. For example, when the EUR/USD pair goes up, the USD/CHF pair often goes down, and vice versa. 

source: investopedia

Understanding these relationships is crucial. It helps traders predict market movements, manage risks, and make smarter decisions. In this guide, we will explore correlations in forex trading and how you can use them to improve your strategies. Let’s get started! 

Understanding correlations 

Correlation in forex refers to the statistical relationship between different currency pairs or financial instruments and how they move in relation to each other. 

It is measured on a scale from -1 to +1, where -1 indicates a perfect negative correlation (inverse movement), +1 indicates a perfect positive correlation (same direction movement), and 0 indicates no correlation (movements are independent of each other). 

Correlation types
source: Simply Psychology

Understanding correlation helps traders anticipate how one asset’s movement may affect another. 

  • Positive correlation: This occurs when two currency pairs or assets tend to move in the same direction. For example, if the EUR/USD pair goes up, the GBP/USD pair also tends to rise. Traders can use positive correlations to diversify their portfolios by trading multiple currency pairs that move in tandem, potentially reducing overall risk exposure. 
  • Negative correlation: In contrast, negative correlation occurs when two currency pairs or assets move in opposite directions. For instance, when the USD/JPY pair increases, the price of Gold may decrease. Traders can use negative correlations as a hedging strategy to offset potential losses in one position with gains in another, helping to mitigate risk during market fluctuations. 
  • Neutral correlation: Neutral correlation indicates a weak or non-existent relationship between currency pairs or assets. For example, the EUR/USD and USD/CHF pairs may show little correlation, meaning their movements do not significantly influence each other. While neutral correlations may not offer direct trading opportunities, they can still provide valuable information about market dynamics and help traders avoid making decisions based on false assumptions of correlation. 
The correlation coefficient formula may seem complex, but you can use a specialised online calculator.
source: BYJU’S 

How to identify correlations 

If you’ve decided to count the correlation between two currency pairs, here’s a guide to help you get started: 

1. Select currency pairs: Choose the currency pairs you want to analyse for correlation. For example, you might want to examine the correlation between EUR/USD and GBP/USD. 

2. Collect historical data: Gather historical price data for the selected currency pairs. You can obtain this data from various sources such as trading platforms, financial websites, or specialised data providers. 

3. Calculate correlation coefficient: Use online correlation calculators, Excel spreadsheets with built-in functions like CORREL, or trading platforms such as MetaTrader 4 (MT4) and MetaTrader 5 (MT5) to compute correlation coefficients between the currency pairs. 

4. Interpret results: Analyse the correlation coefficient to understand the relationship between the currency pairs. A coefficient close to +1 indicates a strong positive correlation, while a coefficient close to -1 indicates a strong negative correlation. A coefficient close to 0 suggests a weak or no correlation. 

5. Repeat for different timeframes: Consider calculating correlations over different timeframes (e.g., daily, weekly, monthly) to identify any changes in correlation patterns over time. This can provide valuable insights into the stability of the correlation relationship. 

By following these steps, you can effectively count and interpret the correlation between currency pairs, helping you make more informed trading decisions in the forex market. 

Currency pairs correlations table
source: Pinterest

Factors affecting correlations 

Various factors influence the correlations between currency pairs in forex trading. Understanding these nuances is crucial for traders seeking to anticipate market movements and make informed trading decisions.  

  • Economic indicators:  Gross Domestic Product (GDP), growth rates, and inflation significantly shape currency correlations. Positive GDP figures in both the Eurozone and the US can strengthen the correlation between EUR/USD and USD/CHF pairs. Divergent inflation rates can weaken correlations as traders adjust their strategies based on economic forecasts. 
  • Market sentiment: Reflecting traders’ attitudes towards currencies, market sentiment impacts correlations. During periods of increased risk appetite, currencies like the Australian dollar (AUD) and New Zealand dollar (NZD) tend to exhibit positive correlations. Safe-haven currencies such as the US dollar (USD) and Japanese yen (JPY) may strengthen during times of uncertainty, thereby weakening correlations with riskier currencies. 
  • Geopolitical events: Events such as elections or trade negotiations can disrupt currency correlations. Major agreements may strengthen correlations between currencies, while heightened tensions can weaken them as traders seek refuge in safer assets. Increased geopolitical risks might diminish the correlation between USD/JPY and gold. 
  • The relationship between currencies and commodities: The interplay between currencies and commodities also influences currency correlations. For example, the Canadian dollar (CAD) often correlates positively with oil prices due to Canada’s significant oil exports. Consequently, a rise in oil prices could strengthen the correlation between USD/CAD and oil. Conversely, if gold prices surge, the correlation between USD/JPY and gold may weaken, given the status of the Japanese yen as a safe-haven currency. 
USD/CAD and oil prices positive correlation
source: Reuters

Using correlations in trading 

Leveraging correlations in forex trading provides traders with a strategic advantage, offering insights into market dynamics and aiding in risk management. By incorporating correlations into trading strategies, traders refine their approach, optimise trade timing, and enhance overall performance in the forex market. 

  • Strategy development: Design strategies to capitalise on currency correlations, identifying trends, and optimising trade timing. 
  • Risk management: Utilise correlated pairs for hedging to mitigate losses and minimise risk exposure. Additionally, diversify risk across multiple currency pairs or asset classes to reduce volatility and enhance stability. 
  • Portfolio diversification: Spread investments across various currency pairs or asset classes with low or negative correlations to minimise overall portfolio risk and enhance long-term stability. 
  • Identifying opportunities: Utilise correlations to identify diversification opportunities by selecting currency pairs with low or negative correlations. 
  • Asset class monitoring: Monitor correlations between different asset classes to optimise portfolio allocation and achieve risk-adjusted returns. 

In conclusion, knowing how currency pairs interact is vital for smart decision-making and managing risks in forex trading. Using correlation analysis is strongly recommended as it helps traders choose the best times to trade, manage risks effectively, and get the most out of their investments. 

Forex Market Analysis: U.S. Dollar’s Post-Fed Minutes Scenario and Nvidia’s Q4 Sales Surge

CURRENCIES:
  • Top of FormThe U.S. dollar pared some losses following the Federal Reserve’s minutes, which advised caution against early rate cuts.
  • Despite an uptick in U.S. Treasury yields, the dollar experienced minor losses after the Jan. 30-31 FOMC minutes were released.
  • The Fed requires more proof of disinflation before considering easing policy, indicating a delay in the rate cut cycle possibly to the latter half of the year.
  • A postponement in rate adjustments may lift U.S. bond yields and the dollar, potentially bringing the DXY index to new highs.
  • This situation could hinder gains for EUR/USD and GBP/USD, while USD/JPY and USD/CAD might face fewer obstacles in rising.

STOCK MARKET:

Nvidia’s Sales Forecast Impact: Nvidia’s strong sales forecast has led to a surge in global stock markets, highlighting the growing investor confidence in generative AI.

Record Highs in Japan: The Nikkei 225 index in Japan reached a record peak, a height not seen since 1989, fueled by technology and semiconductor gains.

European Market Reaction: Following Nvidia’s announcement, Europe’s Stoxx 50 futures saw an increase of nearly 0.9%, indicating positive market sentiment across regions.

Revenue Expectations Exceeded: Nvidia’s anticipated first-quarter revenue of $24 billion surpasses previous estimates, signaling robust growth in the tech sector.

Asian Markets Rally: Stocks in South Korea, Taiwan, and China rose, with the Asian shares index reaching its highest level in almost two years, demonstrating regional market strength.

Tech Company Performance: Nvidia’s post-market share increase of up to 11% reflects the high expectations and performance of tech companies, especially in AI.

China’s Market Stabilization: The Chinese government’s interventions to stabilize its stock market have resulted in prolonged gains, showcasing effective regulatory measures.

Global Economic Implications: The rally in global equities, driven by Nvidia’s forecast, underscores the pivotal role of technology and AI in shaping economic landscapes.

Currency and Commodity Movements: The article notes shifts in currency values, with the dollar slipping, and increases in commodity prices such as crude oil and gold.

Anticipated Economic Data Releases: Markets are also responding to expectations for upcoming economic data from the Eurozone and the U.S., which could further influence global financial trends.

Start your CFD Shares Trading journey with VT Markets now!

Mixed Stock Market Results Amid Nvidia Earnings Anticipation and Fed’s Interest Rate Stance

On Wednesday, the stock market showed mixed outcomes, with the Dow Jones and S&P 500 making slight gains, while the Nasdaq Composite faced a decline, influenced by anxiously awaited Nvidia earnings and Federal Reserve insights. Nvidia’s stock dipped ahead of its fiscal report, reflecting investor concerns over its valuation after a significant year-long surge. The market also reacted to Palo Alto Networks’ and SolarEdge Technologies’ disappointing forecasts, alongside the Fed’s minutes indicating a cautious stance on interest rate cuts, emphasizing inflation control. Currency markets saw fluctuations, with the dollar index falling amidst complex global yield dynamics and central bank policies, highlighting the intricate interplay between economic signals, corporate earnings, and monetary policy expectations.

Stock Market Updates

The stock market experienced mixed results on Wednesday, with the Dow Jones Industrial Average slightly gaining by 48.44 points to close at 38,612.24 and the S&P 500 also up by 0.13% at 4,981.80. In contrast, the tech-heavy Nasdaq Composite fell by 0.32%, continuing its downward trend for the third consecutive session, to end at 15,580.87. The market’s attention was particularly focused on Nvidia, ahead of its fiscal fourth-quarter earnings report, amidst growing concerns over the chipmaker’s valuation after its shares surged nearly 230% over the past year. On the day, Nvidia’s stock declined by 2.85%, reflecting investor apprehension about whether it could continue to buoy the market amidst a backdrop of uncertain catalysts for growth.

Market sentiment was further influenced by a combination of corporate news and insights from the Federal Reserve. Palo Alto Networks saw a significant drop of 28.4% after revising its full-year revenue forecast downwards, while SolarEdge Technologies also faced a setback, with its shares falling approximately 12.2% due to weak first-quarter guidance. Adding to the cautious market outlook, minutes from the Federal Reserve’s January meeting revealed a reluctance to cut interest rates anytime soon, emphasizing that any decisions on rate cuts would require greater confidence in the slowing down of inflation. This stance underscores the central bank’s cautious approach to navigating economic signals, leaving the market to look towards corporate earnings and guidance as potential catalysts for future growth.

Data by Bloomberg

On Wednesday, the market witnessed modest gains across most sectors, with the overall sectors index up by 0.13%. The energy sector led the charge, recording a significant increase of 1.86%, followed closely by utilities, which saw a 1.36% rise. Consumer discretionary and real estate sectors both enjoyed gains of 0.72%, demonstrating a healthy appetite for risk among investors. Other sectors such as materials, industrials, financials, consumer staples, health care, and communication services also experienced growth, albeit at a more moderate pace. However, the information technology sector bucked the positive trend, facing a downturn of 0.76%, indicating sector-specific challenges or profit-taking by investors.

Currency Market Updates

The currency market experienced notable fluctuations, with the dollar index declining by 0.9% amid a complex interplay of treasury yields and central bank policies. The increase in Treasury yields, although outpaced by European yields, failed to keep up with the steadiness of Japanese Government Bond (JGB) yields. This dynamic, alongside the diminishing likelihood of interest rate cuts by major central banks such as the Federal Reserve (Fed), the European Central Bank (ECB), and the Bank of England (BoE), exerted pressure on risk appetite. The anticipation surrounding the Federal Reserve’s minutes and Nvidia’s report further influenced market sentiments. Despite the anticipation, the Fed minutes merely echoed previous statements and comments, offering no new impetus for dollar strength. Meanwhile, the USD/JPY pair saw a slight increase, attributed to the static nature of JGB yields which made the yen less attractive compared to its higher-yielding counterparts.

In Europe, the ECB’s stance, as articulated by Pierre Wunsch, suggested a prolonged period of tight monetary policy, given the persistent wage pressures and tight labor markets. This position was mirrored by the market’s adjustment in expectations for rate cuts, with the first ECB rate reduction now fully priced in for June. The euro found some support against the dollar, benefiting from a tightening in the 2-year bund-Treasury yield spreads. However, the recovery of the EUR/USD pair was tempered by technical resistance and a cautious outlook for the BoE’s policy direction, which also impacted the GBP/USD pair. The British pound struggled against the backdrop of rising Gilts-Treasury yield spreads and comments from BoE officials emphasizing the cost of delayed rate adjustments. These developments underscore the intricate balance of yield dynamics, central bank policies, and economic indicators shaping the currency markets, with implications for the path of the dollar and its major counterparts.

Picks of the Day Analysis
EUR/USD (4 Hours)

EUR/USD Stabilizes Amid Speculations of Fed Rate Cuts

The EUR/USD pair exhibited slight fluctuations, stabilizing around the 1.0800 mark, amidst a backdrop of uncertain US dollar movements and anticipations of Federal Reserve interest rate adjustments. This period of inconclusive price action follows a recent surge to 1.0840, driven by speculations and marginal gains in US bond yields, hinting at possible Fed rate cuts later in the year. Market probabilities lean towards a rate reduction by the Fed, with a 30% chance in May, escalating to 53% in June. Concurrently, the European Central Bank (ECB) faces its rate decision pressures, amidst improved consumer confidence in the Eurozone and ongoing discussions on monetary easing, setting a complex stage for the EUR/USD dynamics as both regions navigate through inflationary pressures and economic forecasts.

Chart EUR/USD by TradingView

On Wednesday, the EUR/USD moved higher and was able to reach near the upper band of the Bollinger Bands. Currently, the price is moving just below the upper band, suggesting a potential upward movement to reach the upper band. Notably, the Relative Strength Index (RSI) maintains its position at 65, signaling a bullish outlook for this currency pair.

Resistance: 1.0845, 1.0896

Support: 1.0783, 1.0723

XAU/USD (4 Hours)

XAU/USD Trajectory Amidst Dollar Strength and Anticipation of FOMC Minutes

As the US Dollar gained momentum with Wall Street’s opening and before the release of the Federal Open Market Committee (FOMC) Minutes, gold prices (XAU/USD) were influenced by a complex interplay of factors. The anticipation surrounding the FOMC minutes, detailing reasons for holding interest rates steady in early 2024, and Chairman Jerome Powell’s remarks on the unlikelihood of a March rate cut, set a cautious tone in the market. Despite recent employment and inflation data backing the Federal Reserve’s wait-and-see approach, shifting rate-cut expectations to June from May, the overall mixed performance of the dollar amidst a lackluster risk appetite and struggling global equities highlights a potentially volatile environment for gold as investors digest these economic cues.

Chart XAU/USD by TradingView

On Wednesday, XAU/USD moved back lower to reach the middle band after reaching near the upper band of the Bollinger Bands. Currently, the price is moving just above the middle band, suggesting a potential upward movement toward the upper band. The Relative Strength Index (RSI) stands at 58, signaling a neutral with a slightly bullish outlook for this pair.

Resistance: $2,030, $2,042

Support: $2,017, $2,004

Economic Data
CurrencyDataTime (GMT + 8)Forecast
EURFrench Flash Manufacturing PMI16:1543.5
EURFrench Flash Services PMI16:1545.7
EURGerman Flash Manufacturing PMI16:3046.1
EURGerman Flash Services PMI16:3048.0
GBPFlash Manufacturing PMI17:3047.5
GBPFlash Services PMI17:3054.2
USDUnemployment Claims21:30217K
USDFlash Manufacturing PMI22:4550.5
USDFlash Services PMI22:4552.4

Forex Market Analysis: U.S. Dollar’s Pre-Fed Minutes Decline and Nvidia’s Q4 Earnings Surge

CURRENCIES:
  • Top of Form U.S. Dollar Performance Pre-Fed Minutes: The U.S. dollar experienced a slight decline due to subdued U.S. yields, with a lack of significant market drivers on Tuesday.
  • Anticipation for FOMC Minutes Release: Market volatility is expected to increase with the upcoming release of the FOMC minutes, which could shed light on the Fed’s inflation outlook and potential timing for rate cuts.
  • Fed’s Stance on Rate Cuts: Recent statements by Fed officials suggest a cautious approach to immediate rate cuts, which could lead to higher U.S. Treasury yields and strengthen the dollar.
  • Potential Market Reactions: If the FOMC minutes indicate a possibility of earlier easing, it may result in lower yields and a weaker dollar, whereas a confirmation of a delayed easing cycle could bolster the dollar.
  • Technical Analysis for USD Currency Pairs: The article will focus on the technical analysis of major USD pairs, including EUR/USD, GBP/USD, and USD/JPY, highlighting key price levels for traders.

STOCK MARKET:
  • Nvidia’s Q4 earnings are viewed as a crucial test for the AI sector, with expectations for a 234% surge in revenue.
  • The company’s stock has seen a remarkable 184% increase over the past year, outperforming rivals like AMD and Intel.
  • Despite a brief moment as the third-most valuable company globally, Nvidia was surpassed by Amazon and Alphabet as of the latest update.
  • For Q4, projections are set for Nvidia to report earnings of $4.60 per share on $20.4 billion in revenue, a significant jump from the previous year.
  • The Data Center segment, fueled by demand for AI, is anticipated to report $17.2 billion in revenue, a dramatic increase from the year before.
  • Meta plans to incorporate 350,000 Nvidia H100 chips into its AI data centers by end of 2024, indicating substantial revenue for Nvidia.
  • Gaming revenue is also expected to rise, from $1.8 billion to $2.7 billion.
  • Forward guidance from Nvidia will be closely watched for indications of sustained AI market strength.
  • Analysts have raised their price targets for Nvidia, reflecting optimistic expectations.
  • Nvidia faces competition from AMD and Intel in AI chips and challenges from companies developing their own AI chips, including Amazon and Google.
  • Nvidia is addressing the threat of customized AI chips by discussing potential collaborations with major tech firms.
  • U.S. export restrictions to China pose a challenge for Nvidia, but the company does not anticipate an immediate financial impact.

Start your CFD Shares Trading journey with VT Markets now!

Tech Stocks Lead Market Downturn Ahead of Nvidia’s Earnings, Major Acquisitions Stir Financial Sectors

On Tuesday, the stock market faced a downturn, heavily influenced by a slump in technology stocks, especially with Nvidia’s earnings report on the horizon, causing its shares to fall by 4.4%. The Dow Jones Industrial Average slightly declined by 0.17%, while more significant drops were observed in the S&P 500 and Nasdaq Composite, decreasing by 0.60% and 0.92%, respectively. This trend reflected broader concerns over the tech sector’s high valuations, with companies like Amazon, Microsoft, and Meta also experiencing losses. Concurrently, major financial transactions grabbed headlines, including Capital One’s acquisition of Discover Financial Services for $35.3 billion and Walmart’s purchase of Vizio for $2.3 billion, both moves sparking notable stock surges. Additionally, currency markets saw fluctuations amid varied economic indicators and policy expectations, affecting the dollar index and EUR/USD pair. These market movements underscore the complexities of sector-specific trends and significant corporate deals, against a backdrop of evolving global economic conditions and monetary policies.

Stock Market Updates

On Tuesday, the stock market experienced a downturn, influenced significantly by a decline in technology stocks, particularly ahead of Nvidia’s earnings report. The Dow Jones Industrial Average saw a slight decrease of 0.17%, closing at 38,563.80, while the S&P 500 and Nasdaq Composite fell by 0.60% and 0.92% respectively. Nvidia’s stock dropped by nearly 4.4% amid concerns over its high valuation despite anticipated strong earnings. This sentiment was echoed across other tech giants, with Amazon, Microsoft, and Meta also recording losses. The tech sector’s valuation, trading at around 30 times forward estimates, has raised doubts about further price-to-earnings (PE) multiple expansion, according to CFRA Research’s chief investment strategist, Sam Stovall.

In addition to the tech sector’s performance, significant financial transactions also captured market attention. Capital One Financial announced its plan to acquire Discover Financial Services in a deal valued at $35.3 billion, which is expected to close between late 2024 and early 2025, causing Discover’s stock to surge by 12.6%. Meanwhile, Walmart revealed its acquisition of TV manufacturer Vizio for $2.3 billion, a move that resulted in a 16% jump in Vizio’s shares and a more than 3% increase in Walmart’s stock following the retailer’s announcement of surpassing quarterly earnings and revenue expectations. These developments highlight the ongoing adjustments within the stock market, influenced by both sector-specific trends and significant corporate deals.

Data by Bloomberg

On Tuesday, the market saw a mixed performance across various sectors with an overall price decline of 0.60% across all sectors. Consumer Staples emerged as the top performer, recording a gain of 1.13%, while Information Technology faced the steepest decline, dropping by 1.27%. Sectors such as Consumer Discretionary and Energy also saw significant losses, decreasing by 1.00% and 0.95% respectively. Other sectors experienced more moderate changes, with Communication Services, Utilities, Real Estate, Materials, Industrials, Financials, and Health Care witnessing declines ranging from -0.11% to -0.40%.

Currency Market Updates

The currency markets have recently experienced fluctuations, notably with the dollar index and the EUR/USD pair both witnessing a rise of 0.27%. This movement came amidst a complex backdrop of economic indicators and policy expectations. On one hand, the U.S. Treasury yields hit a resistance last week, influenced by a mix of conflicting domestic data, including softer Philly Fed and Leading Economic Index (LEI) figures, as well as external factors like China’s rate cut. These developments have somewhat dented the dollar’s strength. Furthermore, the anticipation around the Federal Reserve’s rate cuts for 2024 has seen a significant adjustment, with the market’s expectations dialing down from five to six rate cuts to less than four, aligning more closely with the Fed’s December projections of 75 basis points in cuts.

The detailed dynamics of these currency movements also reflect broader global economic sentiments and policy maneuvers. For instance, the EUR/USD rally on Tuesday was noteworthy, overcoming key resistance levels and indicating a potential shift in market sentiment. Meanwhile, the USD/JPY pair’s movements have been influenced by the Treasury-Japanese Government Bond (JGB) yield spreads, alongside speculations around the Bank of Japan’s policy directions and their implications for the currency pair. Additionally, the broader implications of these currency shifts, alongside upcoming economic data releases like global flash PMIs and U.S. jobless claims, are keenly awaited by the markets. They are expected to provide further clarity on the U.S. economic performance and its impact on currency valuations, especially as investors and analysts parse through the Fed’s upcoming meeting minutes for insights into future rate adjustments.

Picks of the Day Analysis
EUR/USD (4 Hours)

EUR/USD Peaks Amid Speculation on Fed Rate Decisions

The EUR/USD pair reached a new high since early February, closing near 1.0800, as it gained from the widespread weakness of the US Dollar. This shift was largely influenced by market speculation that the Federal Reserve might postpone interest rate cuts, with expectations for a May reduction significantly dropping post the latest Fed meeting. Despite a light economic calendar, the euro found additional support from positive data releases like the EU Current Account surplus and an increase in Construction Output. Investors now await the FOMC Meeting Minutes for further direction on the Fed’s rate policy outlook.

Chart EUR/USD by TradingView

On Tuesday, the EUR/USD moved higher and was able to reach the upper band of the Bollinger Bands. Currently, the price is moving just below the upper band, suggesting a potential slight downward movement to reach the middle band before it goes back higher. Notably, the Relative Strength Index (RSI) maintains its position at 62, signaling a neutral but bullish outlook for this currency pair.

Resistance: 1.0845, 1.0896

Support: 1.0783, 1.0723

XAU/USD (4 Hours)

XAU/USD Hits Week-High as US Dollar Weakens Amid Rate Speculation

Spot Gold (XAU/USD) continues its ascent, marking a fourth day of gains by reaching around $2,030, a peak not seen in over a week. This surge comes as the US Dollar weakens, driven by increasing speculation that the Federal Reserve will maintain elevated interest rates longer than some investors expected. Despite the resilient US economy, bets against the Fed’s intentions have been cautioned against by officials, shifting market expectations towards a later rate adjustment, now more heavily anticipated in June rather than March. Meanwhile, Wall Street experiences a downturn, though mitigated by some positive earnings reports, and a recovery in government bond yields further pressures the USD, contributing to Gold’s upward momentum.

Chart XAU/USD by TradingView

On Tuesday, XAU/USD moved back lower after reaching the upper band of the Bollinger Bands. Currently, the price is moving between the upper and middle bands, suggesting a potential downward movement toward the middle band. The Relative Strength Index (RSI) stands at 59, signaling a neutral but bullish outlook for this pair.

Resistance: $2,030, $2,042

Support: $2,017, $2,004

Economic Data
CurrencyDataTime (GMT + 8)Forecast
AUDWage Price Index q/q09:300.9%
USDFOMC Meeting Minutes03:00 (22nd) 

STP账户交易设置调整通知 – 2024年2月20日

尊敬的用户:

您好!

为提供广大客户更优质的交易环境,我们很高兴地在此宣布将于下述时间放宽部份账户类型的相关交易条件。VT Markets 将于 2024 年 2 月 26 日调整 STP 账户的部份交易设置,详请参考如下:

STP 账户 原设置 调整后设置
强制平仓预付款比例 50% 20%
追加预付款通知水平 80% 50%

温馨提醒:

1. 本次调整除上表中的设置之外,其他所有交易细则维持不变。

如您有任何疑问,我们的团队将十分乐意为您解答。
请留言或发邮件至 [email protected] 或联系在线客服。

Forex Market Analysis: Euro’s Downtrend and US Market Inactivity Amid Economic Shifts

CURRENCIES:
  • Top of FormEuro’s Minor Decline: In a holiday-affected market, the Euro slightly dropped against the US Dollar.
  • Persistent Downtrend: The Euro continues its year-long downtrend.
  • Anticipation for German PMI: Market eyes are on Germany’s PMI data release this week, which could influence movement.
  • US Market Closure: The US market was mostly inactive due to Presidents’ Day, with significant trading expected to resume later in the week.
  • Upcoming Fed Minutes: Federal Reserve’s last meeting minutes are due Wednesday, potentially impacting market despite shifted rate-cut expectations to June.
  • German Economic Indicator: Thursday’s German Purchasing Managers Index (PMI) is forecasted to show continued manufacturing contraction, potentially affecting the Euro.
  • ECB’s Rate Decision: High interest rates remain as the European Central Bank (ECB) awaits clearer signs of inflation control, with no immediate rate cuts expected.

STOCK MARKET:
  • Earnings: Barclays (BCS), Caesars Entertainment (CZR), Diamondback Energy (FANG), Home Depot (HD), KBR (KBR), Medtronic (MDT), Palo Alto Networks (PANW), Teladoc Health (TDOC), Toll Brothers (TOL), Walmart (WMT).
  • Economic news: Philadelphia Fed Non-Manufacturing Activity, February (-3.7 previously); Leading index, January (-0.3% expected, -0.1% prior).
  • Nvidia’s Earnings Report: Nvidia’s earnings, significant for its AI leadership, are set for release on Wednesday, marking a pivotal moment in a shortened trading week due to the Presidents’ Day holiday.
  • Market Recovery and Performance: Despite a dip from an unexpected inflation report, the S&P 500 hit a record high, while the Dow Jones and Nasdaq experienced slight movements.
  • Economic Data’s Impact: Recent CPI, PPI, and retail sales data have challenged the soft-landing narrative, affecting investor sentiment regarding Federal Reserve rate cuts.
  • Investor Sentiment Shift: Expectations for the Fed’s interest rate cuts have been adjusted, with a June cut now more likely than earlier anticipated.
  • Broader Market Outlook: Despite challenges, the overall market narrative remains unchanged, with AI stocks surging and a general expectation for policy recalibration within the year.

Start your CFD Shares Trading journey with VT Markets now!

Back To Top
server

您好 👋

我能帮您什么吗?

立即与我们的团队聊天

在线客服

通过以下方式开始对话...

  • Telegram
    hold 维护中
  • 即将推出...

您好 👋

我能帮您什么吗?

telegram

用手机扫描二维码即可开始与我们聊天,或 点击这里.

没有安装 Telegram 应用或桌面版?请使用 Web Telegram .

QR code