立即开始交易 – 点击这里创建您的 VT Markets 真实账户
Back
立即开始交易 – 点击这里创建您的 VT Markets 真实账户
立即开始交易 – 点击这里创建您的 VT Markets 真实账户
立即开始交易 – 点击这里创建您的 VT Markets 真实账户
立即开始交易 – 点击这里创建您的 VT Markets 真实账户


黄金在2026年的走势偏震荡,让不少人困惑。地缘政治紧张、全球增长放缓等宏观环境(影响整体经济的大背景)看似利多黄金,但金价却在“避险”时段意外下挫。要理解这一点,需要把短期波动抛开,聚焦正在发生的结构性重估。
传统上,市场恐慌时黄金往往走强。但近几个月,风险资产(如股票等较高波动的资产)大跌时,并不总是立刻带动黄金上涨。原因不是黄金失去避险属性,而是资金流动性(资产能否快速换成现金的能力)在作祟。
当市场突然进入避险模式,大型机构会优先寻找流动性,也就是卖出“最好卖、最快变现”的资产,而不一定是它们最想卖的。黄金是全球流动性最高的资产之一,容易快速卖出换现金,因此常被当作“筹钱工具”,而不是避险或保值工具。
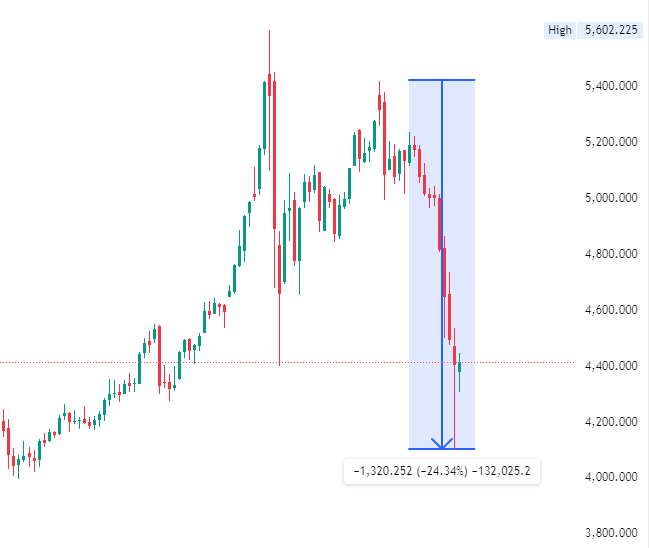
同时,股票与衍生品(从股票、利率、汇率等“延伸出来”的合约,如期货与期权)波动加大,会提高追缴保证金(当仓位亏损时,经纪商要求追加资金,否则会强制平仓)的风险。为应对这种压力,大资金往往被迫全面减仓。黄金也会被卷入跨市场的抛售,短期承压,即使长期基本面仍偏多。
对散户来说,这与“恐慌时黄金应上涨”的认知不同。但现实是:恐慌的第一阶段往往是卖出套现,而不是买入布局。
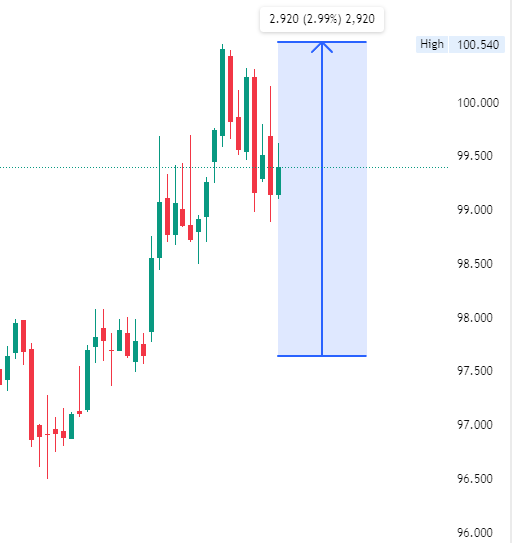
美元仍是短期关键变量。全球资金寻求安全时,往往先流向美元计价资产,令市场资金更紧,压低金价。但这种强势通常只是阶段性。一旦资金紧张缓解,机构往往会回流黄金,把它当作对冲货币不稳定与货币贬值(同样的钱买到的东西变少)的工具。
美元能提供短期安全感,但主要经济体的长期财政压力(政府债务与赤字压力)会限制政策制定者长期维持紧缩(高利率、收紧资金)的能力。最终,这种环境更利于黄金相对法定货币(由政府发行、靠信用支撑的货币,如美元、欧元等)走强,成为核心配置资产。
当前黄金市场最明显的分歧之一,是机构资金的布局与散户情绪。
散户更容易被价格波动牵动情绪。急跌会引发恐慌,导致不少人过早离场,以为涨势已结束。
机构的时间周期更长,配置更有纪律。它们把下跌视为更好的买入区间,而不是失败信号。机构会看更广的宏观因素,包括实际利率(名义利率减去通胀后的“真实回报”)、央行政策与长期通胀预期(市场对未来物价上涨的估计)。
机构通常把波动视为市场周期的一部分。
虽然原油与黄金都属于大宗商品,但驱动因素不同。
原油更贴近经济活动与供需;黄金更受货币环境与投资者心理影响。
两者的联系主要通过通胀。油价上涨会推高通胀预期,从而利好黄金。能源成本飙升会加大央行压力,政策可能转向更宽松或更难继续紧缩,长期更有利黄金。
在中东冲突之前,油价下行常被视为全球需求转弱信号,触发避险情绪;而避险初期的“卖出套现”又可能因流动性需求而先压低黄金。
自战争爆发以来,油价若长期维持高位,会让通胀问题重回央行视野,长期可能支持金价。
因此,油价不直接决定金价,但会显著影响宏观环境,进而影响黄金。
2026年还是牛市之年吗?尽管波动加大,但“重估到5,000美元”的逻辑仍在:各国央行降低对法定货币的依赖、实际回报持续被侵蚀。当前回调更像是去杠杆与被迫卖出的周期,为市场重新打底。
立即开始交易 – 点击这里创建您的 VT Markets 真实账户
立即开始交易 – 点击这里创建您的 VT Markets 真实账户
立即开始交易 – 点击这里创建您的 VT Markets 真实账户
立即开始交易 – 点击这里创建您的 VT Markets 真实账户
立即开始交易 – 点击这里创建您的 VT Markets 真实账户
立即开始交易 – 点击这里创建您的 VT Markets 真实账户


